| Param | Original file | Final file |
|---|---|---|
| Filename | modeM0/AS1G05_218T01_9000001394_09802cztM0_level2.evt | modeM0/AS1G05_218T01_9000001394_09802cztM0_level2_quad_clean.evt |
| Size (bytes) | 556,323,840 | 78,863,040 |
| Size | 530.6 MB | 75.2 MB |
| Events in quadrant A | 3,310,924 | 481,889 |
| Events in quadrant B | 3,402,493 | 487,767 |
| Events in quadrant C | 3,238,177 | 472,351 |
| Events in quadrant D | 6,412,582 | 448,931 |
| Mode SS | |||
|---|---|---|---|
| Quadrant | BADHDUFLAG | Total packets | Discarded packets |
| A | 0 | 148 | 0 |
| B | 0 | 148 | 2 |
| C | 0 | 148 | 0 |
| D | 0 | 148 | 0 |
| Mode M0 | |||
|---|---|---|---|
| Quadrant | BADHDUFLAG | Total packets | Discarded packets |
| A | 0 | 14685 | 78 |
| B | 0 | 14803 | 97 |
| C | 0 | 14692 | 81 |
| D | 0 | 24105 | 179 |
| Mode M9 | |||
|---|---|---|---|
| Quadrant | BADHDUFLAG | Total packets | Discarded packets |
| A | 0 | 5 | 0 |
| B | 0 | 5 | 0 |
| C | 0 | 5 | 0 |
| D | 0 | 5 | 0 |
| Quadrant | Total seconds | Saturated seconds | Saturation percentage |
|---|---|---|---|
| A | 7137 | 129 | 1.807482% |
| B | 7129 | 113 | 1.585075% |
| C | 7135 | 86 | 1.205326% |
| D | 7126 | 640 | 8.981196% |
Noise dominated data is calculated using 1-second bins in cleaned event files. If a bin has >2000 counts, and if more than 50% of those come from <1% of pixels, then it is considered to be noise-dominated and hence unusable.
| Quadrant | # 1 sec bins | Bins with >0 counts | Bins with >2000 counts | High rate bins dominated by noise | Noise dominated (total time) | Noise dominated (detector-on time) | Marked lightcurve |
|---|---|---|---|---|---|---|---|
| A | 7640 | 7166 | 0 | 0 | 0.00% | 0.00% | 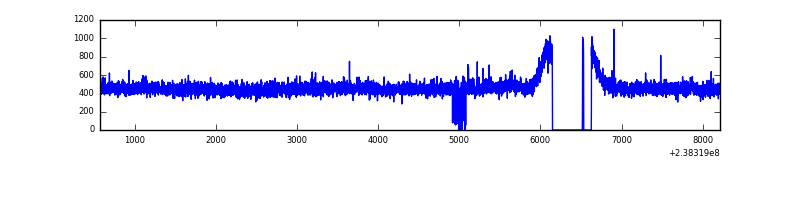 |
| B | 7640 | 7169 | 1 | 1 | 0.01% | 0.01% | 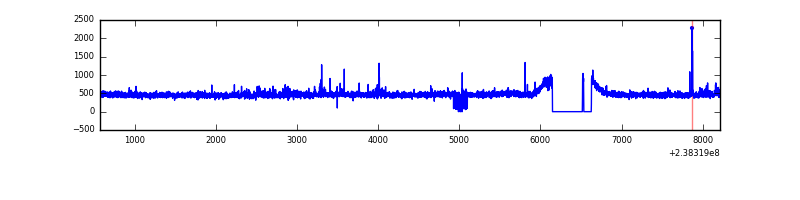 |
| C | 7640 | 7162 | 1 | 1 | 0.01% | 0.01% | 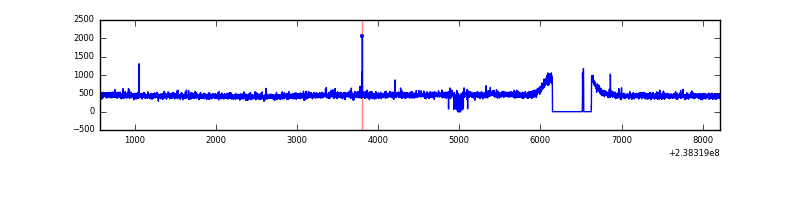 |
| D | 7640 | 7160 | 414 | 414 | 5.42% | 5.78% | 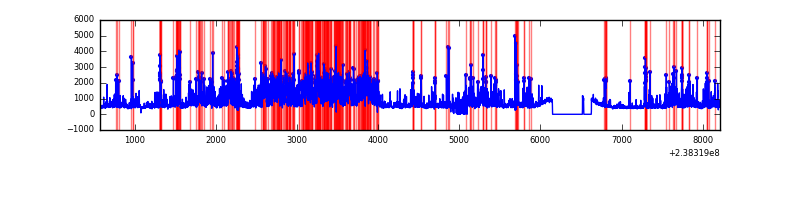 |
Top three noisy pixels from each quadrant. If the there are fewer than three noisy pixels in the level2.evt file, extra rows are filled as -1
| Pixel properties | Quadrant properties | ||||||
|---|---|---|---|---|---|---|---|
| Quadrant | DetID | PixID | Counts | Sigma | Mean | Median | Sigma |
| A | 0 | 226 | 7810 | 39.91 | 858 | 839 | 174.6 |
| A | 12 | 194 | 6934 | 34.9 | 858 | 839 | 174.6 |
| A | 13 | 253 | 5897 | 28.96 | 858 | 839 | 174.6 |
| B | 0 | 214 | 36419 | 213.82 | 855 | 835 | 166.4 |
| B | 4 | 173 | 23639 | 137.03 | 855 | 835 | 166.4 |
| B | 12 | 111 | 19499 | 112.15 | 855 | 835 | 166.4 |
| C | 14 | 234 | 7534 | 35.01 | 824 | 828 | 191.5 |
| C | 13 | 61 | 6118 | 27.62 | 824 | 828 | 191.5 |
| C | 9 | 237 | 5994 | 26.97 | 824 | 828 | 191.5 |
| D | 1 | 52 | 2901552 | 13967.62 | 800 | 783 | 207.7 |
| D | 9 | 85 | 145865 | 698.59 | 800 | 783 | 207.7 |
| D | 2 | 152 | 132373 | 633.62 | 800 | 783 | 207.7 |
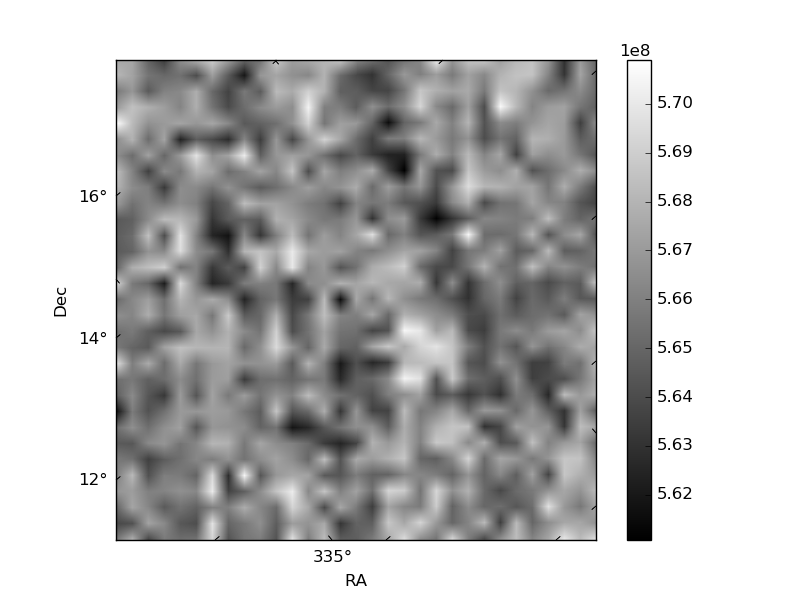
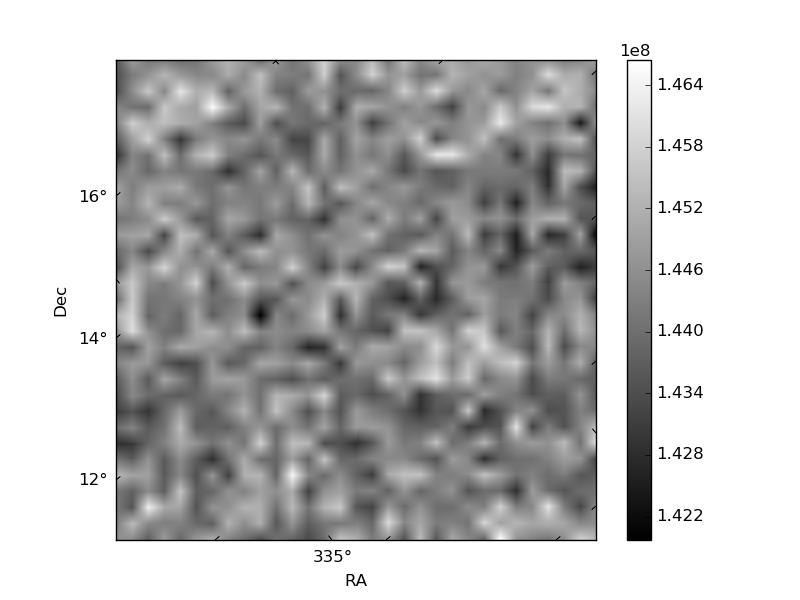
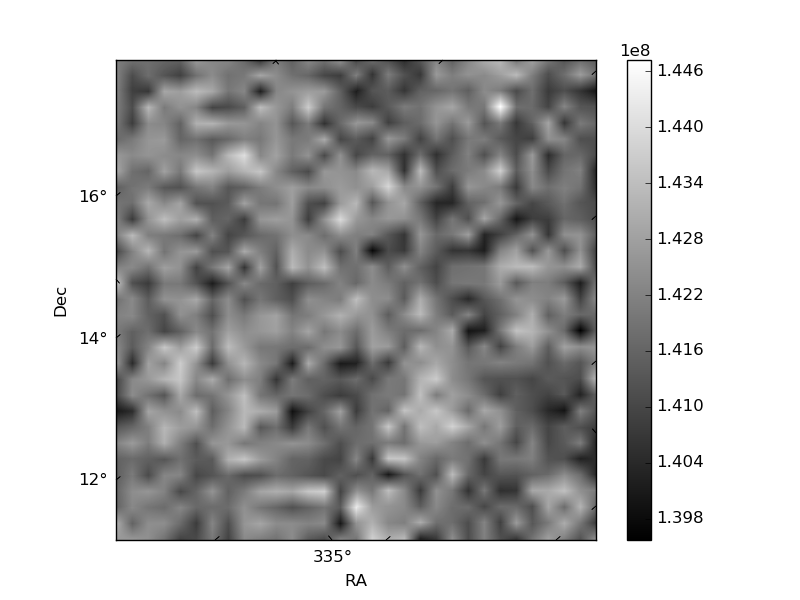
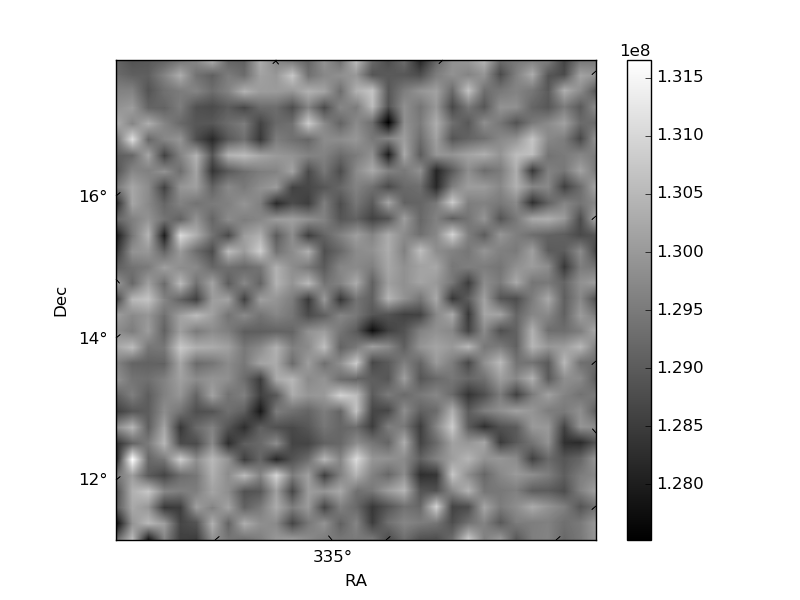
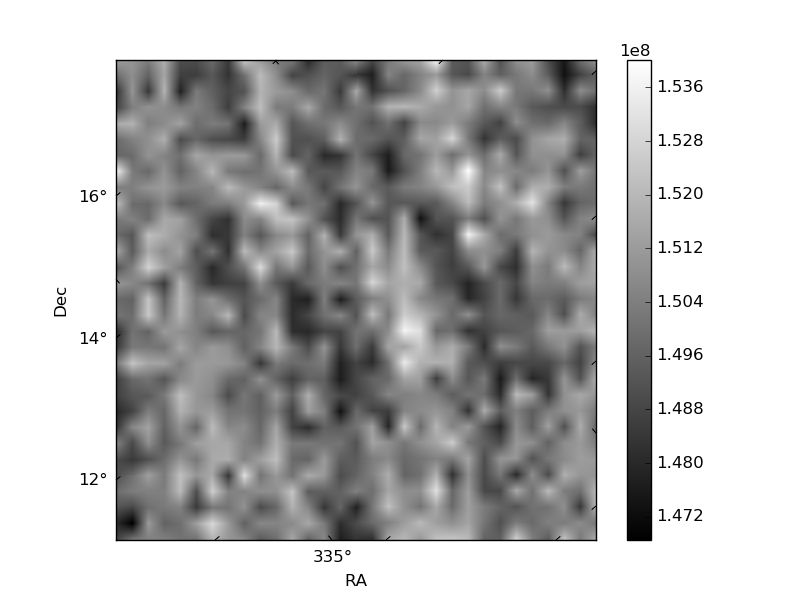
Histogram calculated using DETX and DETY for each event in the final _common_clean file
| Quadrant A | 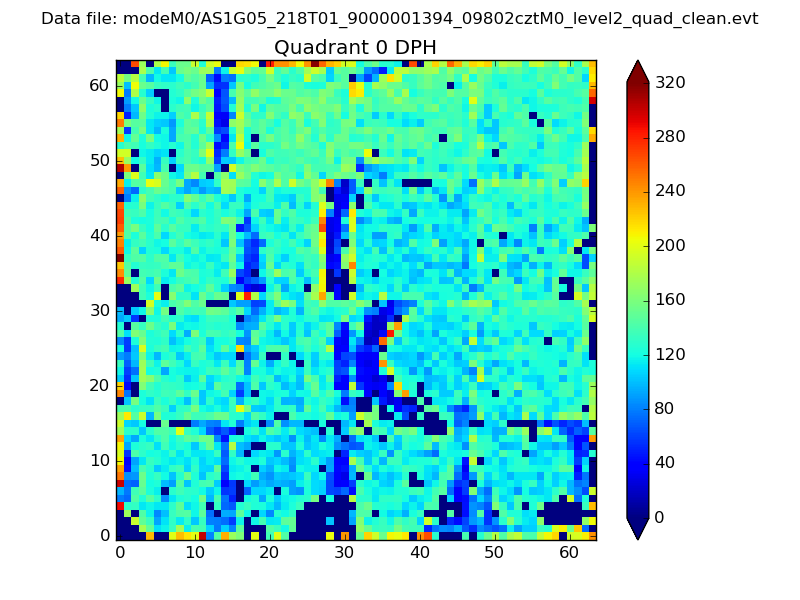 |
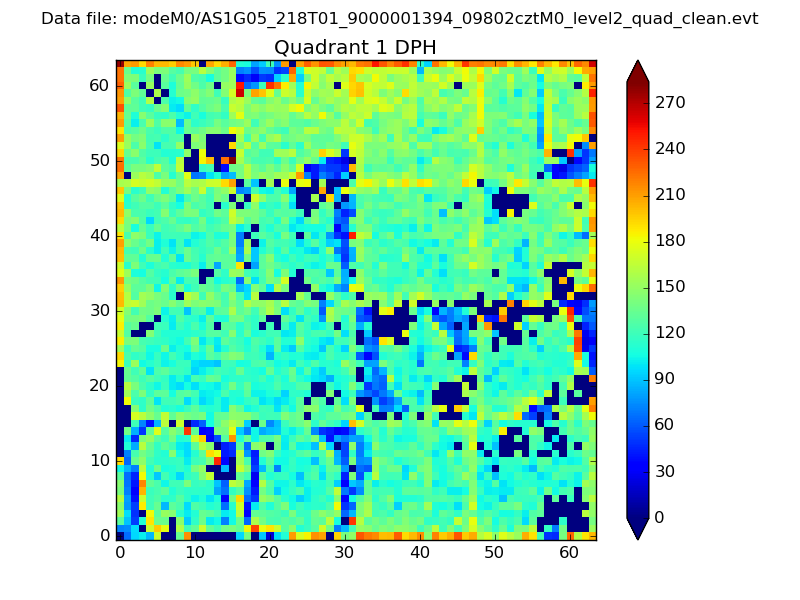 |
Quadrant B |
|---|---|---|---|
| Quadrant D | 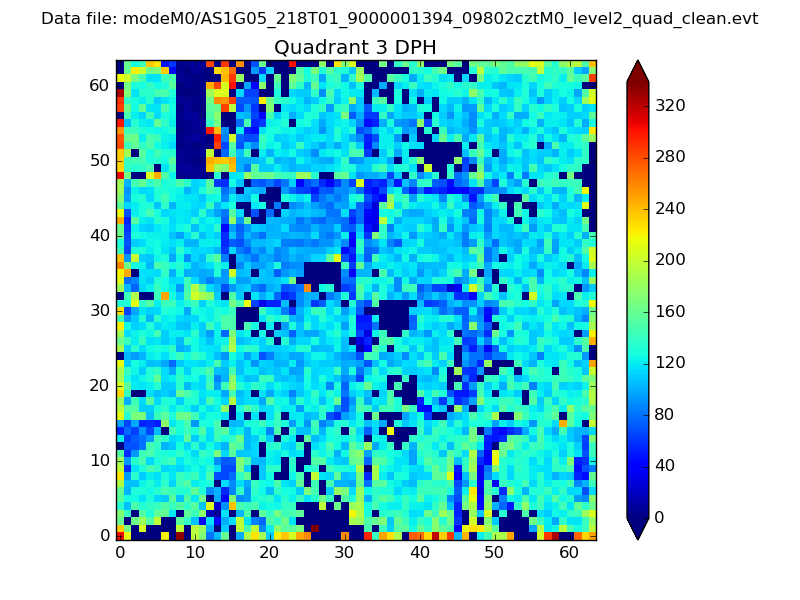 |
 |
Quadrant C |
| Plot type | Count rate plots | Images |
|---|---|---|
| Comparison with Poisson distribution Blue bars denote a histogram of data divided into 1 sec bins. Red curve is a Poisson curve with rate = median count rate of data. |
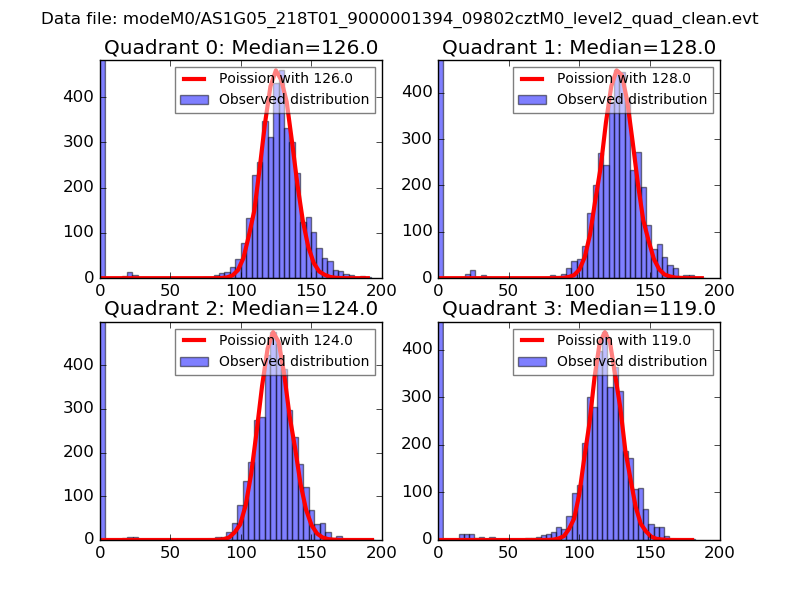 |
 |
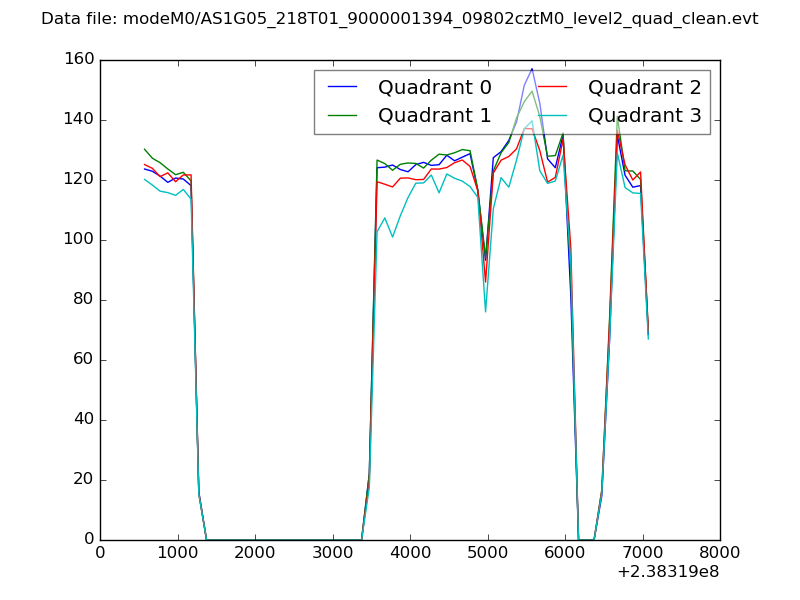
| Quadrant-wise count rates Data is divided into 100 sec bins |
 |
|
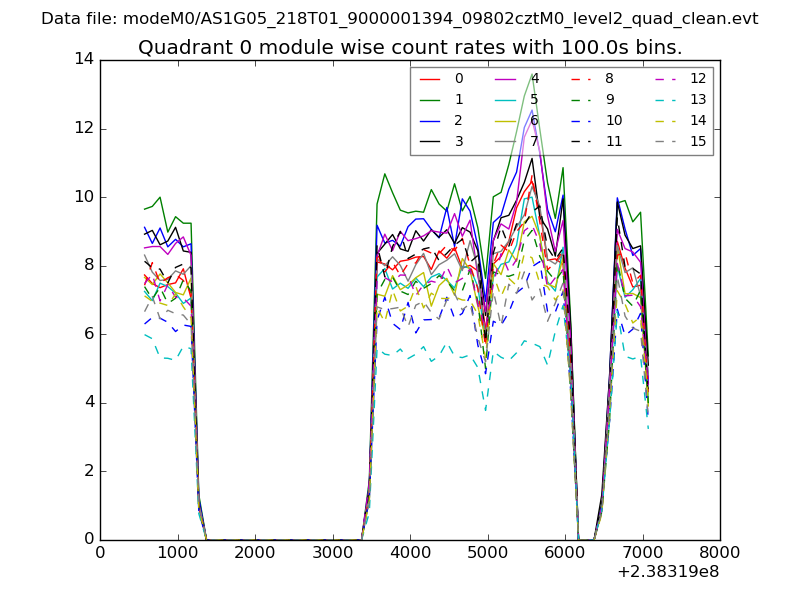
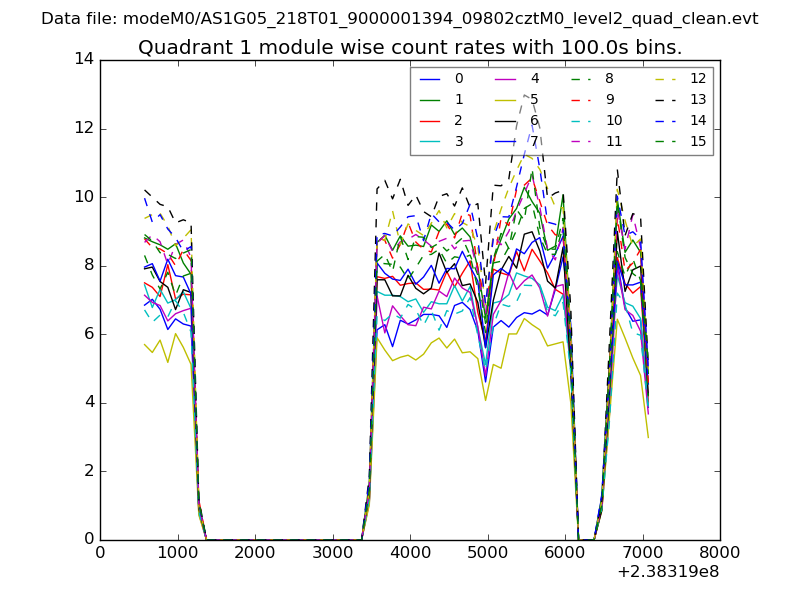
| Module-wise count rates for Quadrant A Data is divided into 100 sec bins |
 |
 |
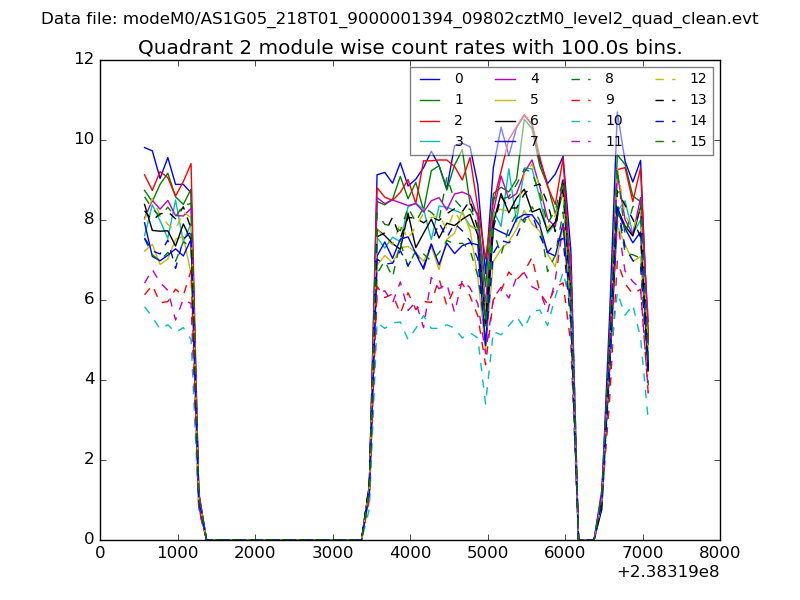
| Module-wise count rates for Quadrant B Data is divided into 100 sec bins |
 |
 |
| Module-wise count rates for Quadrant C Data is divided into 100 sec bins |
 |
 |
| Module-wise count rates for Quadrant D Data is divided into 100 sec bins |
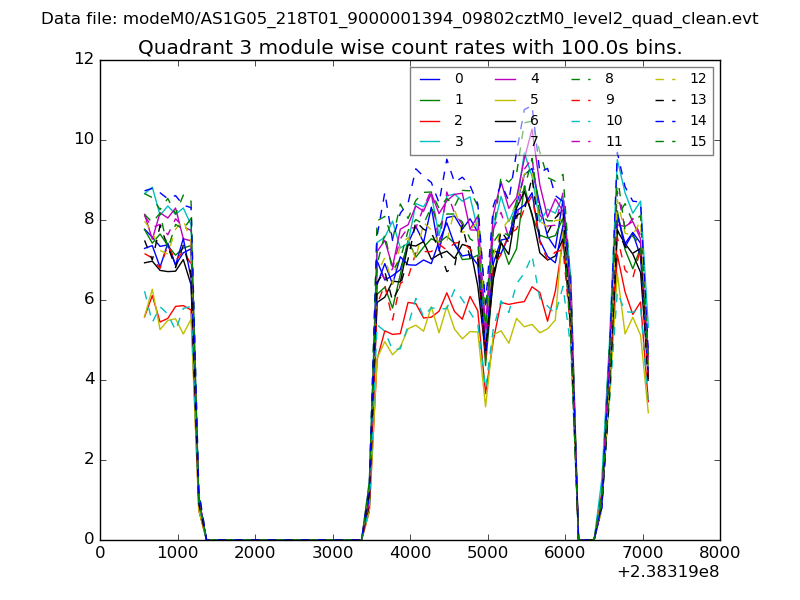 |
 |
| Parameter | Plot |
|---|---|
| CZT HV Monitor | 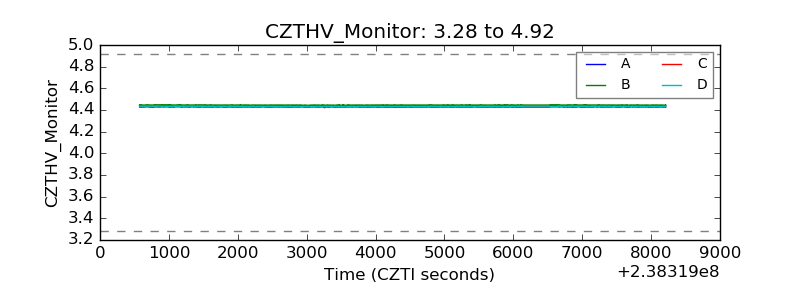 |
| D_VDD | 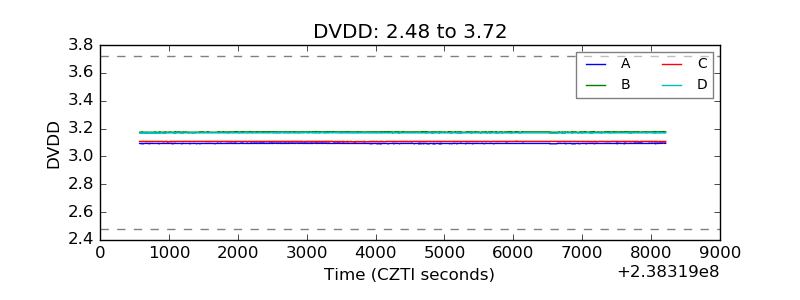 |
| Temperature 1 | 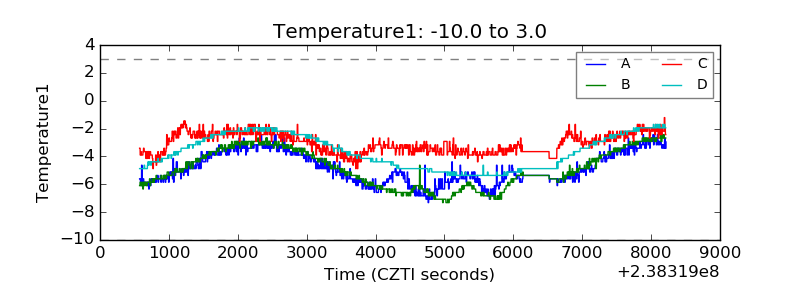 |
| Veto HV Monitor | 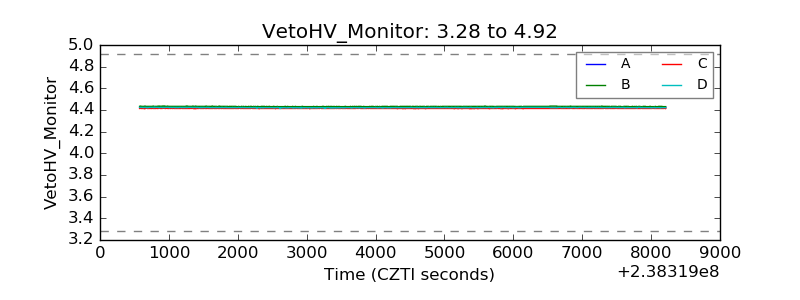 |
| Veto LLD | 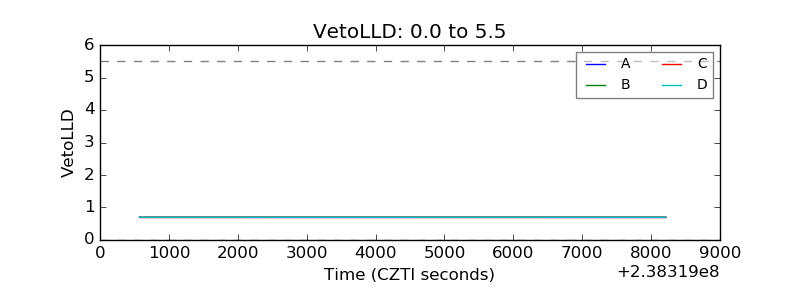 |
| Alpha Counter | 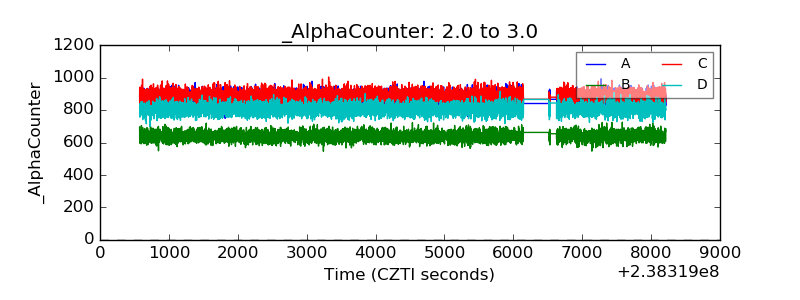 |
| _CPM_Rate | 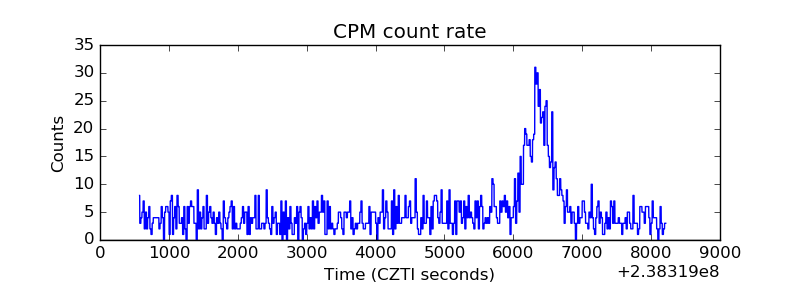 |
| CZT Counter |  |
| +2.5 Volts monitor |  |
| +5 Volts monitor |  |
| _ROLL_ROT | 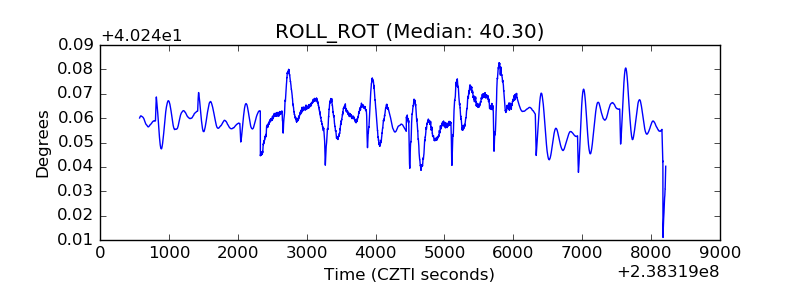 |
| _Roll_DEC | 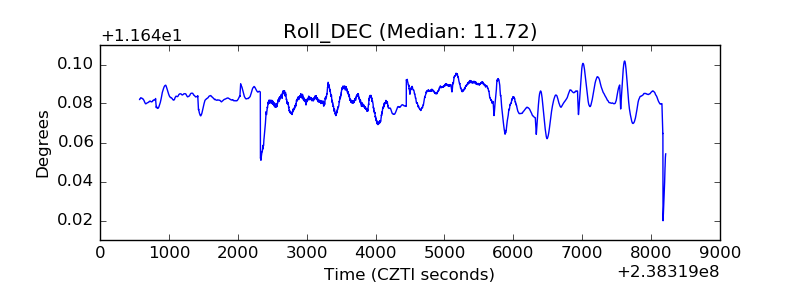 |
| _Roll_RA |  |
| Veto Counter | 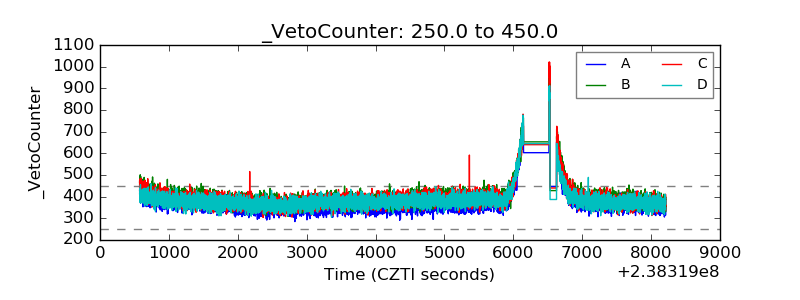 |