| Param | Original file | Final file |
|---|---|---|
| Filename | modeM0/AS1G05_218T01_9000001394_09803cztM0_level2.evt | modeM0/AS1G05_218T01_9000001394_09803cztM0_level2_quad_clean.evt |
| Size (bytes) | 603,786,240 | 83,736,000 |
| Size | 575.8 MB | 79.9 MB |
| Events in quadrant A | 3,737,708 | 509,983 |
| Events in quadrant B | 4,014,258 | 513,097 |
| Events in quadrant C | 3,686,008 | 502,991 |
| Events in quadrant D | 6,328,546 | 477,041 |
| Mode SS | |||
|---|---|---|---|
| Quadrant | BADHDUFLAG | Total packets | Discarded packets |
| A | 0 | 166 | 16 |
| B | 0 | 166 | 6 |
| C | 0 | 165 | 11 |
| D | 0 | 166 | 12 |
| Mode M0 | |||
|---|---|---|---|
| Quadrant | BADHDUFLAG | Total packets | Discarded packets |
| A | 0 | 17164 | 863 |
| B | 0 | 17823 | 967 |
| C | 0 | 17294 | 889 |
| D | 0 | 25833 | 1857 |
| Mode M9 | |||
|---|---|---|---|
| Quadrant | BADHDUFLAG | Total packets | Discarded packets |
| A | 0 | 5 | 0 |
| B | 0 | 5 | 0 |
| C | 0 | 5 | 0 |
| D | 0 | 5 | 0 |
| Quadrant | Total seconds | Saturated seconds | Saturation percentage |
|---|---|---|---|
| A | 7685 | 395 | 5.139883% |
| B | 7660 | 440 | 5.744125% |
| C | 7679 | 332 | 4.323480% |
| D | 7545 | 752 | 9.966865% |
Noise dominated data is calculated using 1-second bins in cleaned event files. If a bin has >2000 counts, and if more than 50% of those come from <1% of pixels, then it is considered to be noise-dominated and hence unusable.
| Quadrant | # 1 sec bins | Bins with >0 counts | Bins with >2000 counts | High rate bins dominated by noise | Noise dominated (total time) | Noise dominated (detector-on time) | Marked lightcurve |
|---|---|---|---|---|---|---|---|
| A | 8566 | 8006 | 0 | 0 | 0.00% | 0.00% | 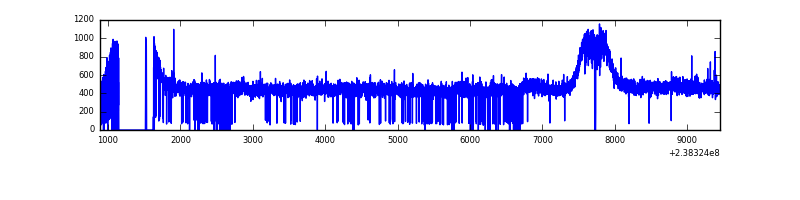 |
| B | 8566 | 8008 | 15 | 15 | 0.18% | 0.19% | 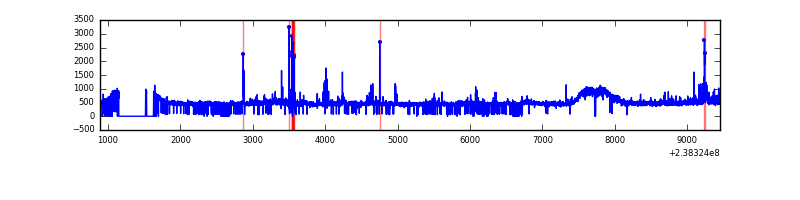 |
| C | 8565 | 8020 | 0 | 0 | 0.00% | 0.00% | 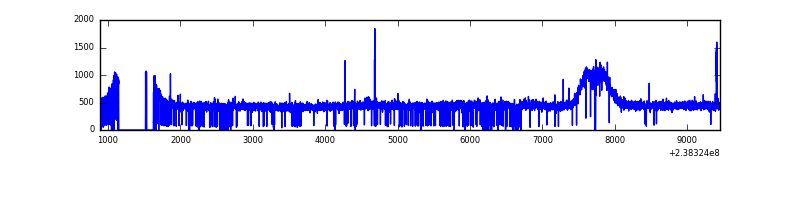 |
| D | 8566 | 7973 | 284 | 284 | 3.32% | 3.56% | 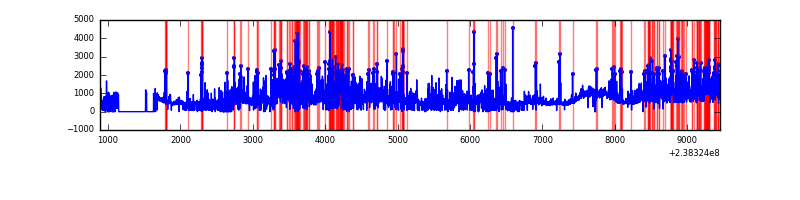 |
Top three noisy pixels from each quadrant. If the there are fewer than three noisy pixels in the level2.evt file, extra rows are filled as -1
| Pixel properties | Quadrant properties | ||||||
|---|---|---|---|---|---|---|---|
| Quadrant | DetID | PixID | Counts | Sigma | Mean | Median | Sigma |
| A | 0 | 226 | 8691 | 38.68 | 970 | 948 | 200.2 |
| A | 12 | 194 | 8021 | 35.33 | 970 | 948 | 200.2 |
| A | 3 | 137 | 4717 | 18.83 | 970 | 948 | 200.2 |
| B | 0 | 214 | 78239 | 406.8 | 960 | 936 | 190.0 |
| B | 4 | 239 | 77506 | 402.94 | 960 | 936 | 190.0 |
| B | 4 | 173 | 25900 | 131.37 | 960 | 936 | 190.0 |
| C | 5 | 128 | 12024 | 50.11 | 936 | 941 | 221.2 |
| C | 14 | 234 | 8347 | 33.49 | 936 | 941 | 221.2 |
| C | 13 | 61 | 7043 | 27.59 | 936 | 941 | 221.2 |
| D | 1 | 52 | 2557044 | 10754.16 | 904 | 881 | 237.7 |
| D | 2 | 152 | 158677 | 663.87 | 904 | 881 | 237.7 |
| D | 9 | 85 | 43225 | 178.15 | 904 | 881 | 237.7 |
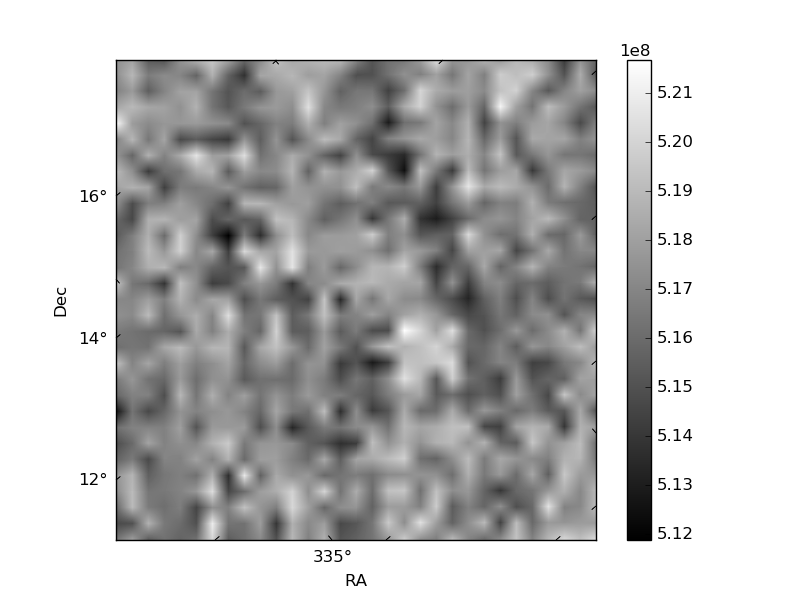
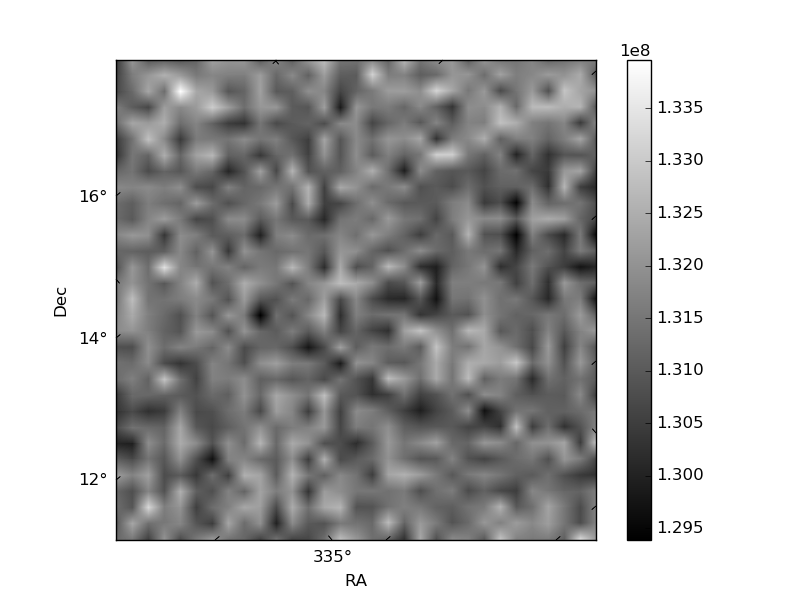
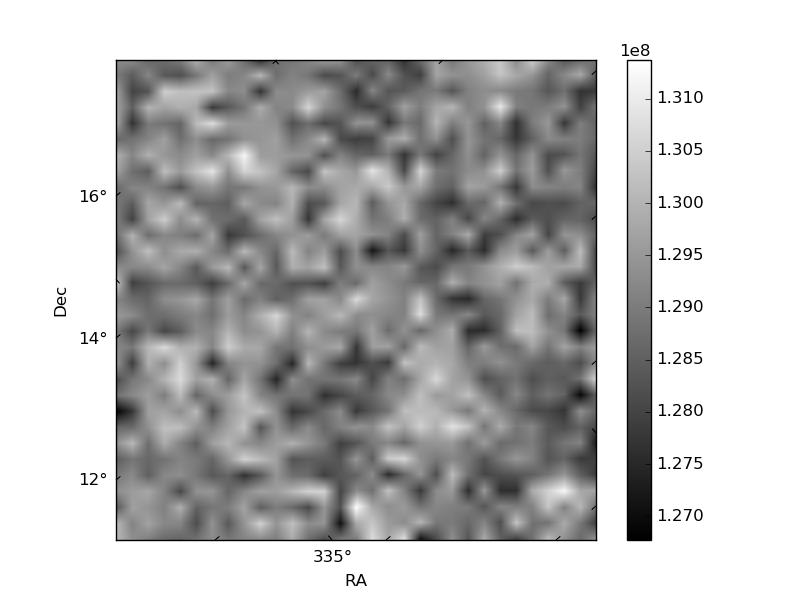
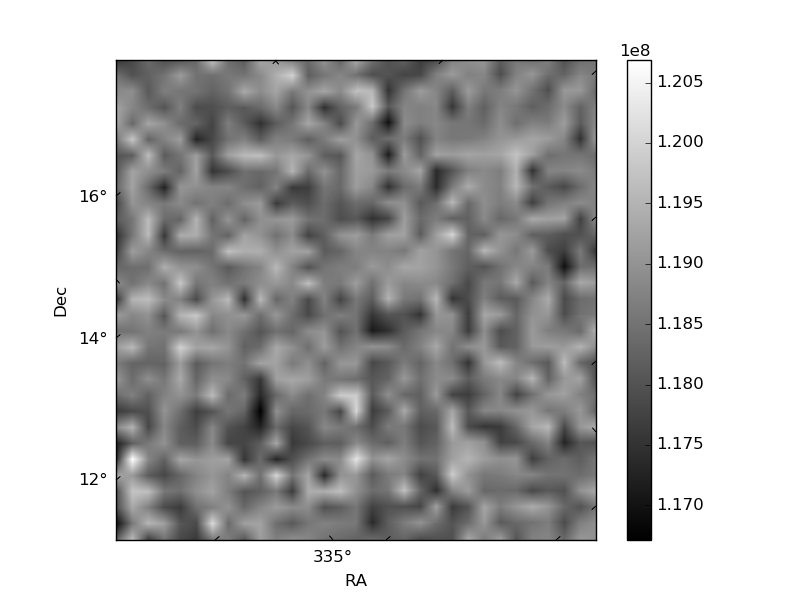
Histogram calculated using DETX and DETY for each event in the final _common_clean file
| Quadrant A | 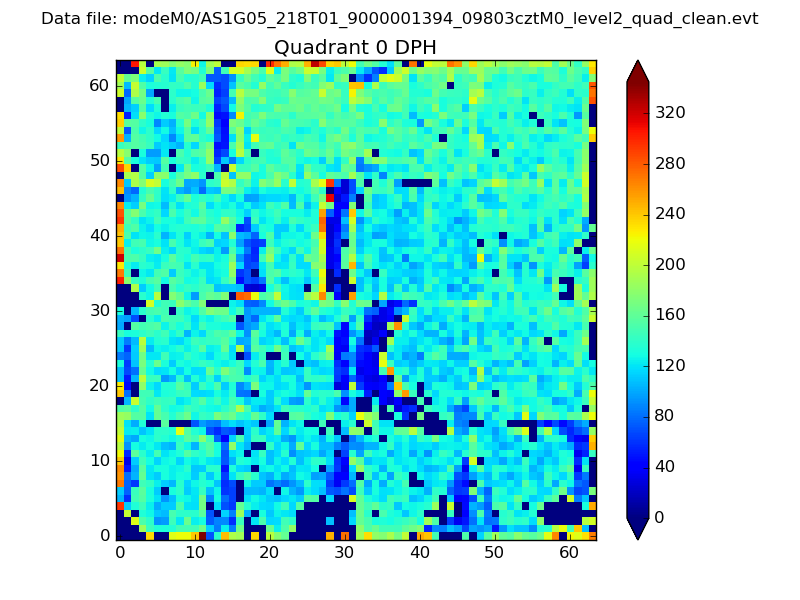 |
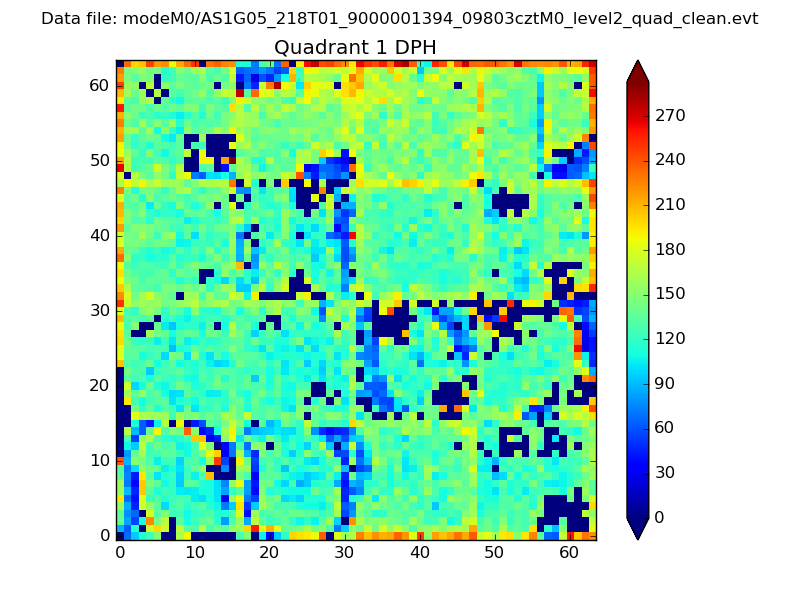 |
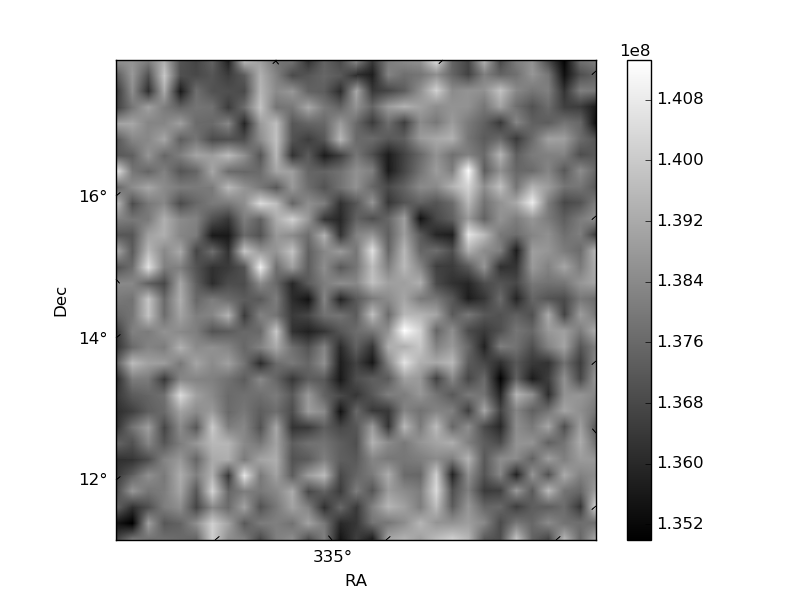
Quadrant B |
|---|---|---|---|
| Quadrant D | 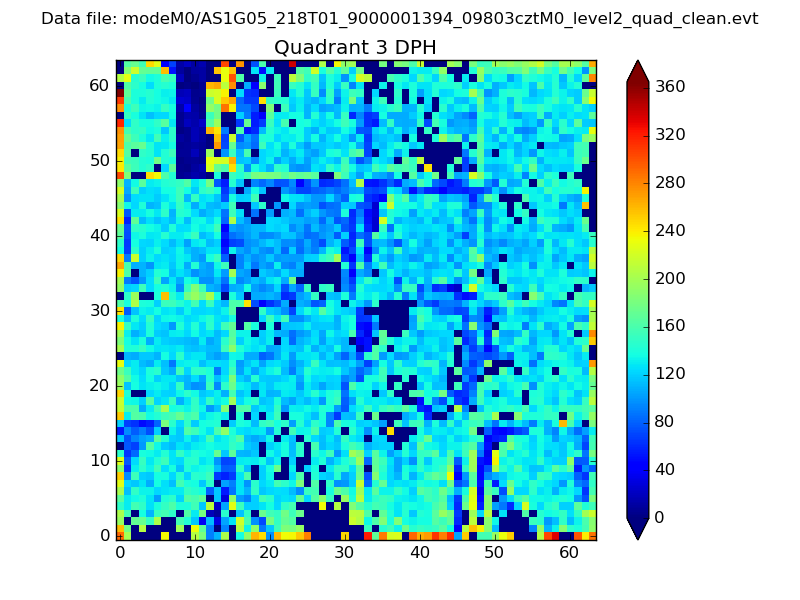 |
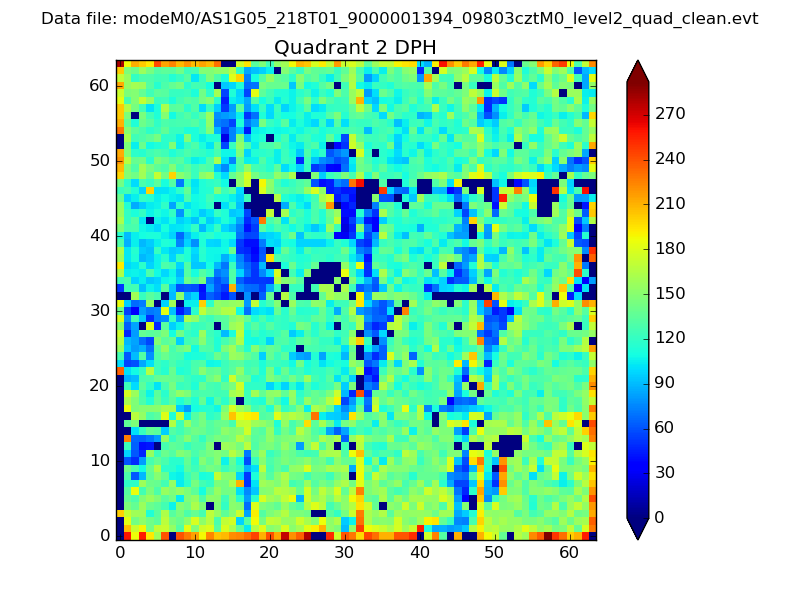 |
Quadrant C |
| Plot type | Count rate plots | Images |
|---|---|---|
| Comparison with Poisson distribution Blue bars denote a histogram of data divided into 1 sec bins. Red curve is a Poisson curve with rate = median count rate of data. |
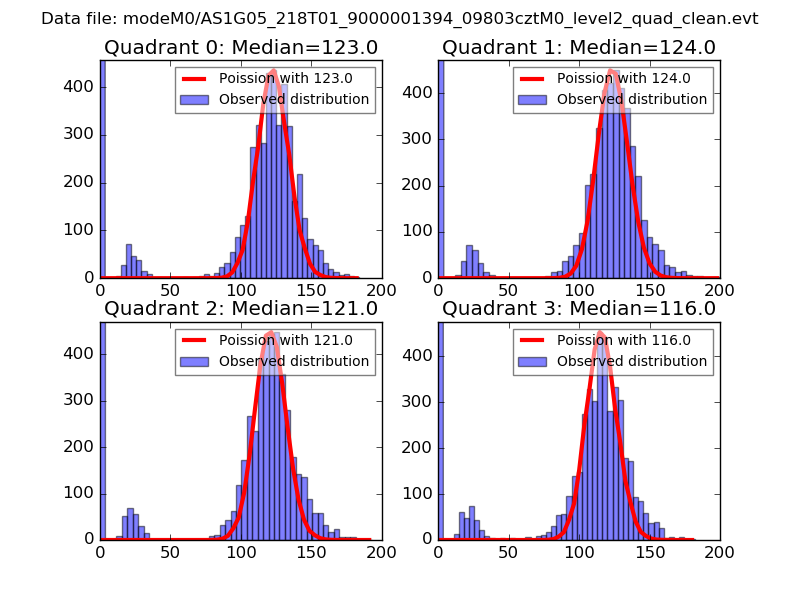 |
 |
| Quadrant-wise count rates Data is divided into 100 sec bins |
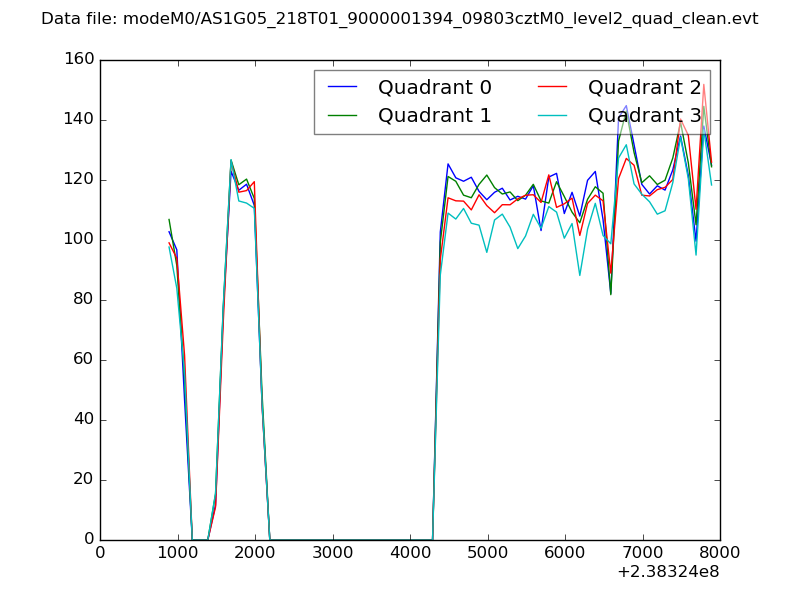 |
|
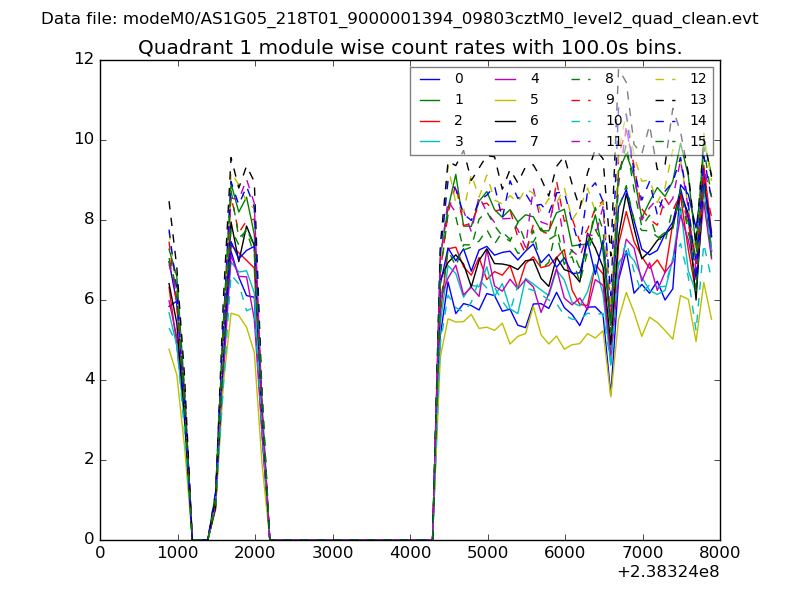
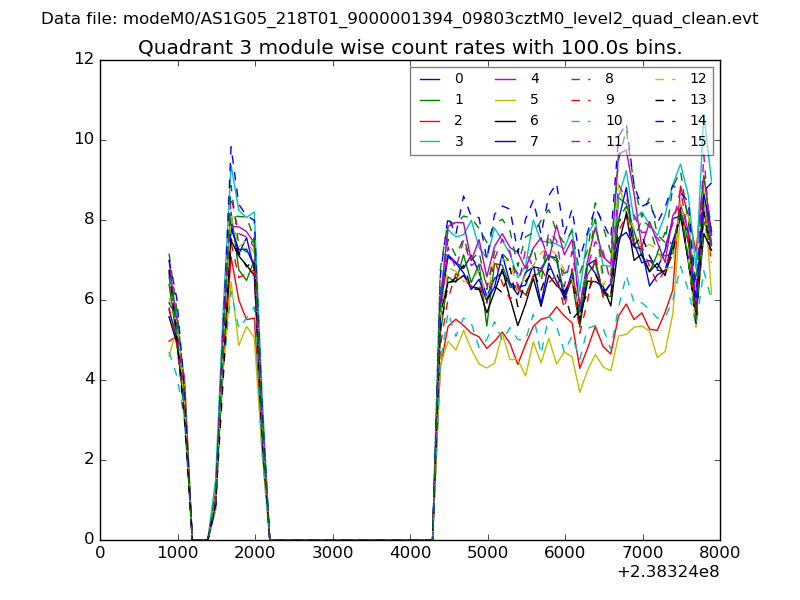
| Module-wise count rates for Quadrant A Data is divided into 100 sec bins |
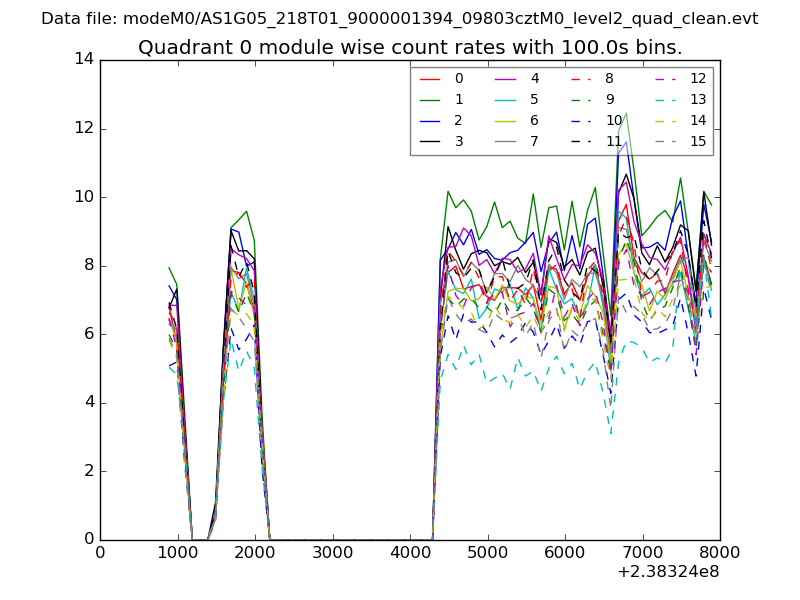 |
 |
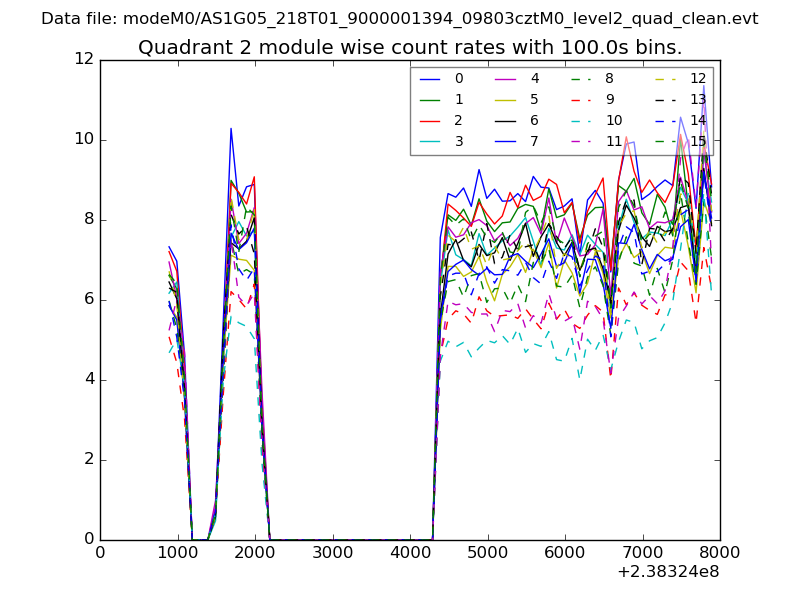
| Module-wise count rates for Quadrant B Data is divided into 100 sec bins |
 |
 |
| Module-wise count rates for Quadrant C Data is divided into 100 sec bins |
 |
 |
| Module-wise count rates for Quadrant D Data is divided into 100 sec bins |
 |
 |
| Parameter | Plot |
|---|---|
| CZT HV Monitor |  |
| D_VDD | 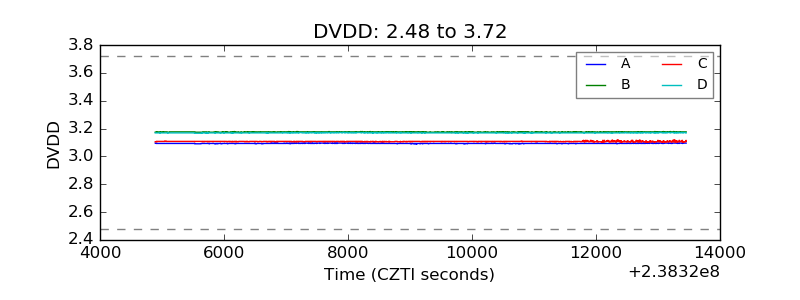 |
| Temperature 1 | 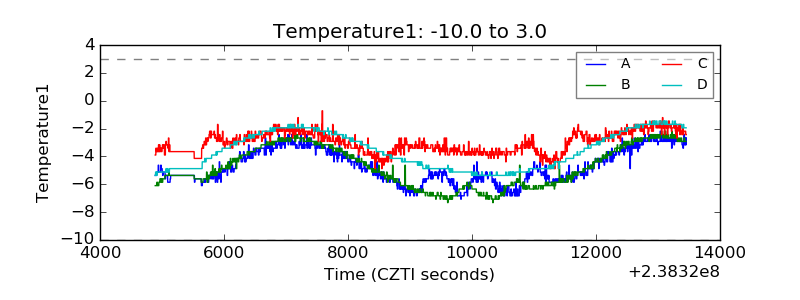 |
| Veto HV Monitor | 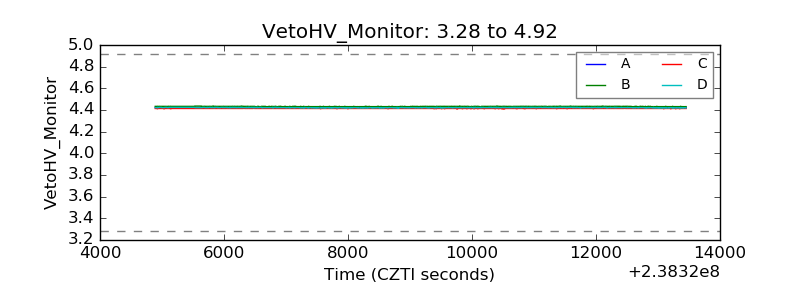 |
| Veto LLD | 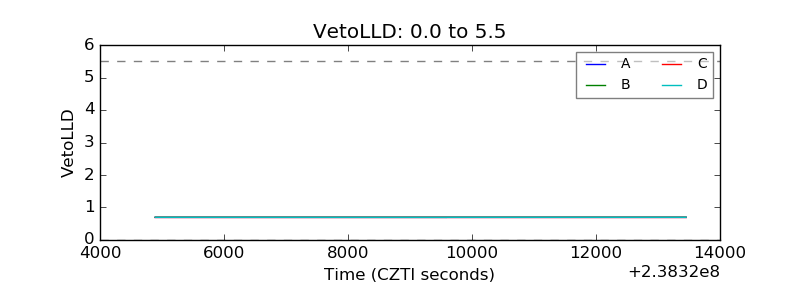 |
| Alpha Counter | 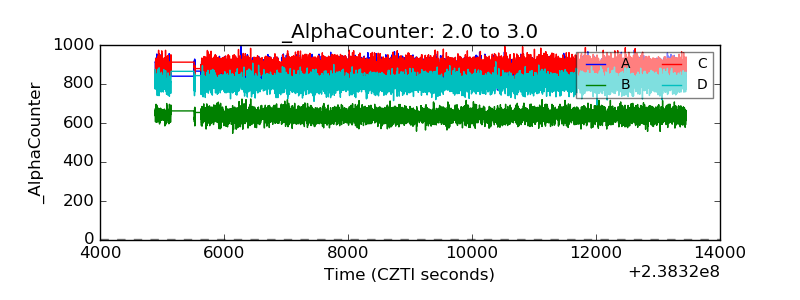 |
| _CPM_Rate | 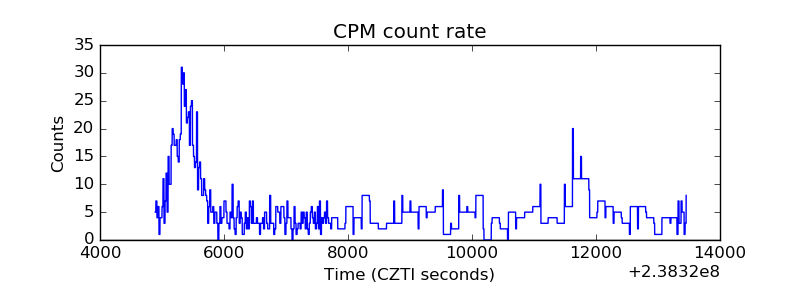 |
| CZT Counter | 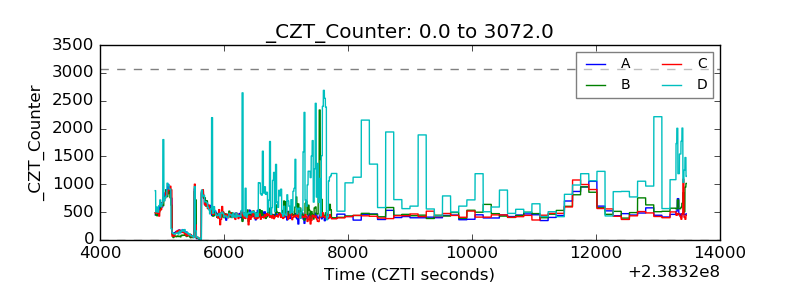 |
| +2.5 Volts monitor |  |
| +5 Volts monitor |  |
| _ROLL_ROT | 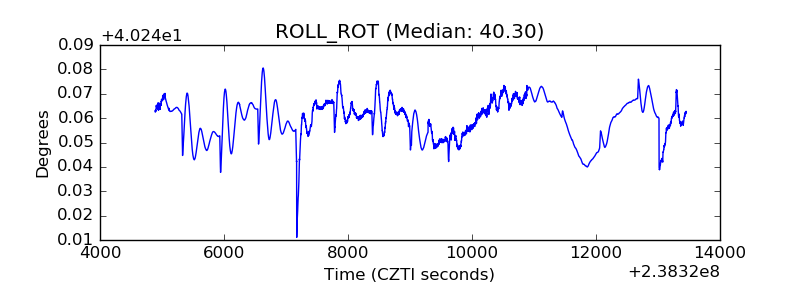 |
| _Roll_DEC | 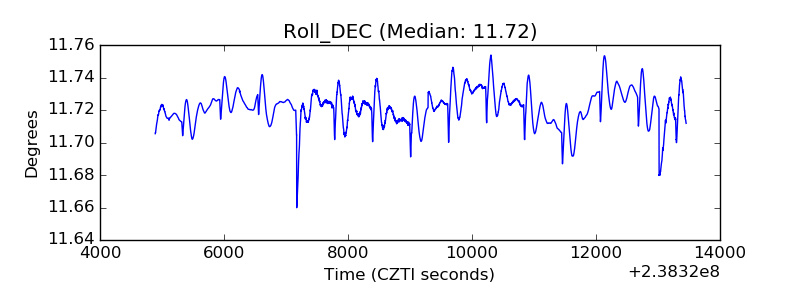 |
| _Roll_RA | 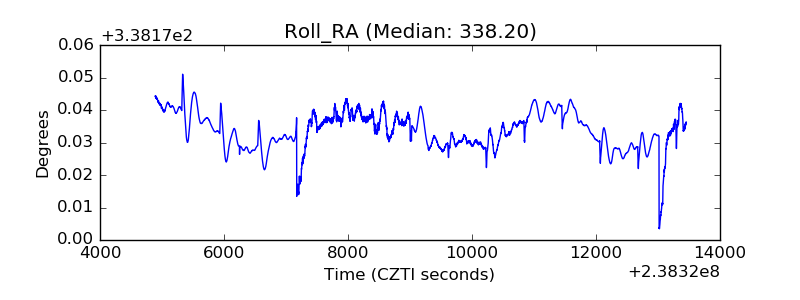 |
| Veto Counter | 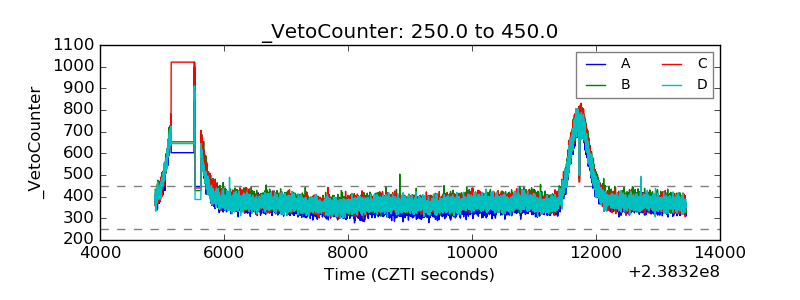 |