| Param | Original file | Final file |
|---|---|---|
| Filename | modeM0/AS1G05_218T01_9000001394_09808cztM0_level2.evt | modeM0/AS1G05_218T01_9000001394_09808cztM0_level2_quad_clean.evt |
| Size (bytes) | 648,567,360 | 112,288,320 |
| Size | 618.5 MB | 107.1 MB |
| Events in quadrant A | 4,319,538 | 698,761 |
| Events in quadrant B | 4,526,201 | 709,127 |
| Events in quadrant C | 4,240,458 | 691,384 |
| Events in quadrant D | 5,931,553 | 662,911 |
| Mode SS | |||
|---|---|---|---|
| Quadrant | BADHDUFLAG | Total packets | Discarded packets |
| A | 0 | 190 | 2 |
| B | 0 | 190 | 0 |
| C | 0 | 190 | 0 |
| D | 0 | 190 | 2 |
| Mode M0 | |||
|---|---|---|---|
| Quadrant | BADHDUFLAG | Total packets | Discarded packets |
| A | 0 | 19037 | 187 |
| B | 0 | 19635 | 163 |
| C | 0 | 19029 | 182 |
| D | 0 | 24197 | 319 |
| Mode M9 | |||
|---|---|---|---|
| Quadrant | BADHDUFLAG | Total packets | Discarded packets |
| A | 0 | 18 | 1 |
| B | 0 | 18 | 0 |
| C | 0 | 18 | 1 |
| D | 0 | 18 | 0 |
| Quadrant | Total seconds | Saturated seconds | Saturation percentage |
|---|---|---|---|
| A | 9201 | 30 | 0.326052% |
| B | 9211 | 79 | 0.857670% |
| C | 9202 | 38 | 0.412954% |
| D | 9182 | 472 | 5.140492% |
Noise dominated data is calculated using 1-second bins in cleaned event files. If a bin has >2000 counts, and if more than 50% of those come from <1% of pixels, then it is considered to be noise-dominated and hence unusable.
| Quadrant | # 1 sec bins | Bins with >0 counts | Bins with >2000 counts | High rate bins dominated by noise | Noise dominated (total time) | Noise dominated (detector-on time) | Marked lightcurve |
|---|---|---|---|---|---|---|---|
| A | 25726 | 9282 | 0 | 0 | 0.00% | 0.00% |  |
| B | 25726 | 9284 | 24 | 24 | 0.09% | 0.26% | 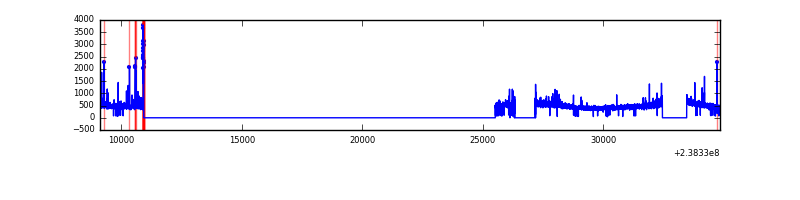 |
| C | 25726 | 9283 | 6 | 6 | 0.02% | 0.06% | 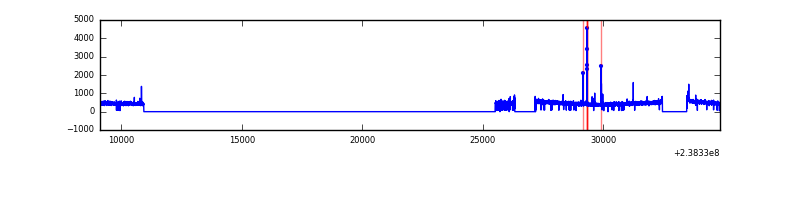 |
| D | 25726 | 9280 | 345 | 345 | 1.34% | 3.72% | 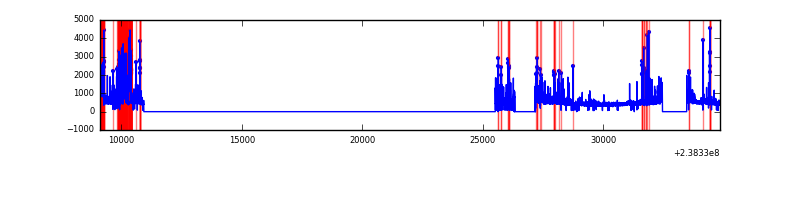 |
Top three noisy pixels from each quadrant. If the there are fewer than three noisy pixels in the level2.evt file, extra rows are filled as -1
| Pixel properties | Quadrant properties | ||||||
|---|---|---|---|---|---|---|---|
| Quadrant | DetID | PixID | Counts | Sigma | Mean | Median | Sigma |
| A | 1 | 162 | 43925 | 193.98 | 1098 | 1076 | 220.9 |
| A | 1 | 178 | 14386 | 60.26 | 1098 | 1076 | 220.9 |
| A | 15 | 174 | 12105 | 49.93 | 1098 | 1076 | 220.9 |
| B | 4 | 142 | 60810 | 282.99 | 1105 | 1078 | 211.1 |
| B | 0 | 214 | 51535 | 239.04 | 1105 | 1078 | 211.1 |
| B | 4 | 48 | 35911 | 165.02 | 1105 | 1078 | 211.1 |
| C | 14 | 234 | 38243 | 149.54 | 1070 | 1077 | 248.5 |
| C | 10 | 22 | 12940 | 47.73 | 1070 | 1077 | 248.5 |
| C | 14 | 67 | 10061 | 36.15 | 1070 | 1077 | 248.5 |
| D | 1 | 52 | 1351531 | 5086.77 | 1044 | 1018 | 265.5 |
| D | 2 | 152 | 316510 | 1188.32 | 1044 | 1018 | 265.5 |
| D | 2 | 16 | 93962 | 350.08 | 1044 | 1018 | 265.5 |
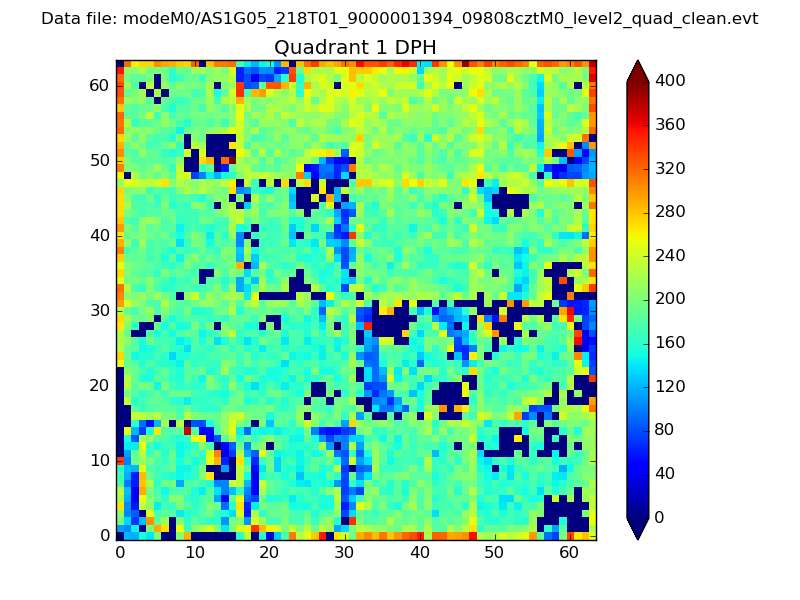
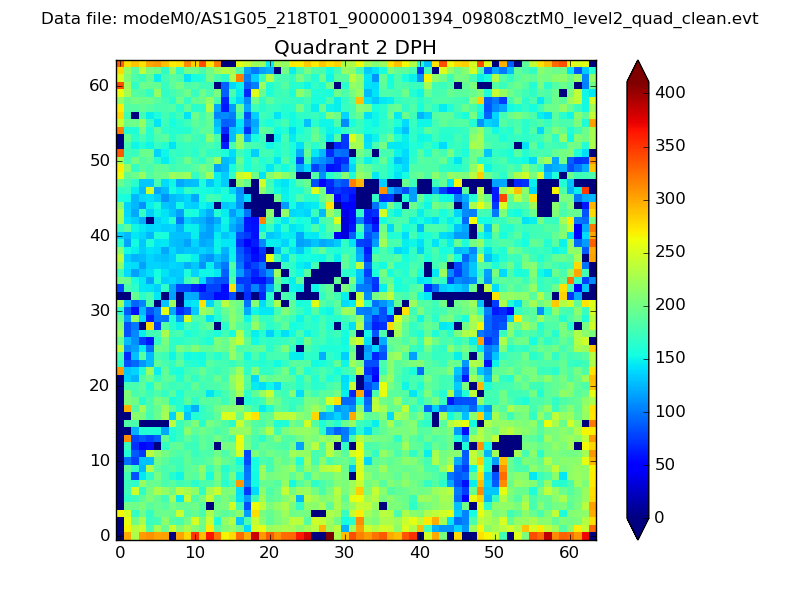
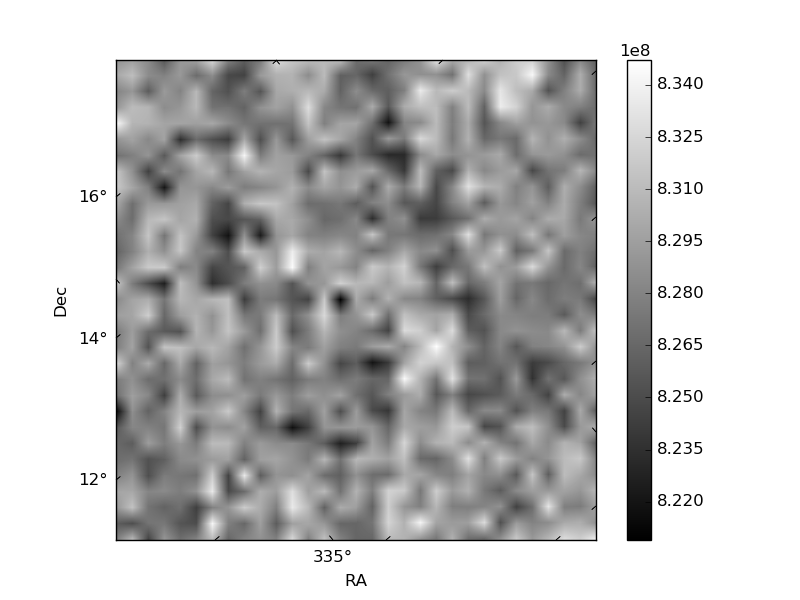
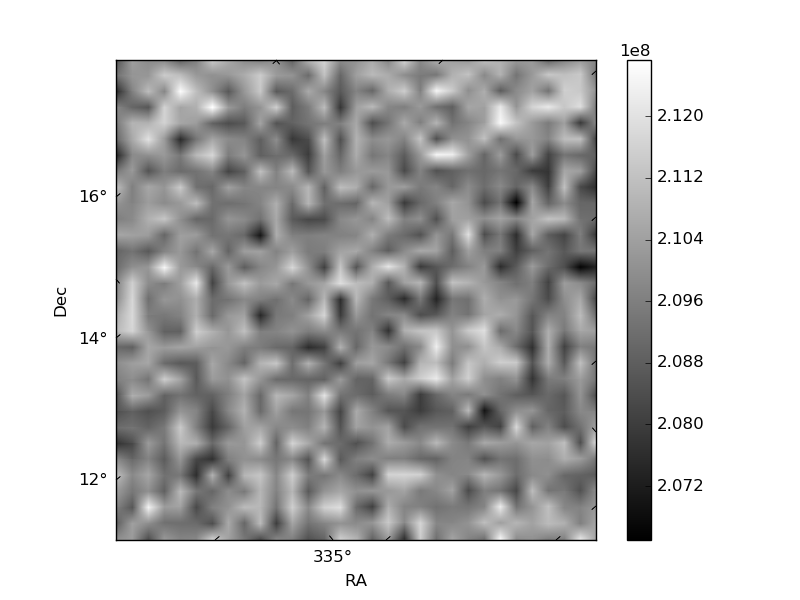
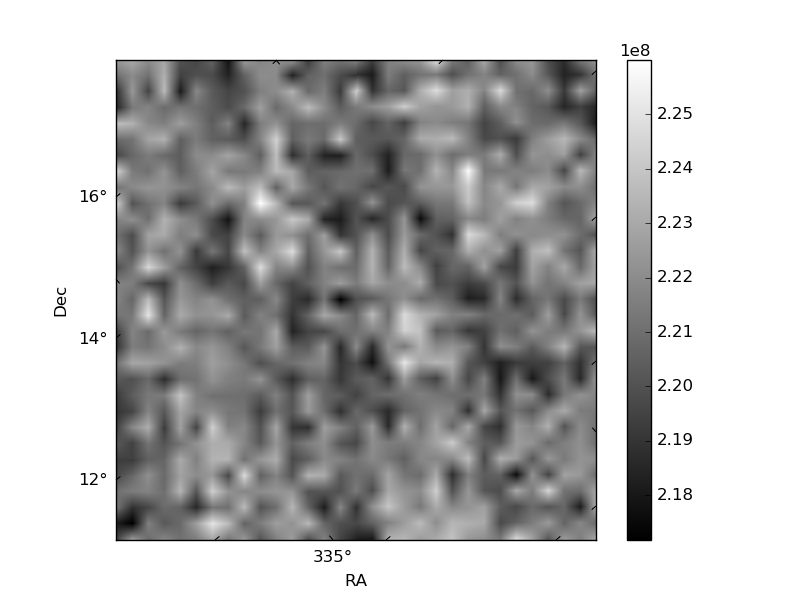
Histogram calculated using DETX and DETY for each event in the final _common_clean file
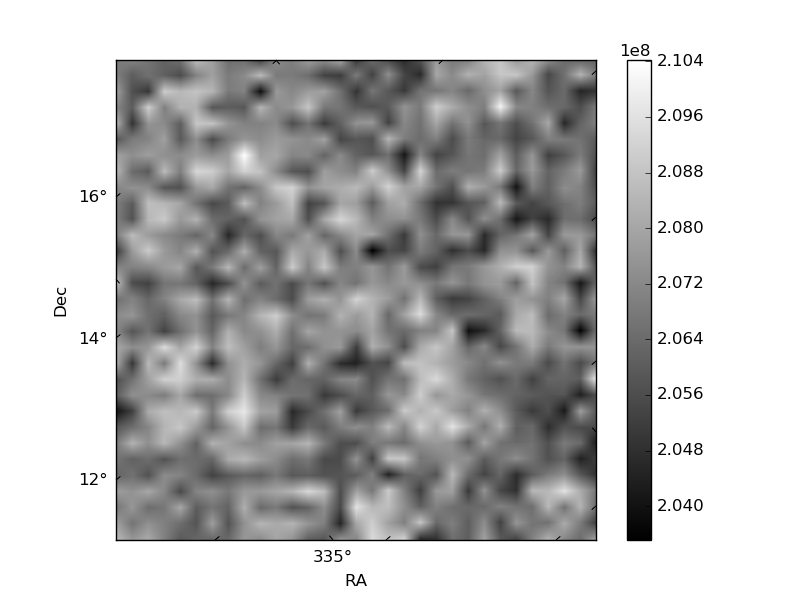
| Quadrant A | 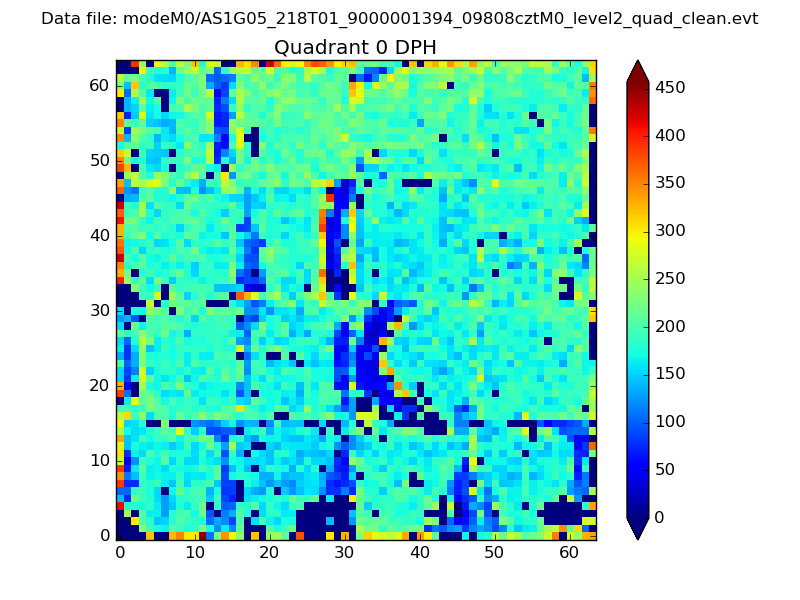 |
 |
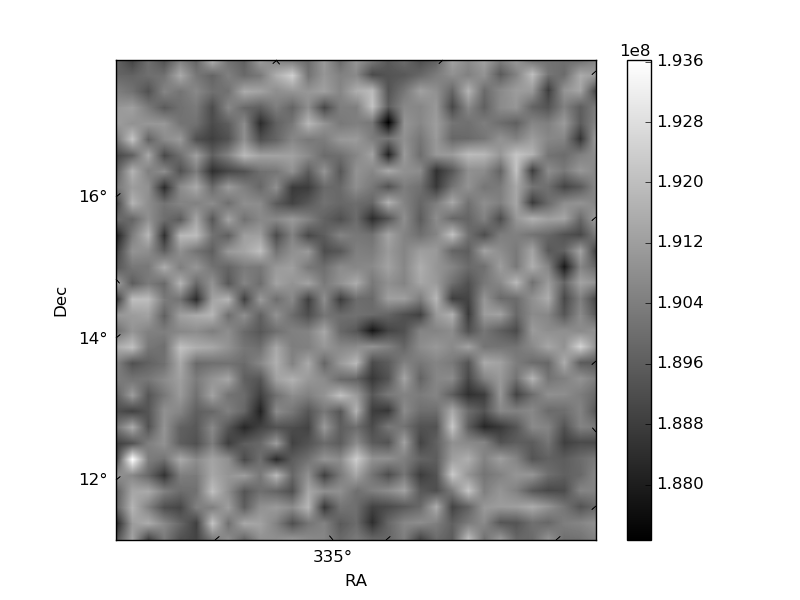
Quadrant B |
|---|---|---|---|
| Quadrant D | 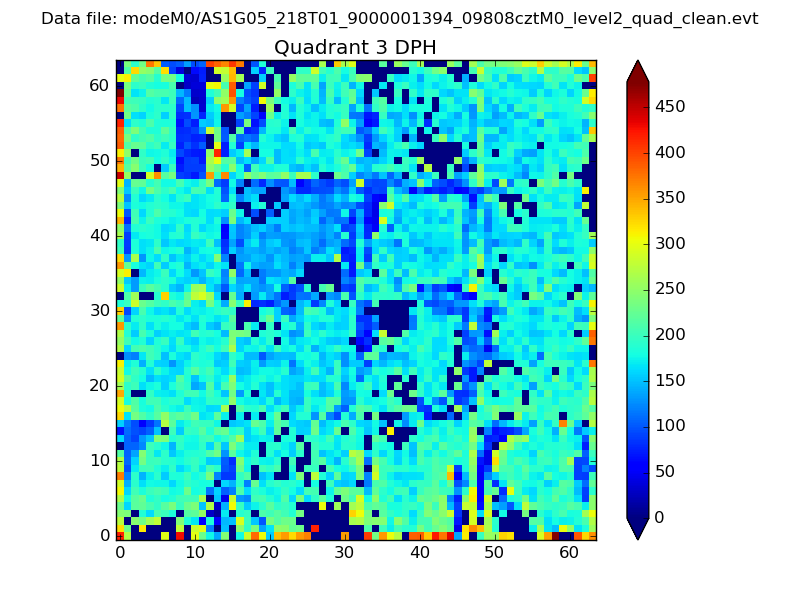 |
 |
Quadrant C |
| Plot type | Count rate plots | Images |
|---|---|---|
| Comparison with Poisson distribution Blue bars denote a histogram of data divided into 1 sec bins. Red curve is a Poisson curve with rate = median count rate of data. |
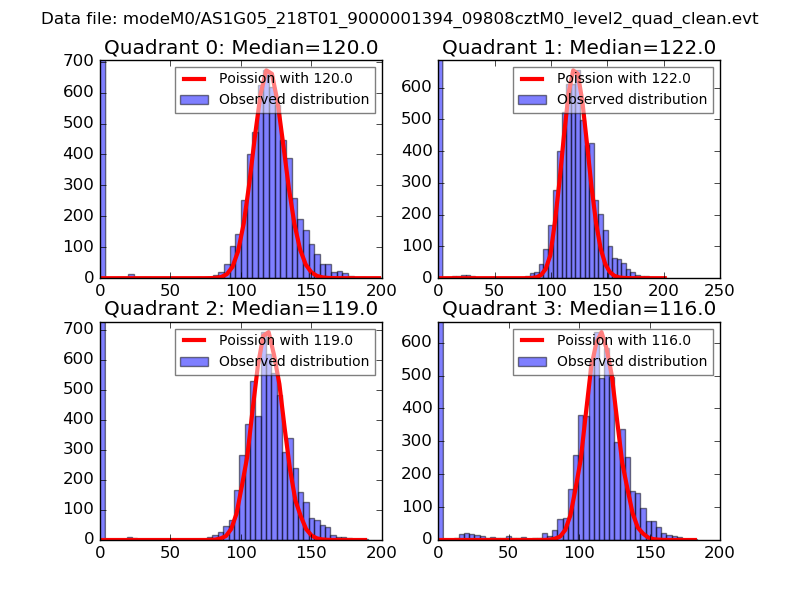 |
 |
| Quadrant-wise count rates Data is divided into 100 sec bins |
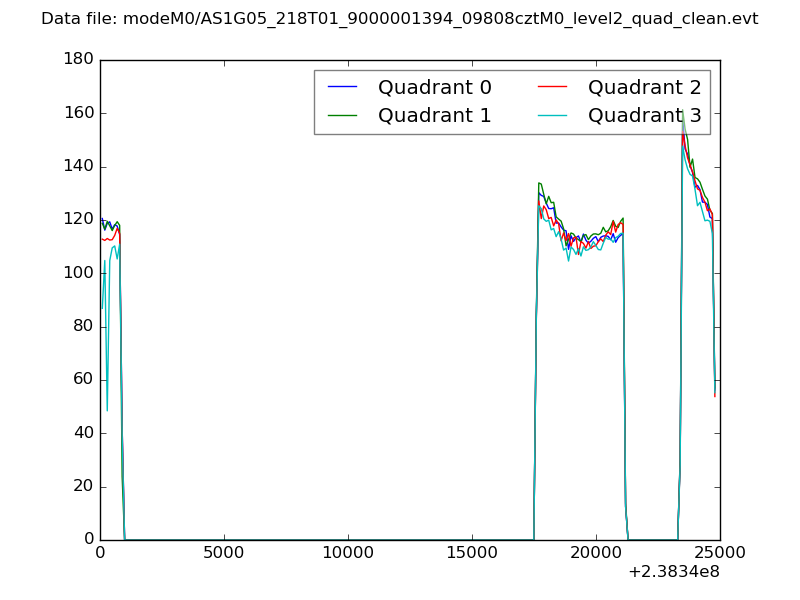 |
|
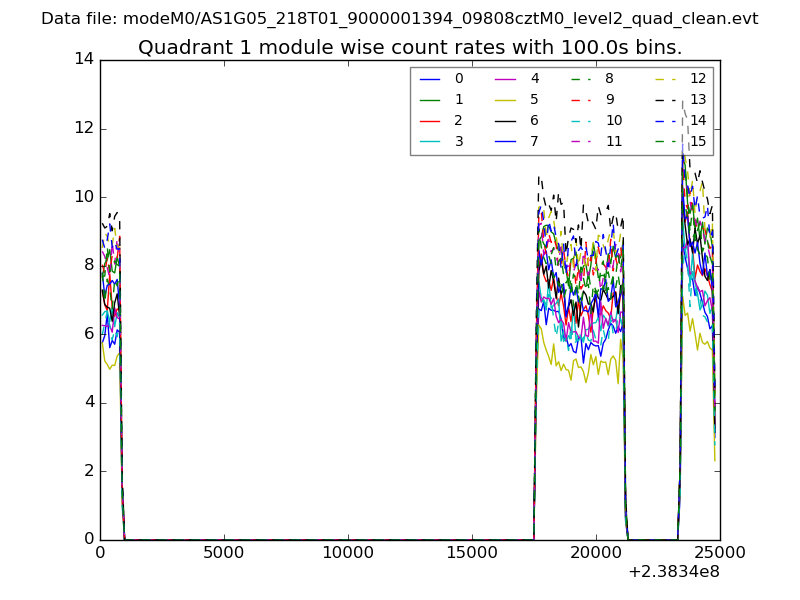
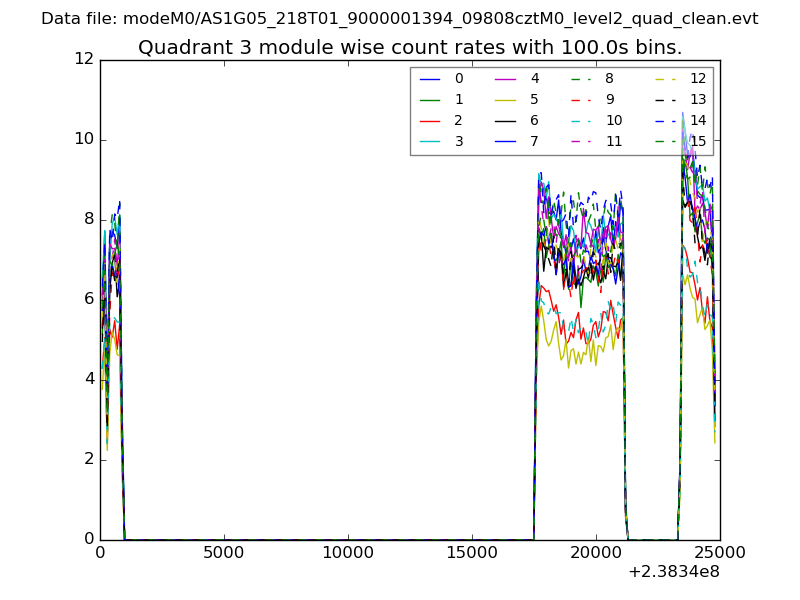
| Module-wise count rates for Quadrant A Data is divided into 100 sec bins |
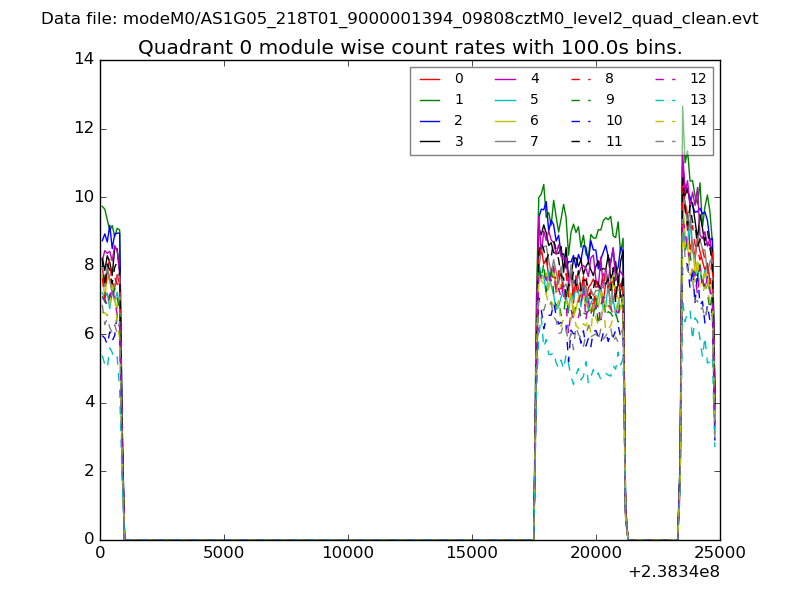 |
 |
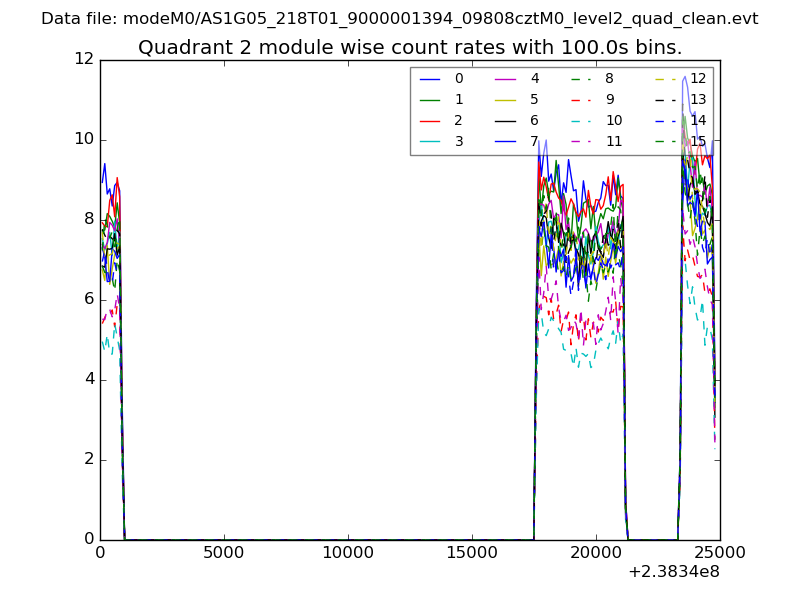
| Module-wise count rates for Quadrant B Data is divided into 100 sec bins |
 |
 |
| Module-wise count rates for Quadrant C Data is divided into 100 sec bins |
 |
 |
| Module-wise count rates for Quadrant D Data is divided into 100 sec bins |
 |
 |
| Parameter | Plot |
|---|---|
| CZT HV Monitor | 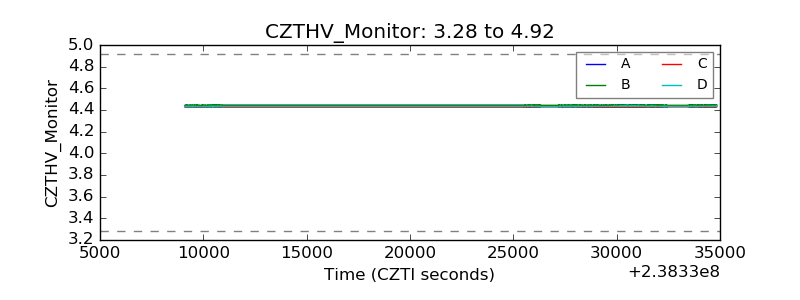 |
| D_VDD | 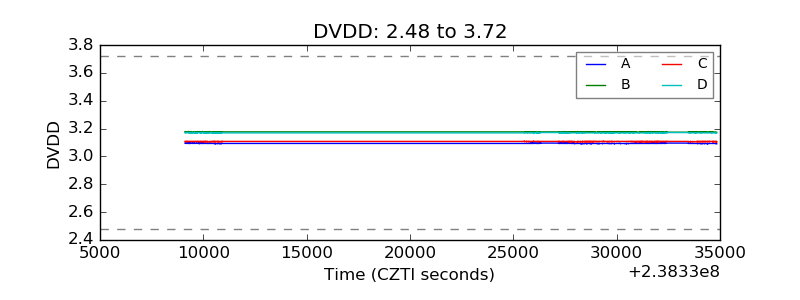 |
| Temperature 1 | 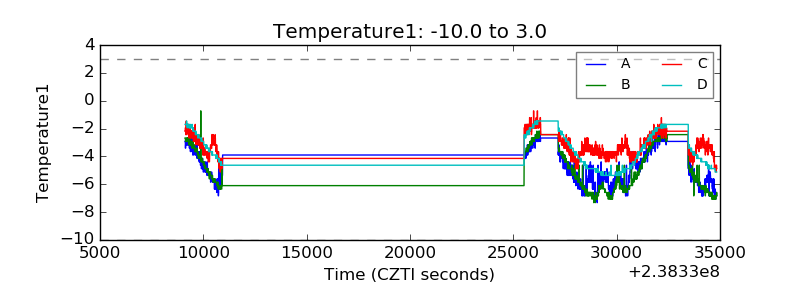 |
| Veto HV Monitor |  |
| Veto LLD | 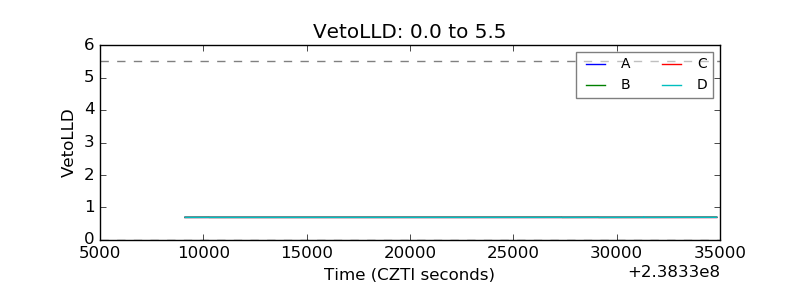 |
| Alpha Counter | 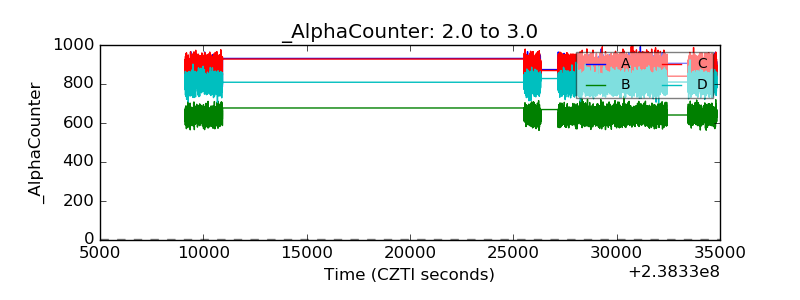 |
| _CPM_Rate | 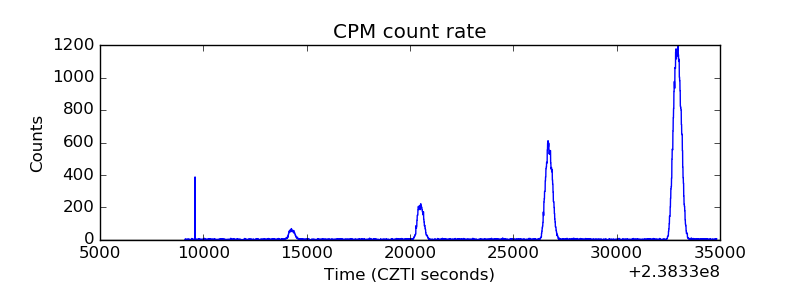 |
| CZT Counter | 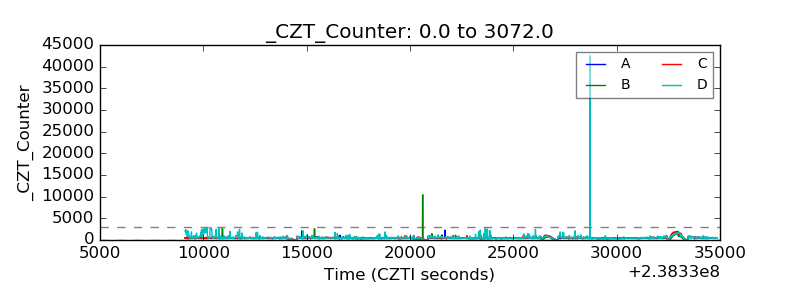 |
| +2.5 Volts monitor |  |
| +5 Volts monitor |  |
| _ROLL_ROT | 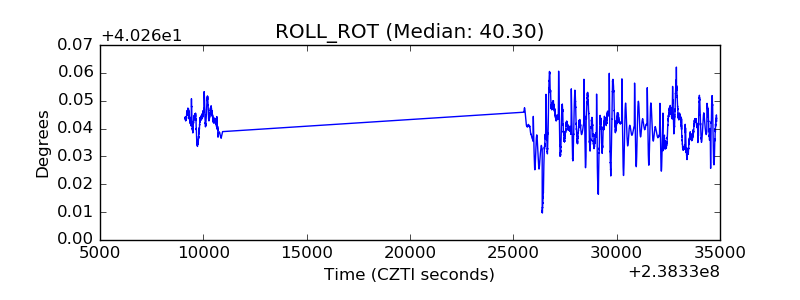 |
| _Roll_DEC | 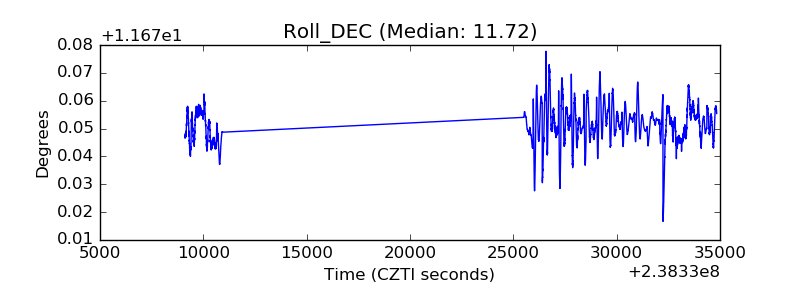 |
| _Roll_RA | 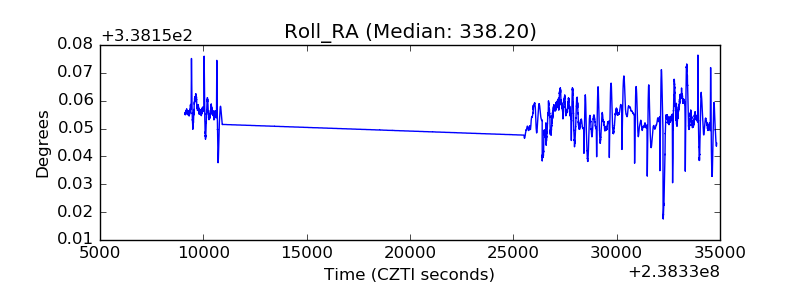 |
| Veto Counter | 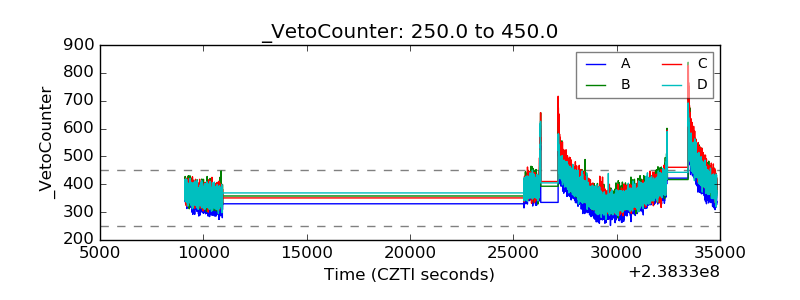 |