| Param | Original file | Final file |
|---|---|---|
| Filename | modeM0/AS1G05_218T01_9000001394_09810cztM0_level2.evt | modeM0/AS1G05_218T01_9000001394_09810cztM0_level2_quad_clean.evt |
| Size (bytes) | 413,095,680 | 91,915,200 |
| Size | 394.0 MB | 87.7 MB |
| Events in quadrant A | 2,882,381 | 592,222 |
| Events in quadrant B | 2,997,464 | 604,420 |
| Events in quadrant C | 3,010,068 | 591,204 |
| Events in quadrant D | 3,202,806 | 567,276 |
| Mode SS | |||
|---|---|---|---|
| Quadrant | BADHDUFLAG | Total packets | Discarded packets |
| A | 0 | 128 | 2 |
| B | 0 | 128 | 4 |
| C | 0 | 128 | 0 |
| D | 0 | 128 | 0 |
| Mode M0 | |||
|---|---|---|---|
| Quadrant | BADHDUFLAG | Total packets | Discarded packets |
| A | 0 | 13090 | 392 |
| B | 0 | 13435 | 395 |
| C | 0 | 13652 | 479 |
| D | 0 | 14278 | 507 |
| Mode M9 | |||
|---|---|---|---|
| Quadrant | BADHDUFLAG | Total packets | Discarded packets |
| A | 0 | 12 | 0 |
| B | 0 | 12 | 0 |
| C | 0 | 12 | 0 |
| D | 0 | 13 | 0 |
| Quadrant | Total seconds | Saturated seconds | Saturation percentage |
|---|---|---|---|
| A | 6134 | 27 | 0.440170% |
| B | 6143 | 52 | 0.846492% |
| C | 6120 | 49 | 0.800654% |
| D | 6117 | 71 | 1.160700% |
Noise dominated data is calculated using 1-second bins in cleaned event files. If a bin has >2000 counts, and if more than 50% of those come from <1% of pixels, then it is considered to be noise-dominated and hence unusable.
| Quadrant | # 1 sec bins | Bins with >0 counts | Bins with >2000 counts | High rate bins dominated by noise | Noise dominated (total time) | Noise dominated (detector-on time) | Marked lightcurve |
|---|---|---|---|---|---|---|---|
| A | 7434 | 6306 | 0 | 0 | 0.00% | 0.00% | 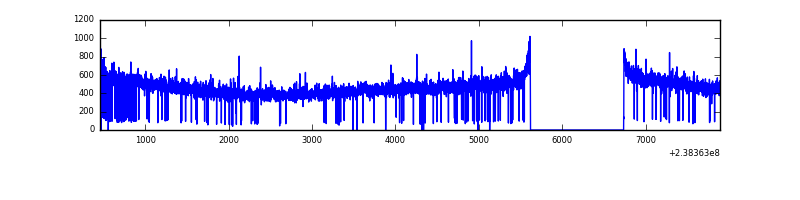 |
| B | 7434 | 6308 | 8 | 8 | 0.11% | 0.13% | 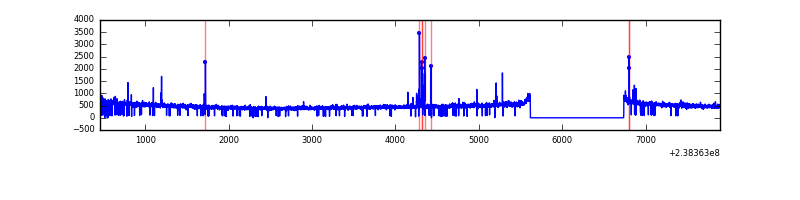 |
| C | 7434 | 6302 | 8 | 8 | 0.11% | 0.13% | 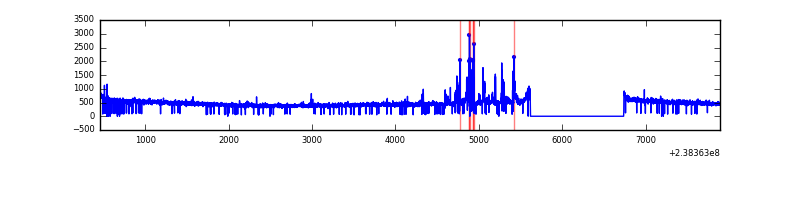 |
| D | 7434 | 6301 | 26 | 26 | 0.35% | 0.41% | 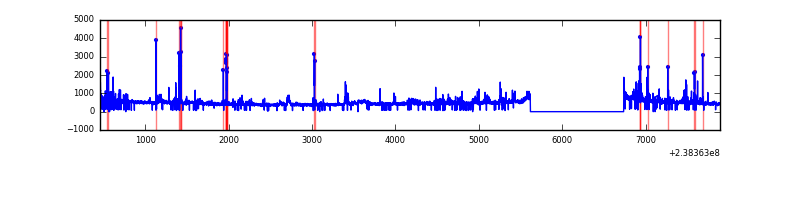 |
Top three noisy pixels from each quadrant. If the there are fewer than three noisy pixels in the level2.evt file, extra rows are filled as -1
| Pixel properties | Quadrant properties | ||||||
|---|---|---|---|---|---|---|---|
| Quadrant | DetID | PixID | Counts | Sigma | Mean | Median | Sigma |
| A | 1 | 162 | 22436 | 144.91 | 738 | 722 | 149.8 |
| A | 13 | 251 | 9271 | 57.05 | 738 | 722 | 149.8 |
| A | 0 | 226 | 6596 | 39.2 | 738 | 722 | 149.8 |
| B | 0 | 85 | 40553 | 277.03 | 746 | 728 | 143.8 |
| B | 0 | 214 | 26324 | 178.05 | 746 | 728 | 143.8 |
| B | 12 | 111 | 16110 | 107.0 | 746 | 728 | 143.8 |
| C | 10 | 22 | 168369 | 985.08 | 727 | 731 | 170.2 |
| C | 5 | 128 | 6336 | 32.94 | 727 | 731 | 170.2 |
| C | 13 | 61 | 5422 | 27.57 | 727 | 731 | 170.2 |
| D | 1 | 52 | 171360 | 921.88 | 713 | 698 | 185.1 |
| D | 2 | 152 | 148747 | 799.73 | 713 | 698 | 185.1 |
| D | 12 | 233 | 47316 | 251.82 | 713 | 698 | 185.1 |
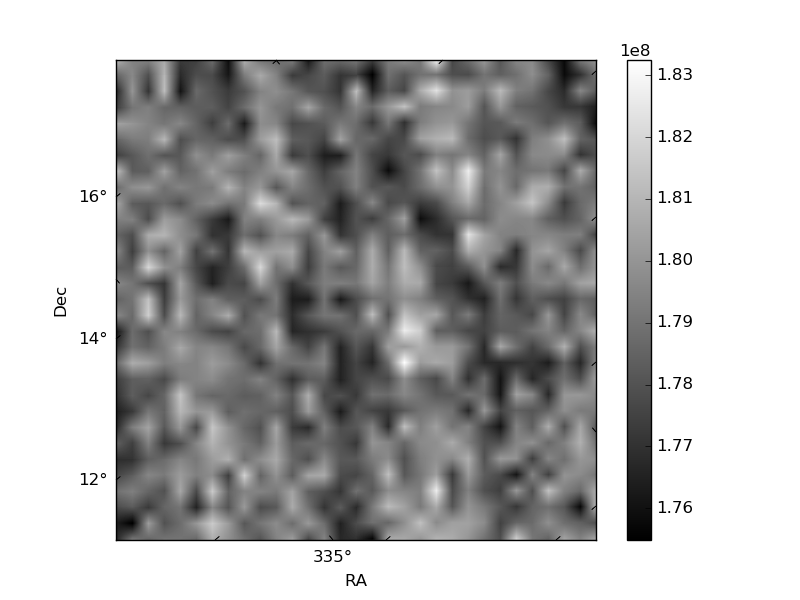
Histogram calculated using DETX and DETY for each event in the final _common_clean file
| Quadrant A | 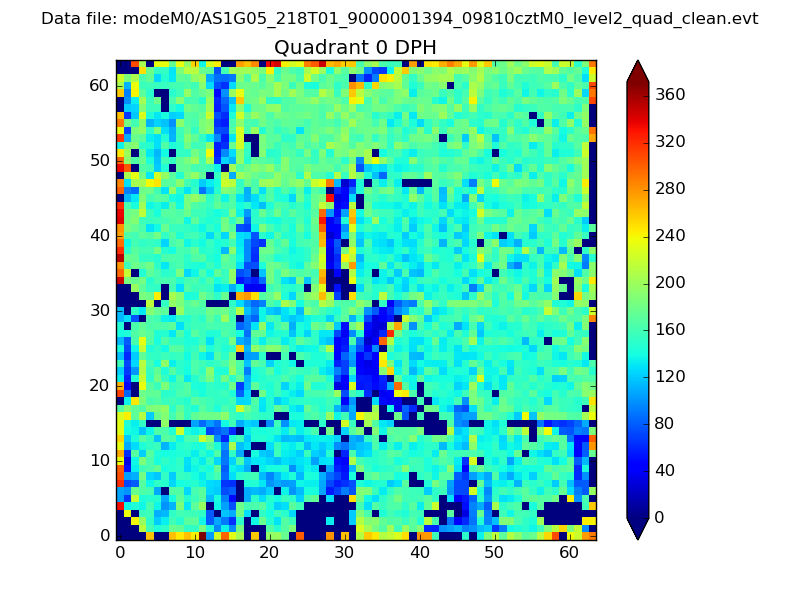 |
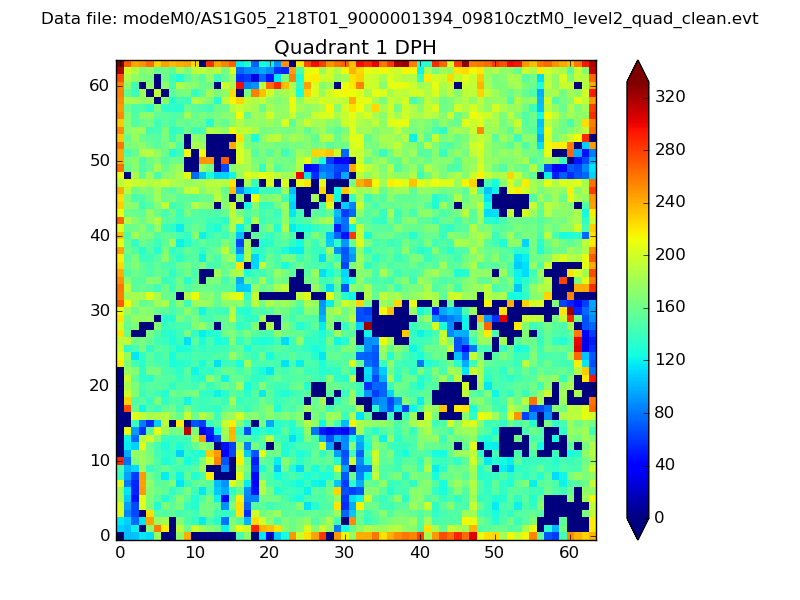 |
Quadrant B |
|---|---|---|---|
| Quadrant D | 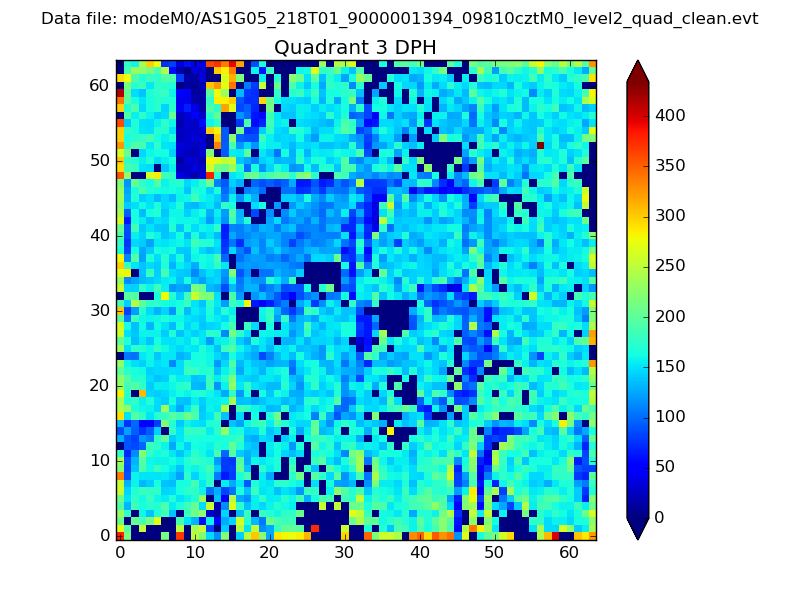 |
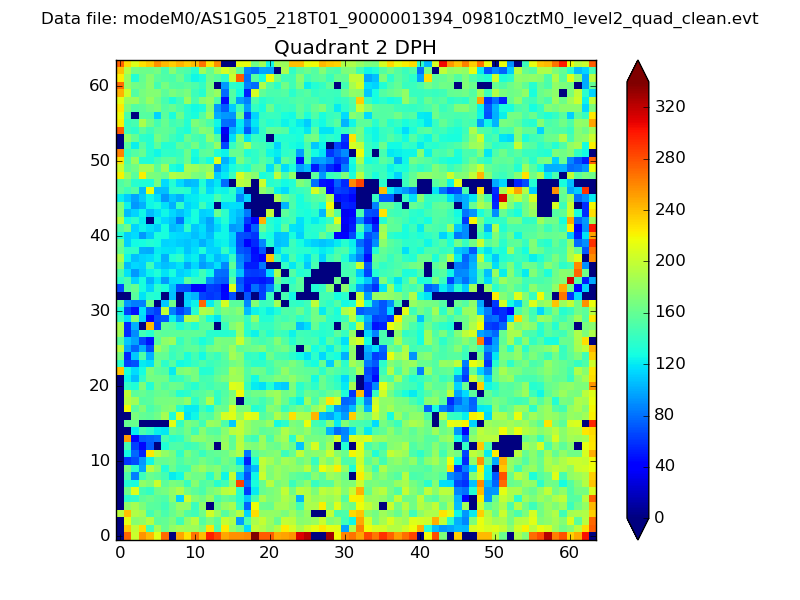 |
Quadrant C |
| Plot type | Count rate plots | Images |
|---|---|---|
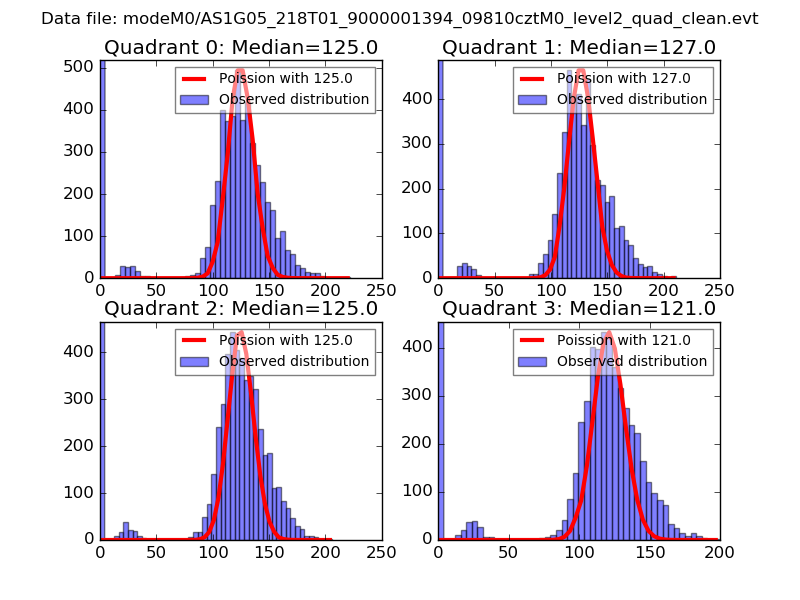
| Comparison with Poisson distribution Blue bars denote a histogram of data divided into 1 sec bins. Red curve is a Poisson curve with rate = median count rate of data. |
 |
 |
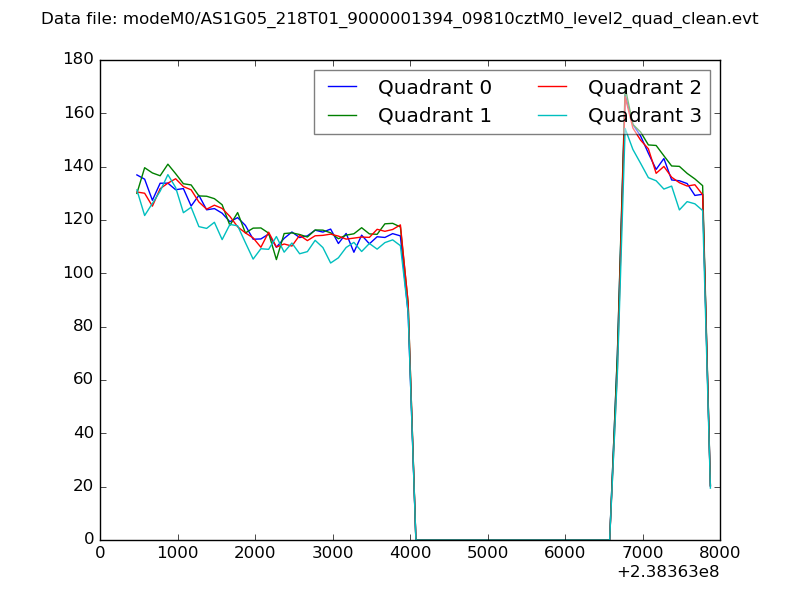
| Quadrant-wise count rates Data is divided into 100 sec bins |
 |
|
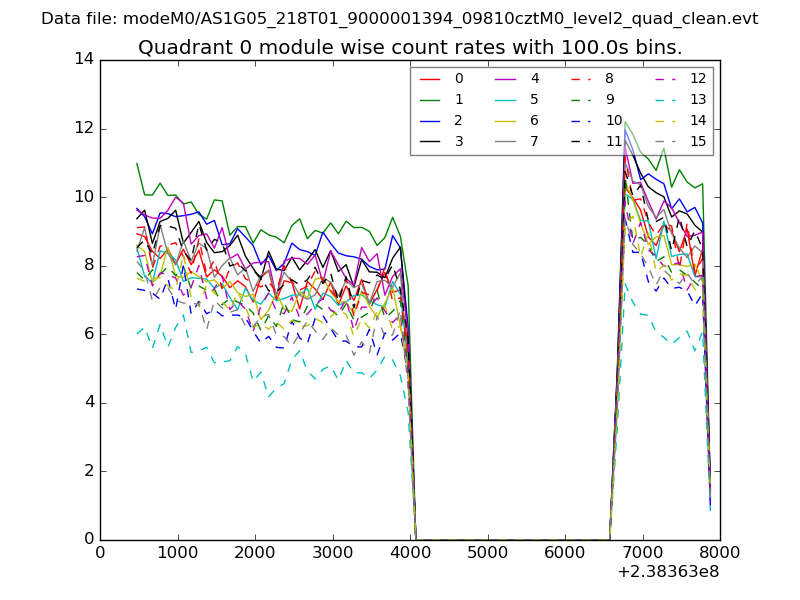
| Module-wise count rates for Quadrant A Data is divided into 100 sec bins |
 |
 |
| Module-wise count rates for Quadrant B Data is divided into 100 sec bins |
 |
 |
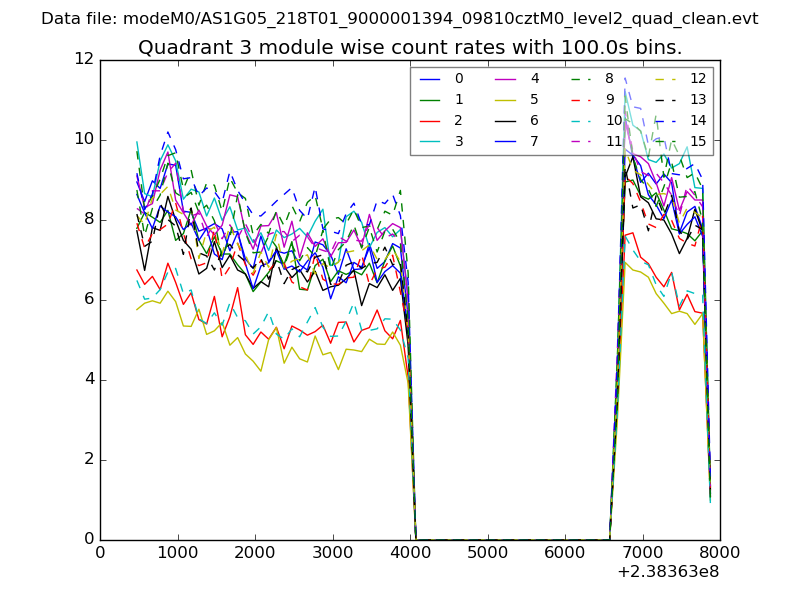
| Module-wise count rates for Quadrant C Data is divided into 100 sec bins |
 |
 |
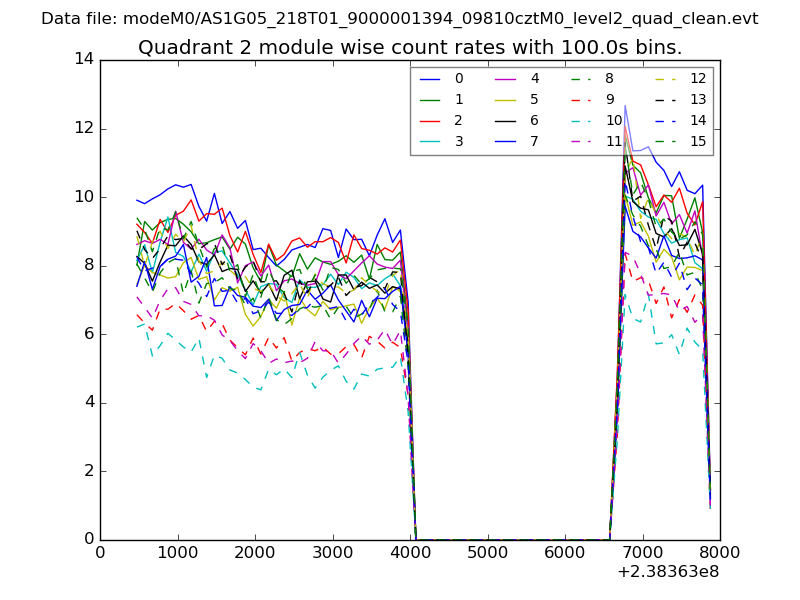
| Module-wise count rates for Quadrant D Data is divided into 100 sec bins |
 |
 |
| Parameter | Plot |
|---|---|
| CZT HV Monitor | 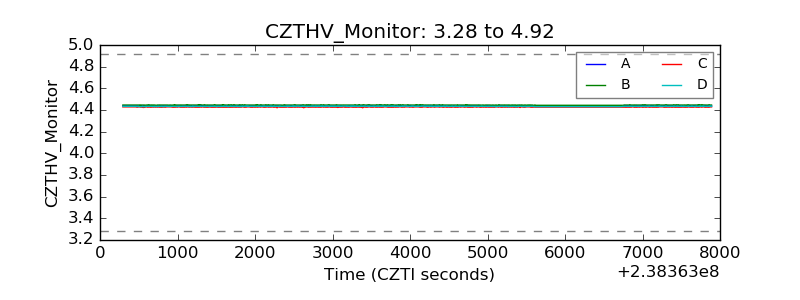 |
| D_VDD | 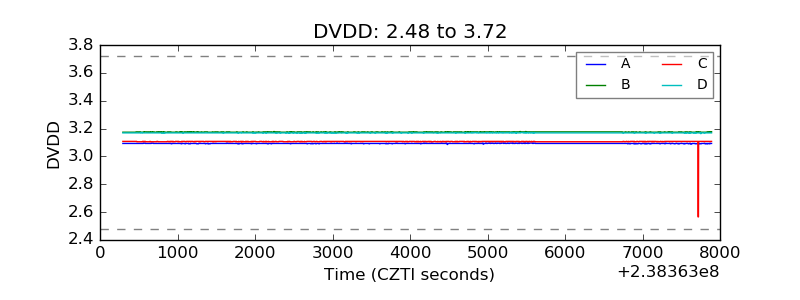 |
| Temperature 1 | 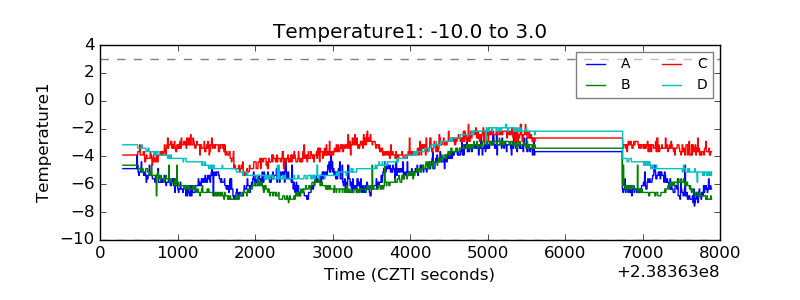 |
| Veto HV Monitor | 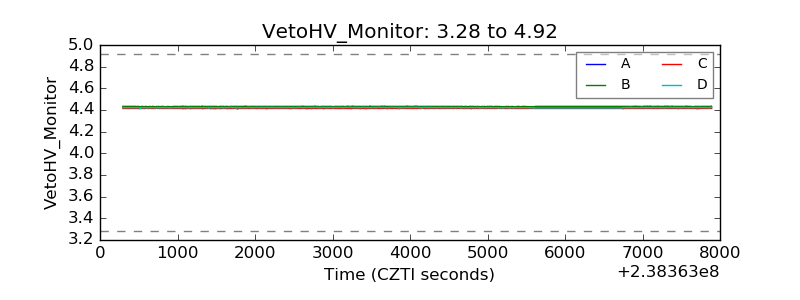 |
| Veto LLD | 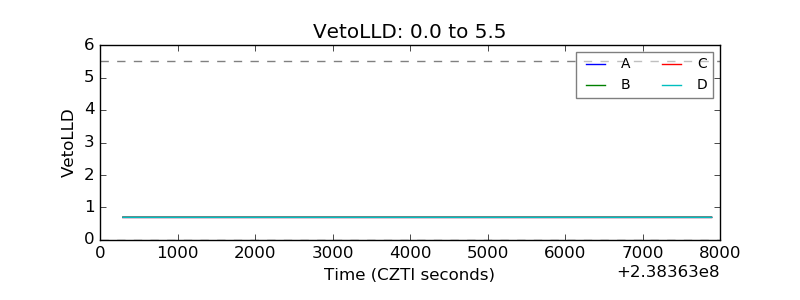 |
| Alpha Counter | 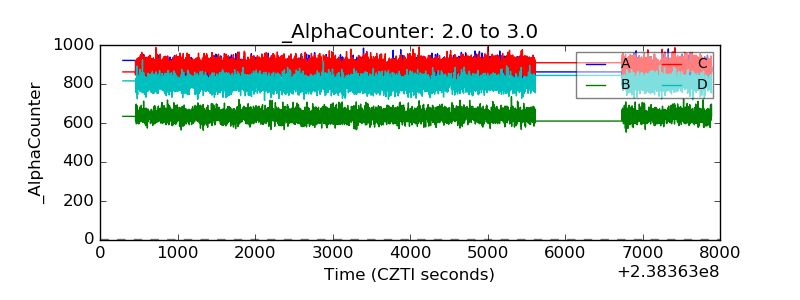 |
| _CPM_Rate | 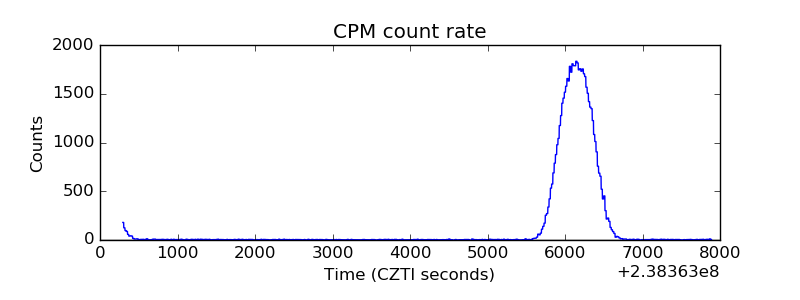 |
| CZT Counter | 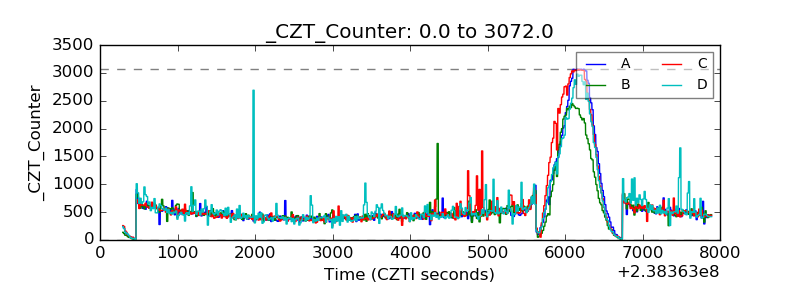 |
| +2.5 Volts monitor | 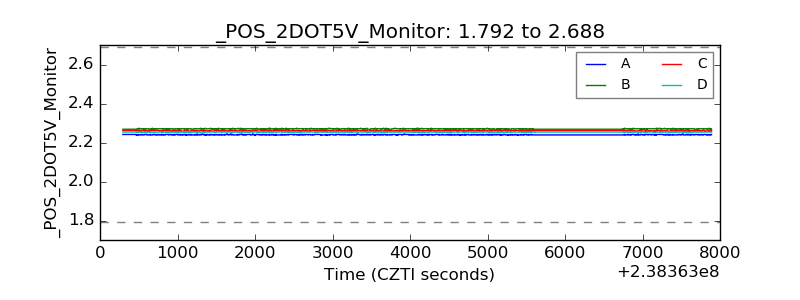 |
| +5 Volts monitor |  |
| _ROLL_ROT | 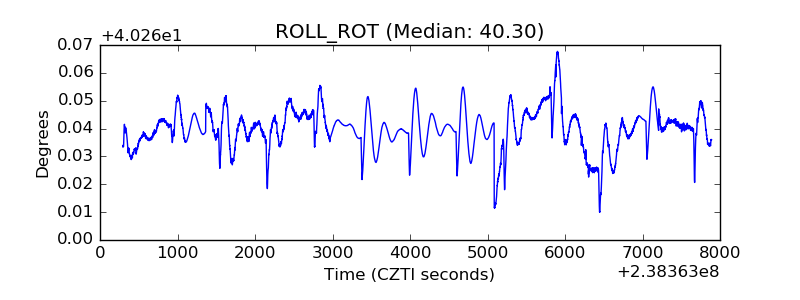 |
| _Roll_DEC | 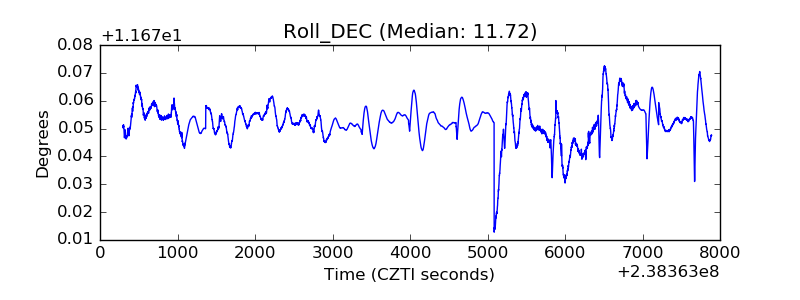 |
| _Roll_RA | 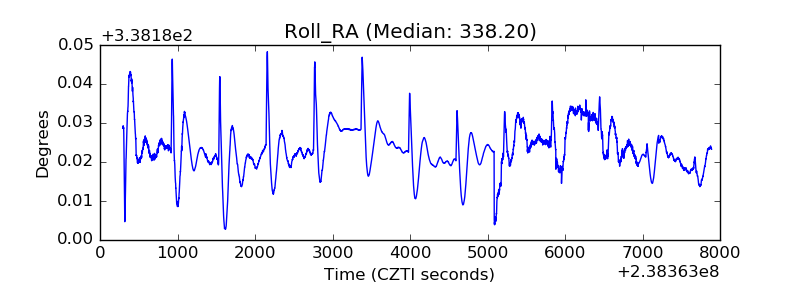 |
| Veto Counter | 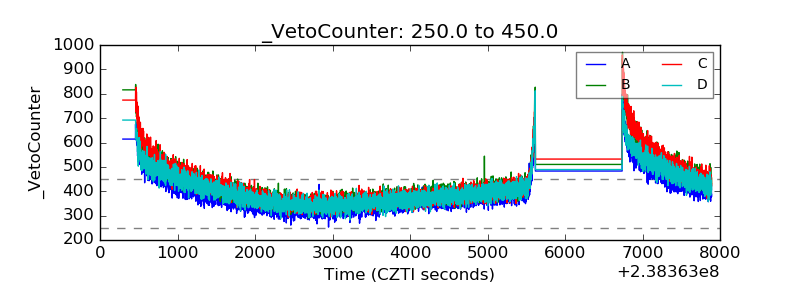 |