| Param | Original file | Final file |
|---|---|---|
| Filename | modeM0/AS1G05_218T01_9000001394_09811cztM0_level2.evt | modeM0/AS1G05_218T01_9000001394_09811cztM0_level2_quad_clean.evt |
| Size (bytes) | 370,010,880 | 79,292,160 |
| Size | 352.9 MB | 75.6 MB |
| Events in quadrant A | 2,645,563 | 502,344 |
| Events in quadrant B | 2,701,180 | 518,393 |
| Events in quadrant C | 2,623,643 | 511,857 |
| Events in quadrant D | 2,855,028 | 478,080 |
| Mode SS | |||
|---|---|---|---|
| Quadrant | BADHDUFLAG | Total packets | Discarded packets |
| A | 0 | 128 | 8 |
| B | 0 | 128 | 12 |
| C | 0 | 128 | 14 |
| D | 0 | 128 | 14 |
| Mode M0 | |||
|---|---|---|---|
| Quadrant | BADHDUFLAG | Total packets | Discarded packets |
| A | 0 | 12937 | 1471 |
| B | 0 | 13152 | 1531 |
| C | 0 | 12944 | 1364 |
| D | 0 | 14104 | 1773 |
| Mode M9 | |||
|---|---|---|---|
| Quadrant | BADHDUFLAG | Total packets | Discarded packets |
| A | 0 | 19 | 4 |
| B | 0 | 19 | 1 |
| C | 0 | 19 | 3 |
| D | 0 | 18 | 3 |
| Quadrant | Total seconds | Saturated seconds | Saturation percentage |
|---|---|---|---|
| A | 5562 | 25 | 0.449479% |
| B | 5549 | 45 | 0.810957% |
| C | 5616 | 23 | 0.409544% |
| D | 5520 | 53 | 0.960145% |
Noise dominated data is calculated using 1-second bins in cleaned event files. If a bin has >2000 counts, and if more than 50% of those come from <1% of pixels, then it is considered to be noise-dominated and hence unusable.
| Quadrant | # 1 sec bins | Bins with >0 counts | Bins with >2000 counts | High rate bins dominated by noise | Noise dominated (total time) | Noise dominated (detector-on time) | Marked lightcurve |
|---|---|---|---|---|---|---|---|
| A | 7457 | 5964 | 0 | 0 | 0.00% | 0.00% | 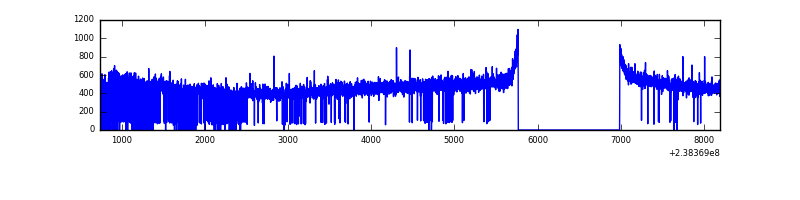 |
| B | 7455 | 5968 | 0 | 0 | 0.00% | 0.00% | 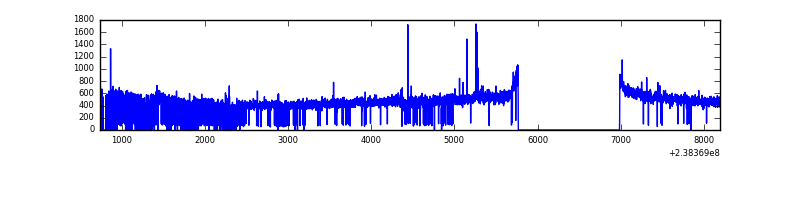 |
| C | 7457 | 6004 | 0 | 0 | 0.00% | 0.00% | 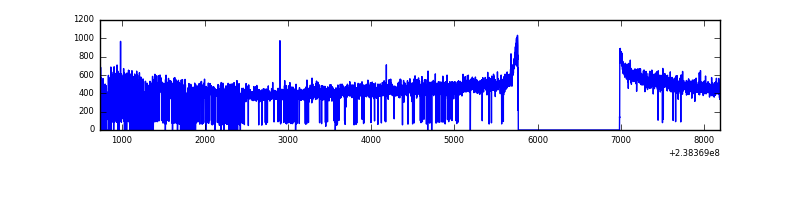 |
| D | 7376 | 5924 | 17 | 17 | 0.23% | 0.29% | 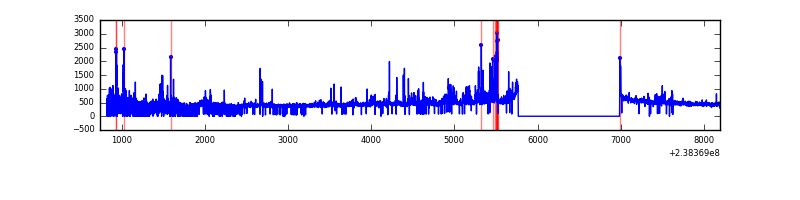 |
Top three noisy pixels from each quadrant. If the there are fewer than three noisy pixels in the level2.evt file, extra rows are filled as -1
| Pixel properties | Quadrant properties | ||||||
|---|---|---|---|---|---|---|---|
| Quadrant | DetID | PixID | Counts | Sigma | Mean | Median | Sigma |
| A | 1 | 162 | 22257 | 156.92 | 679 | 665 | 137.6 |
| A | 0 | 226 | 6103 | 39.52 | 679 | 665 | 137.6 |
| A | 12 | 194 | 5427 | 34.61 | 679 | 665 | 137.6 |
| B | 12 | 111 | 14521 | 106.26 | 683 | 667 | 130.4 |
| B | 11 | 111 | 12064 | 87.41 | 683 | 667 | 130.4 |
| B | 4 | 239 | 10429 | 74.87 | 683 | 667 | 130.4 |
| C | 13 | 61 | 5058 | 27.85 | 672 | 675 | 157.4 |
| C | 10 | 22 | 2998 | 14.76 | 672 | 675 | 157.4 |
| C | 3 | 202 | 1715 | 6.61 | 672 | 675 | 157.4 |
| D | 2 | 152 | 192586 | 1130.63 | 648 | 634 | 169.8 |
| D | 1 | 52 | 88529 | 517.72 | 648 | 634 | 169.8 |
| D | 12 | 233 | 50402 | 293.14 | 648 | 634 | 169.8 |
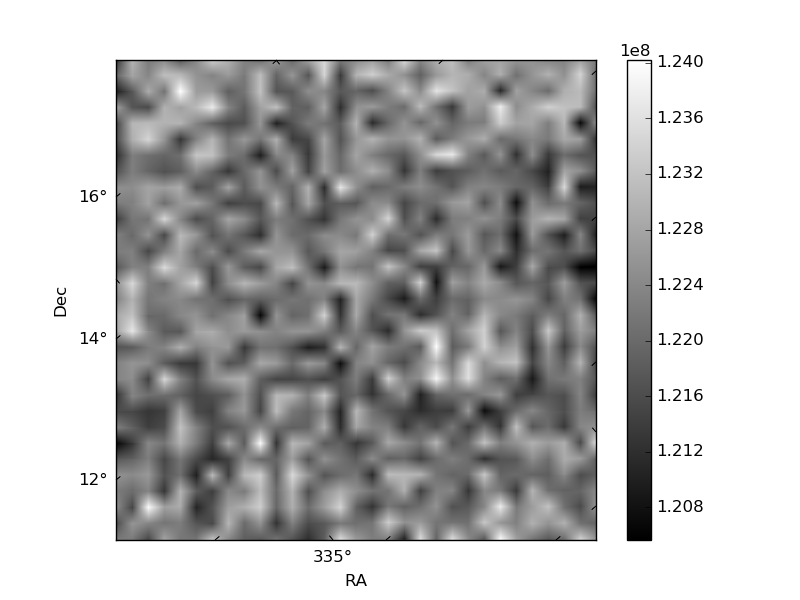
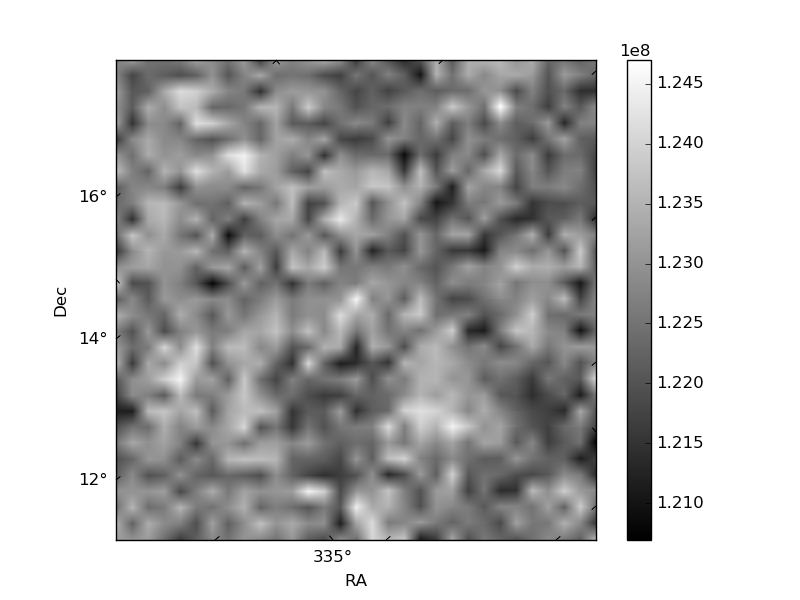
Histogram calculated using DETX and DETY for each event in the final _common_clean file
| Quadrant A | 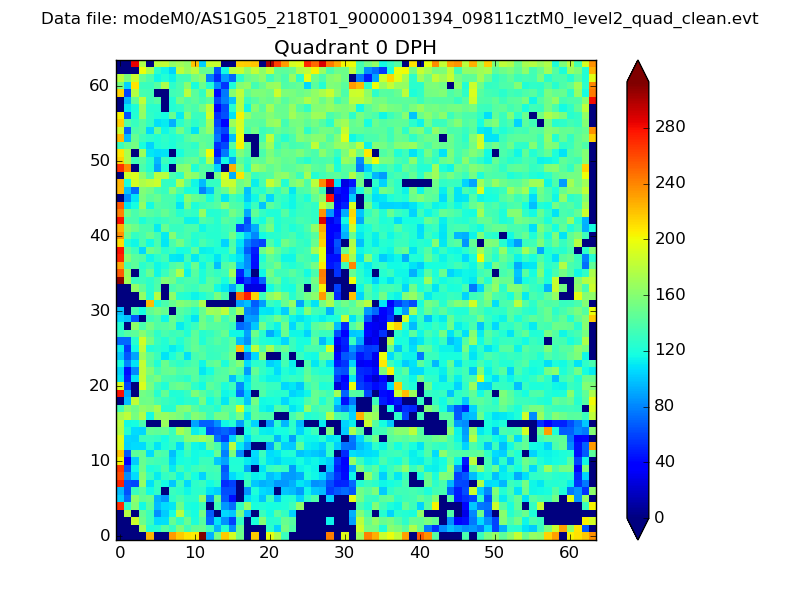 |
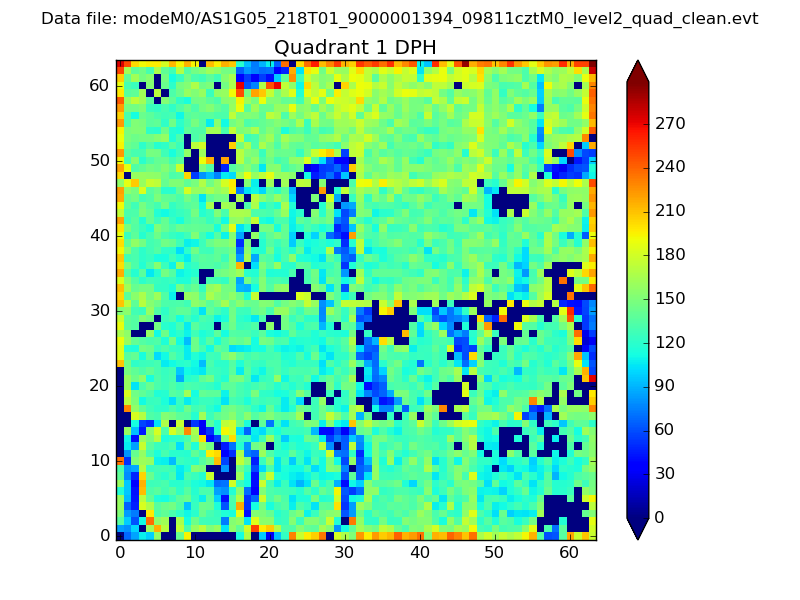 |
Quadrant B |
|---|---|---|---|
| Quadrant D | 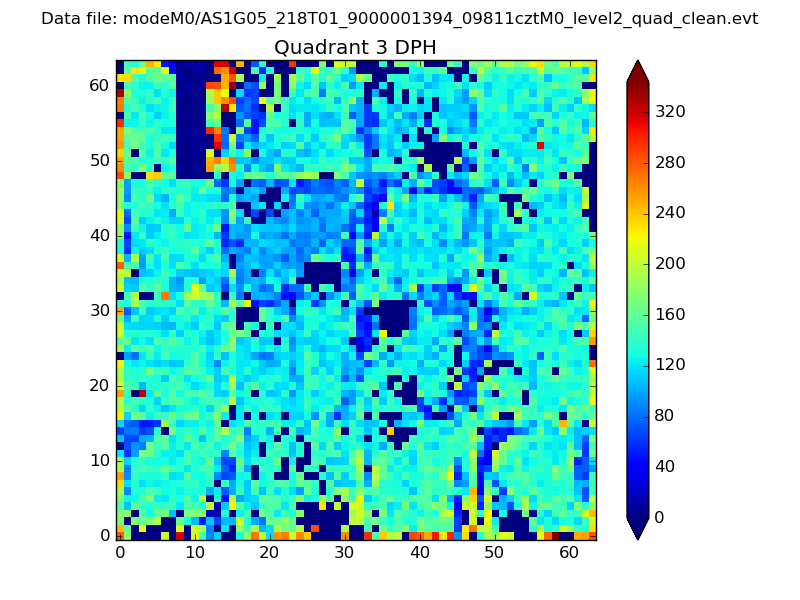 |
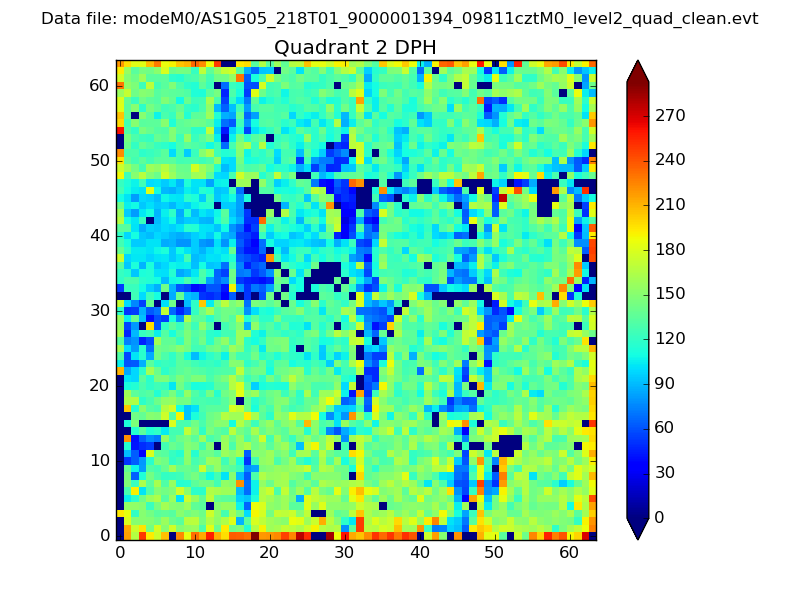 |
Quadrant C |
| Plot type | Count rate plots | Images |
|---|---|---|
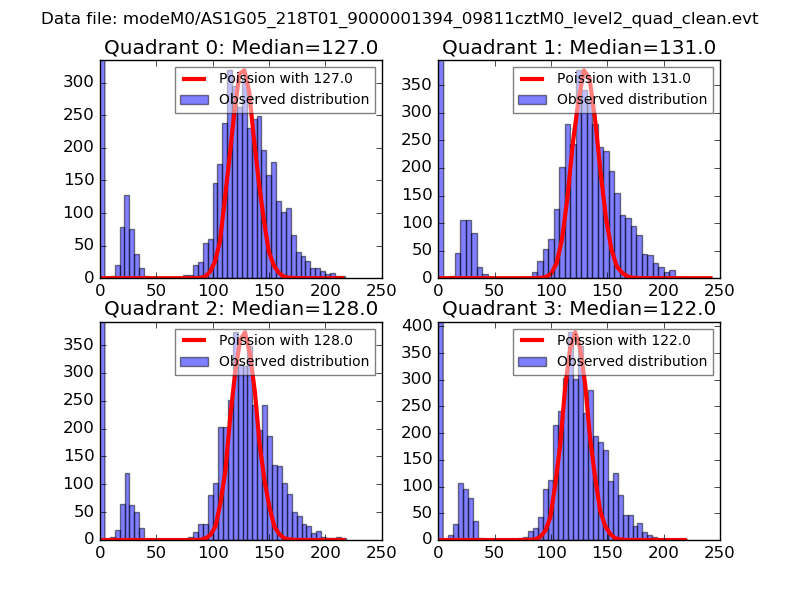
| Comparison with Poisson distribution Blue bars denote a histogram of data divided into 1 sec bins. Red curve is a Poisson curve with rate = median count rate of data. |
 |
 |
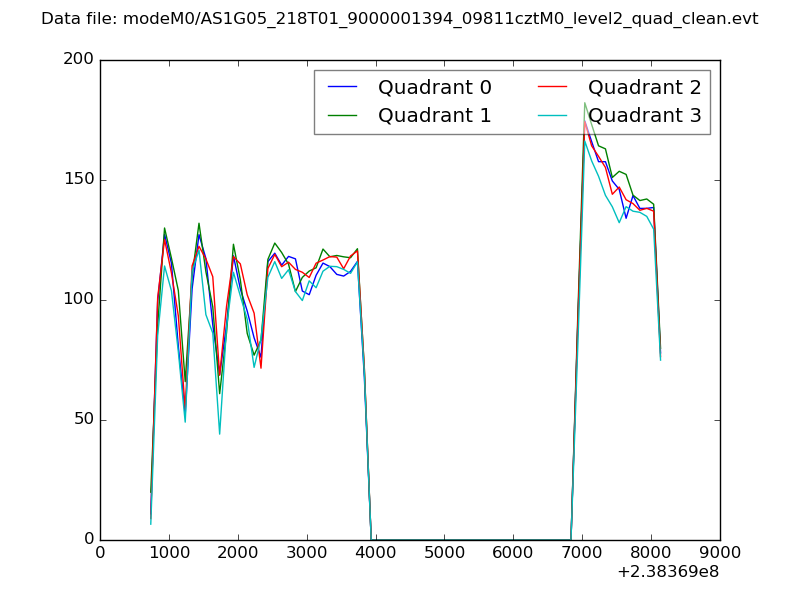
| Quadrant-wise count rates Data is divided into 100 sec bins |
 |
|
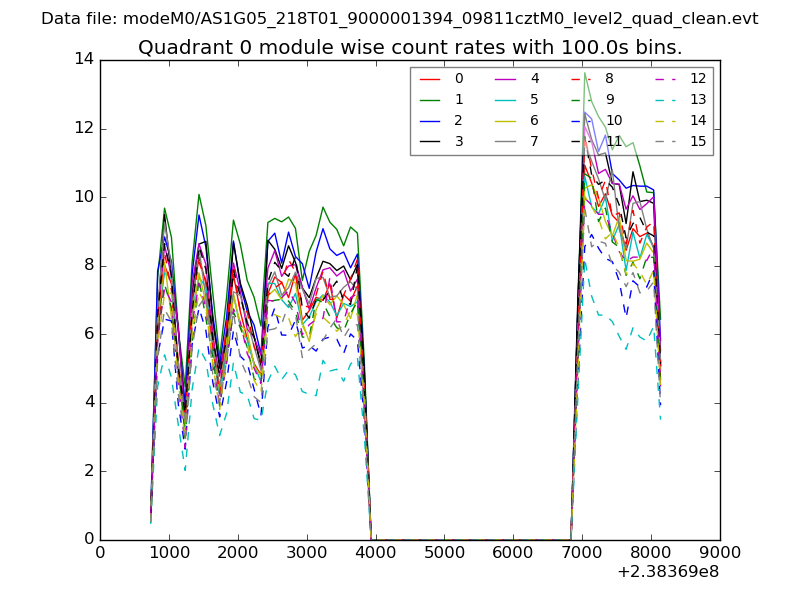
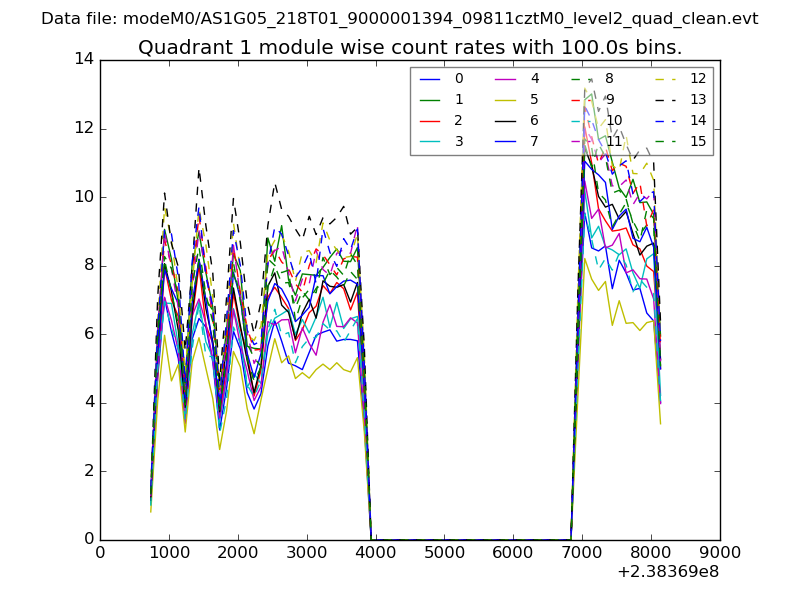
| Module-wise count rates for Quadrant A Data is divided into 100 sec bins |
 |
 |
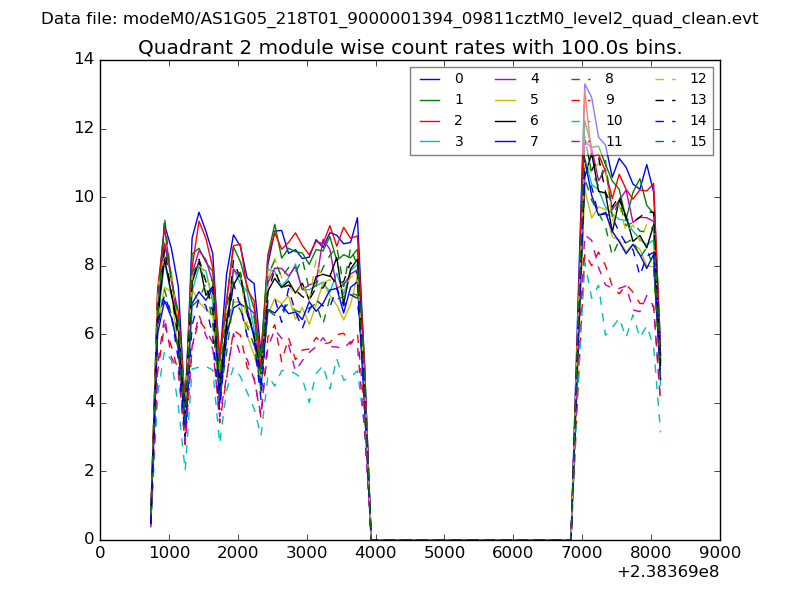
| Module-wise count rates for Quadrant B Data is divided into 100 sec bins |
 |
 |
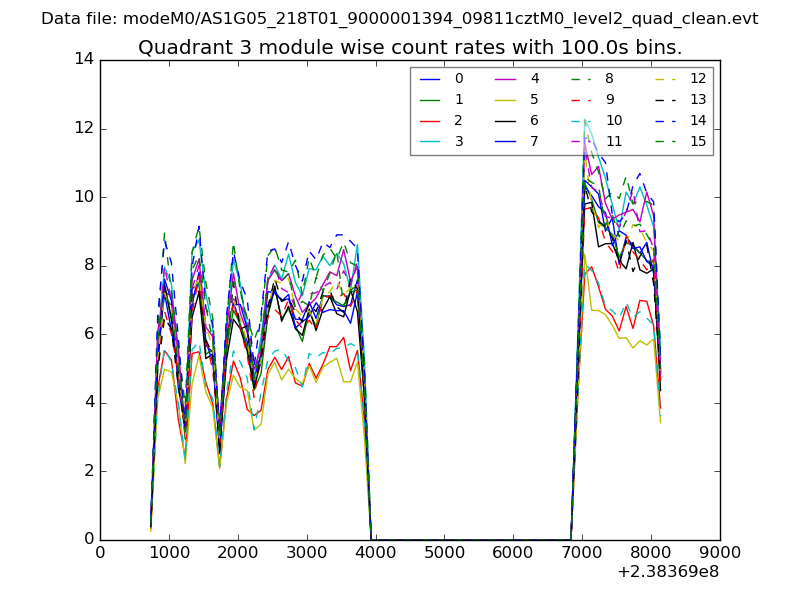
| Module-wise count rates for Quadrant C Data is divided into 100 sec bins |
 |
 |
| Module-wise count rates for Quadrant D Data is divided into 100 sec bins |
 |
 |
| Parameter | Plot |
|---|---|
| CZT HV Monitor | 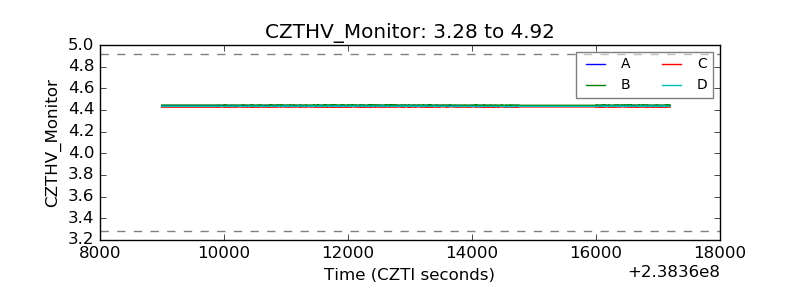 |
| D_VDD | 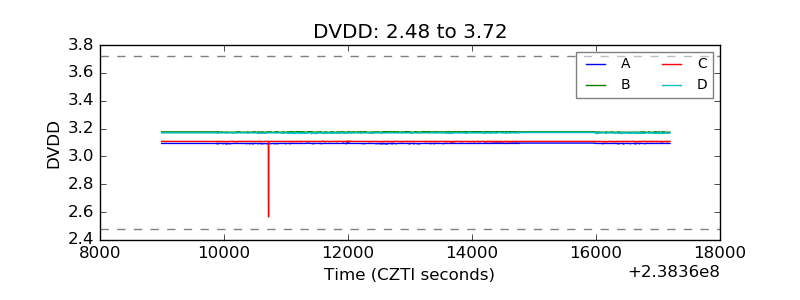 |
| Temperature 1 | 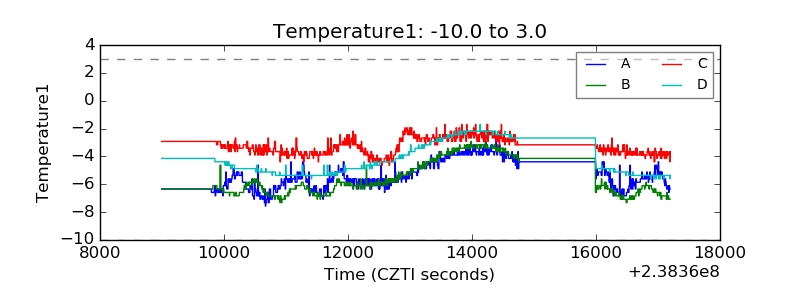 |
| Veto HV Monitor | 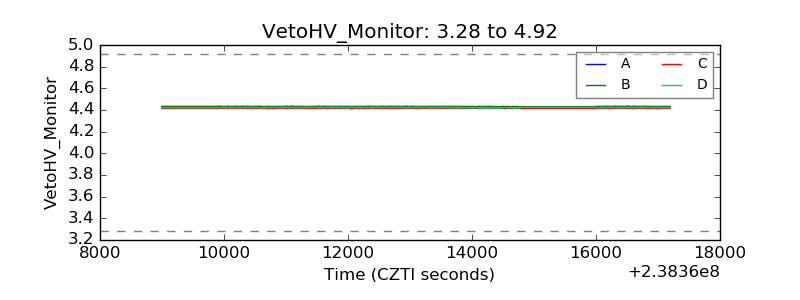 |
| Veto LLD | 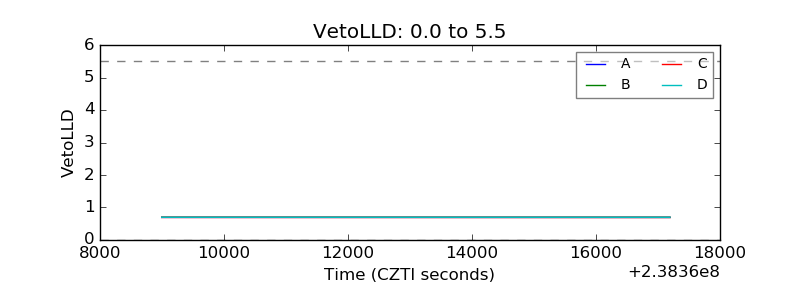 |
| Alpha Counter |  |
| _CPM_Rate | 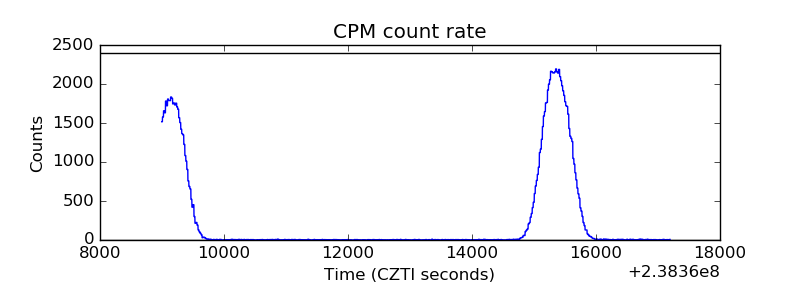 |
| CZT Counter |  |
| +2.5 Volts monitor |  |
| +5 Volts monitor |  |
| _ROLL_ROT | 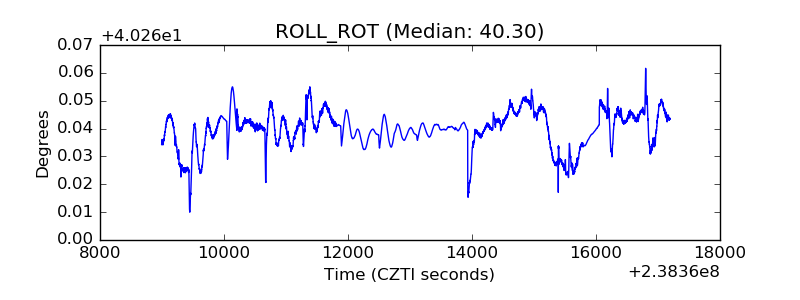 |
| _Roll_DEC | 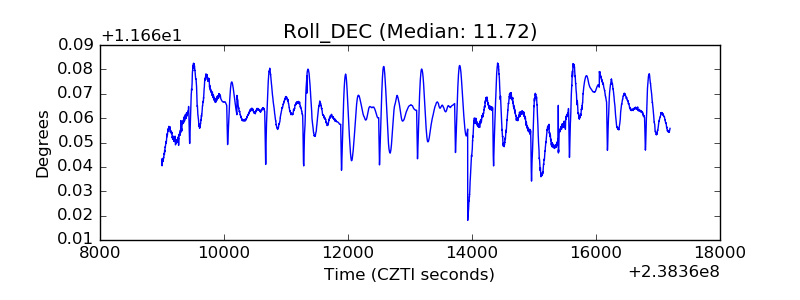 |
| _Roll_RA | 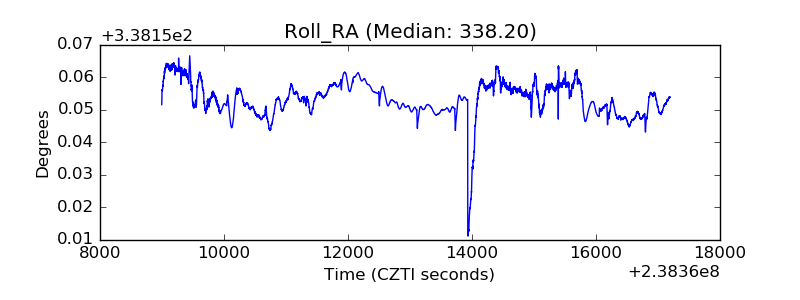 |
| Veto Counter | 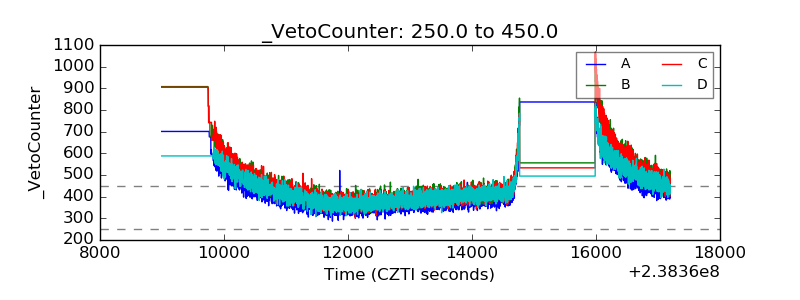 |