| Param | Original file | Final file |
|---|---|---|
| Filename | modeM0/AS1G05_218T01_9000001394_09814cztM0_level2.evt | modeM0/AS1G05_218T01_9000001394_09814cztM0_level2_quad_clean.evt |
| Size (bytes) | 771,497,280 | 145,465,920 |
| Size | 735.8 MB | 138.7 MB |
| Events in quadrant A | 5,450,429 | 915,531 |
| Events in quadrant B | 5,573,909 | 942,239 |
| Events in quadrant C | 5,289,886 | 900,928 |
| Events in quadrant D | 6,291,291 | 870,922 |
| Mode SS | |||
|---|---|---|---|
| Quadrant | BADHDUFLAG | Total packets | Discarded packets |
| A | 0 | 228 | 0 |
| B | 0 | 228 | 0 |
| C | 0 | 228 | 0 |
| D | 0 | 228 | 0 |
| Mode M0 | |||
|---|---|---|---|
| Quadrant | BADHDUFLAG | Total packets | Discarded packets |
| A | 0 | 23275 | 4 |
| B | 0 | 23564 | 3 |
| C | 0 | 23205 | 3 |
| D | 0 | 26361 | 3 |
| Mode M9 | |||
|---|---|---|---|
| Quadrant | BADHDUFLAG | Total packets | Discarded packets |
| A | 0 | 26 | 0 |
| B | 0 | 26 | 0 |
| C | 0 | 26 | 0 |
| D | 0 | 26 | 0 |
| Quadrant | Total seconds | Saturated seconds | Saturation percentage |
|---|---|---|---|
| A | 11213 | 92 | 0.820476% |
| B | 11213 | 139 | 1.239633% |
| C | 11213 | 66 | 0.588603% |
| D | 11213 | 96 | 0.856149% |
Noise dominated data is calculated using 1-second bins in cleaned event files. If a bin has >2000 counts, and if more than 50% of those come from <1% of pixels, then it is considered to be noise-dominated and hence unusable.
| Quadrant | # 1 sec bins | Bins with >0 counts | Bins with >2000 counts | High rate bins dominated by noise | Noise dominated (total time) | Noise dominated (detector-on time) | Marked lightcurve |
|---|---|---|---|---|---|---|---|
| A | 13784 | 11216 | 1 | 1 | 0.01% | 0.01% | 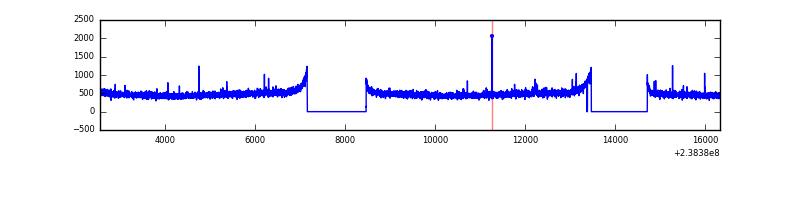 |
| B | 13784 | 11216 | 4 | 4 | 0.03% | 0.04% | 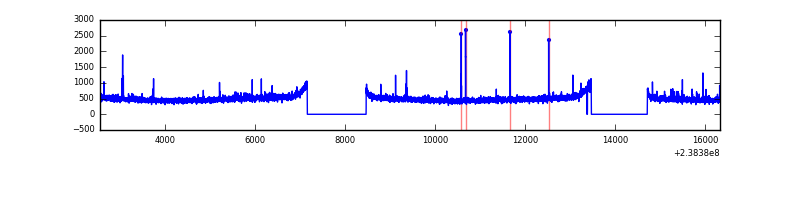 |
| C | 13784 | 11216 | 0 | 0 | 0.00% | 0.00% | 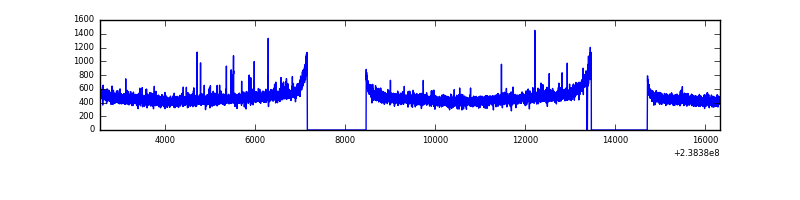 |
| D | 13784 | 11216 | 46 | 46 | 0.33% | 0.41% | 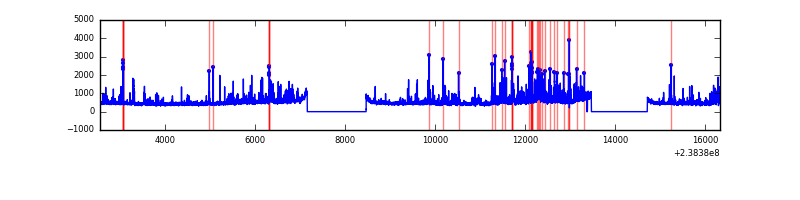 |
Top three noisy pixels from each quadrant. If the there are fewer than three noisy pixels in the level2.evt file, extra rows are filled as -1
| Pixel properties | Quadrant properties | ||||||
|---|---|---|---|---|---|---|---|
| Quadrant | DetID | PixID | Counts | Sigma | Mean | Median | Sigma |
| A | 1 | 162 | 21848 | 72.3 | 1403 | 1373 | 283.2 |
| A | 0 | 226 | 13011 | 41.09 | 1403 | 1373 | 283.2 |
| A | 12 | 194 | 11174 | 34.61 | 1403 | 1373 | 283.2 |
| B | 0 | 85 | 56652 | 207.13 | 1402 | 1371 | 266.9 |
| B | 4 | 173 | 39500 | 142.86 | 1402 | 1371 | 266.9 |
| B | 12 | 111 | 30300 | 108.39 | 1402 | 1371 | 266.9 |
| C | 0 | 207 | 36149 | 112.77 | 1341 | 1352 | 308.6 |
| C | 10 | 22 | 22669 | 69.08 | 1341 | 1352 | 308.6 |
| C | 13 | 61 | 10001 | 28.03 | 1341 | 1352 | 308.6 |
| D | 1 | 52 | 850685 | 2455.18 | 1334 | 1307 | 346.0 |
| D | 2 | 152 | 94522 | 269.44 | 1334 | 1307 | 346.0 |
| D | 2 | 16 | 78753 | 223.86 | 1334 | 1307 | 346.0 |
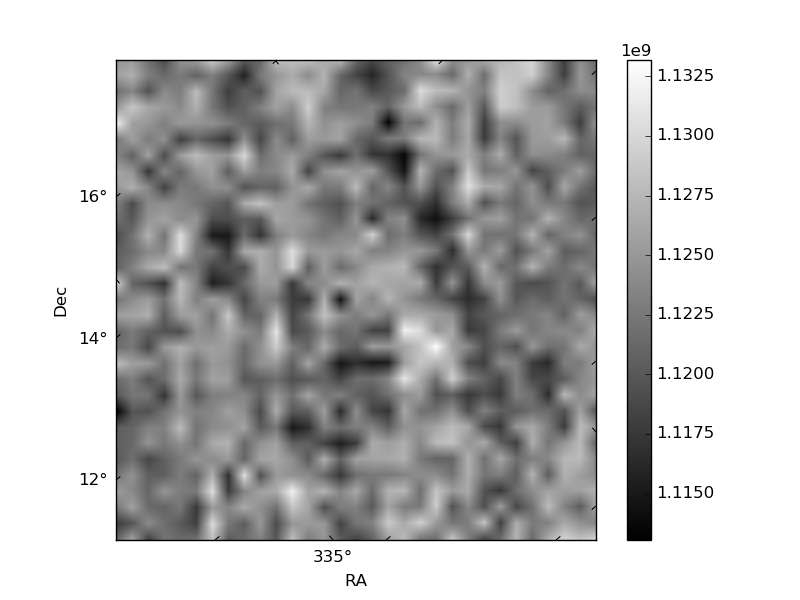
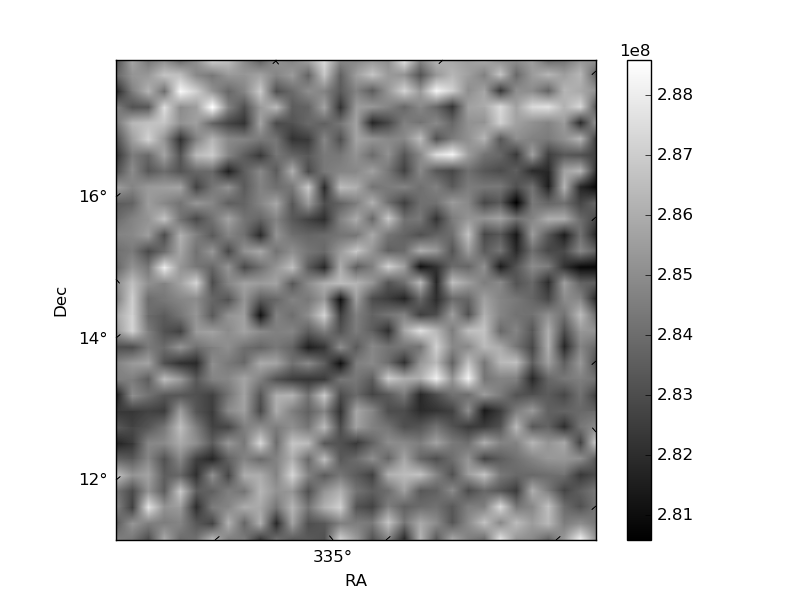
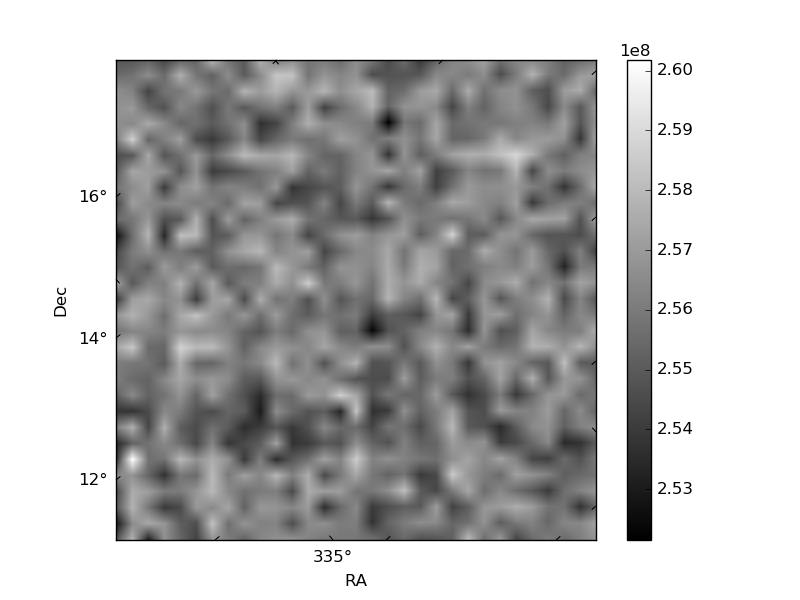
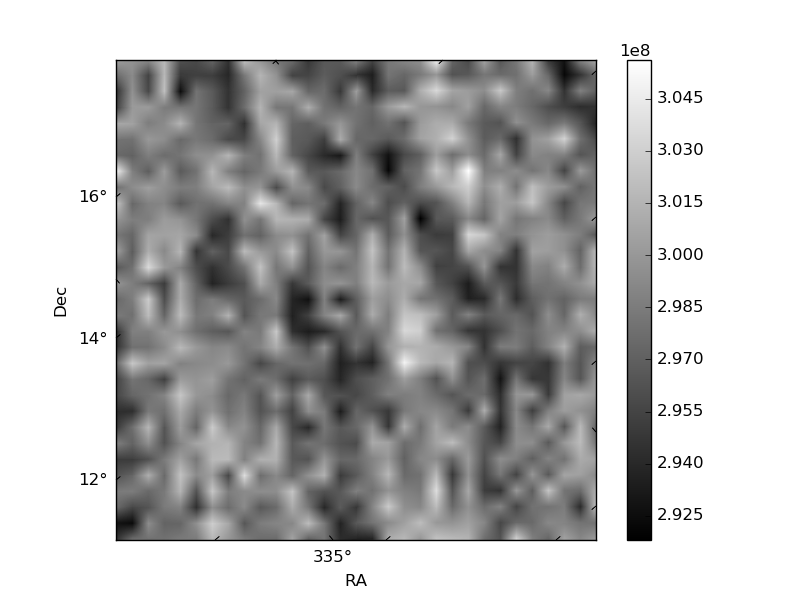
Histogram calculated using DETX and DETY for each event in the final _common_clean file
| Quadrant A | 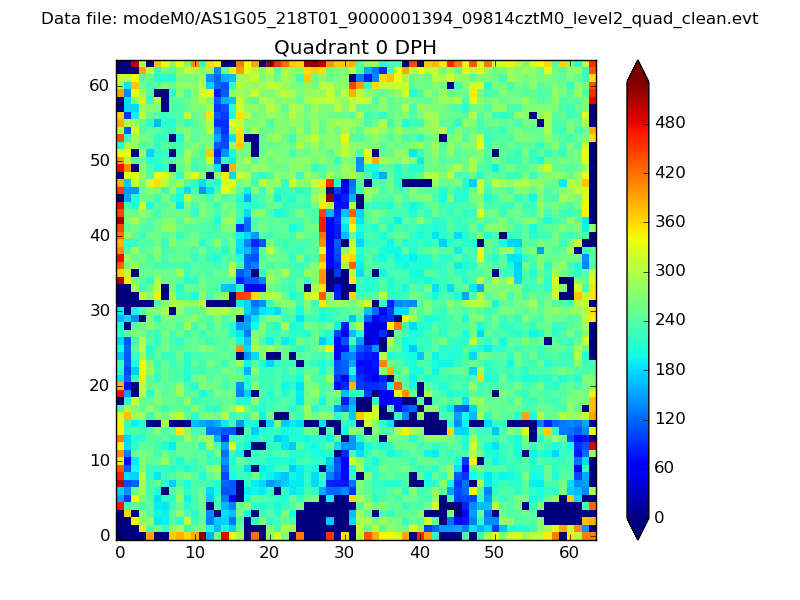 |
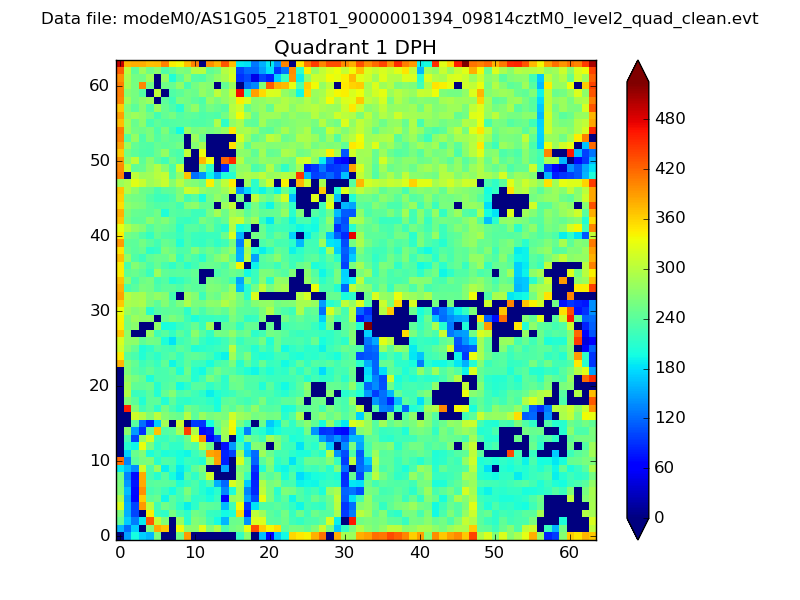 |
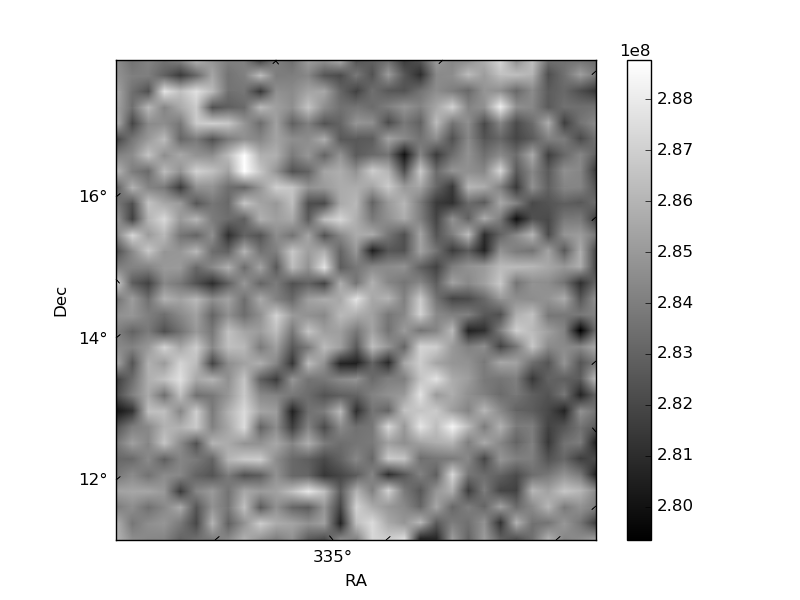
Quadrant B |
|---|---|---|---|
| Quadrant D | 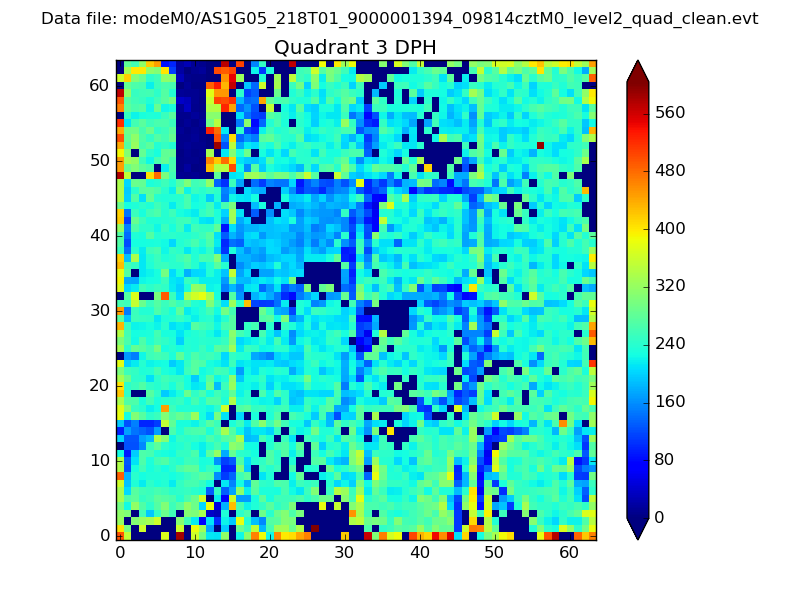 |
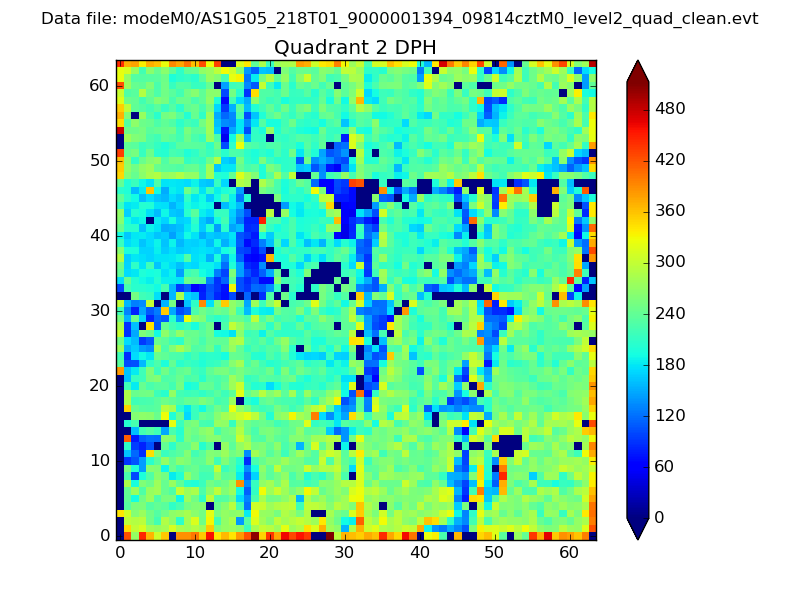 |
Quadrant C |
| Plot type | Count rate plots | Images |
|---|---|---|
| Comparison with Poisson distribution Blue bars denote a histogram of data divided into 1 sec bins. Red curve is a Poisson curve with rate = median count rate of data. |
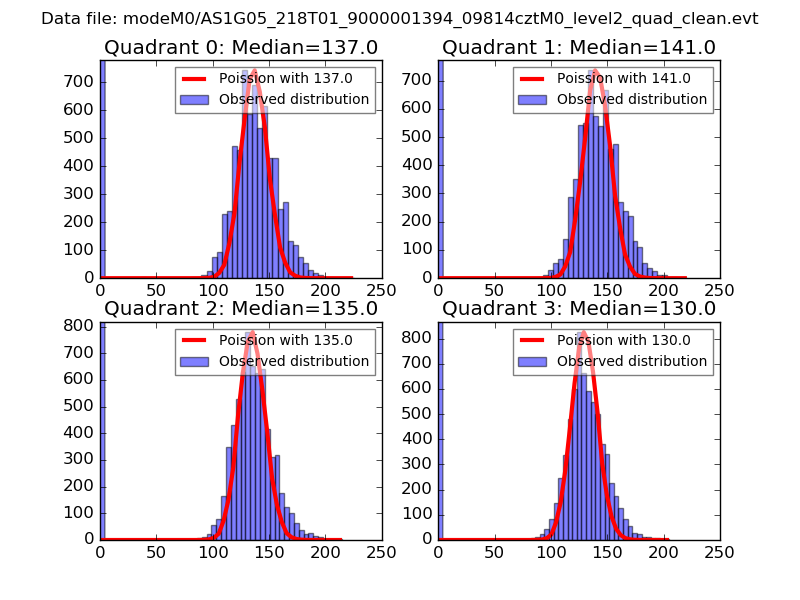 |
 |
| Quadrant-wise count rates Data is divided into 100 sec bins |
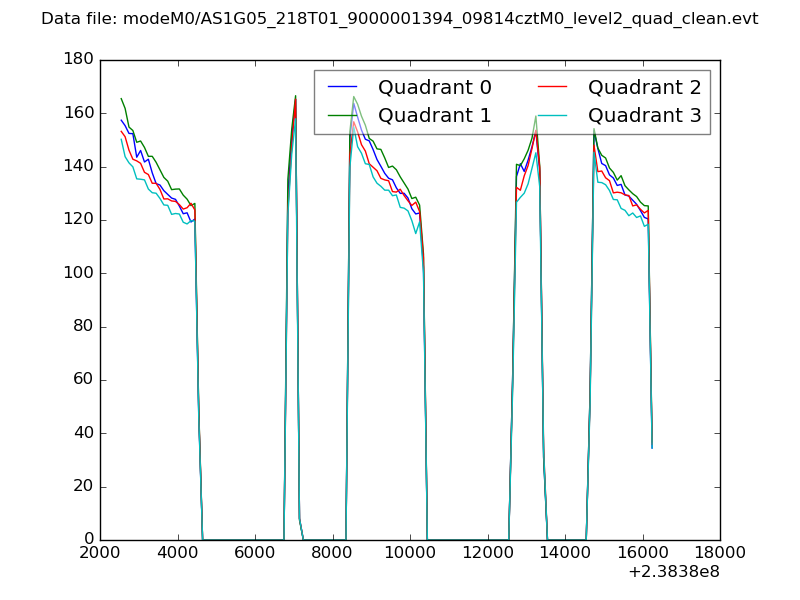 |
|
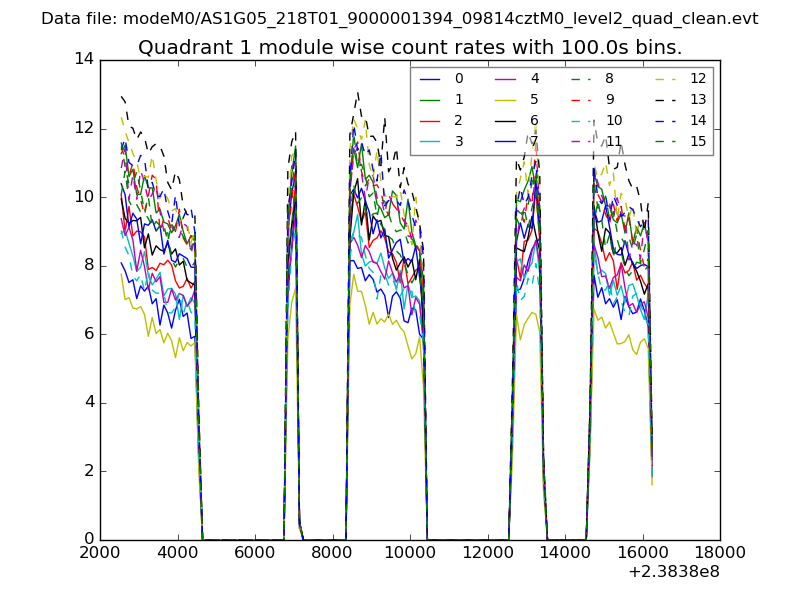
| Module-wise count rates for Quadrant A Data is divided into 100 sec bins |
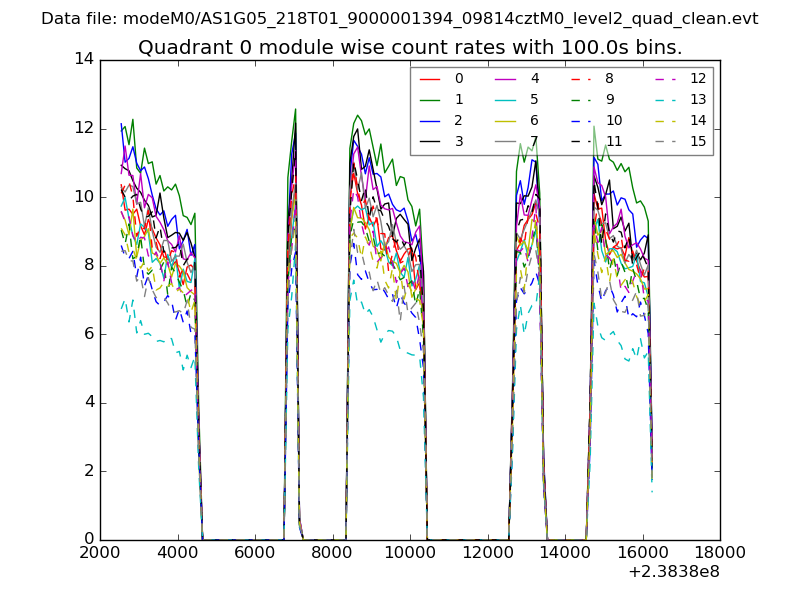 |
 |
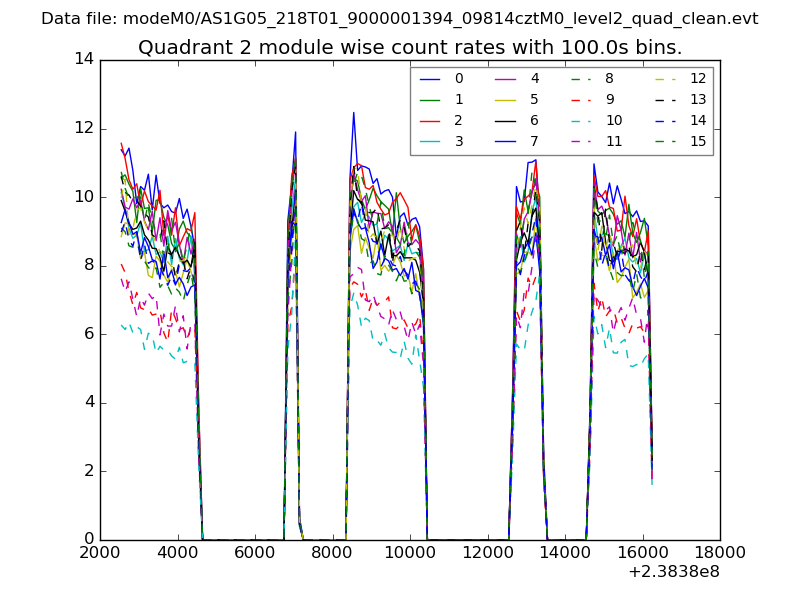
| Module-wise count rates for Quadrant B Data is divided into 100 sec bins |
 |
 |
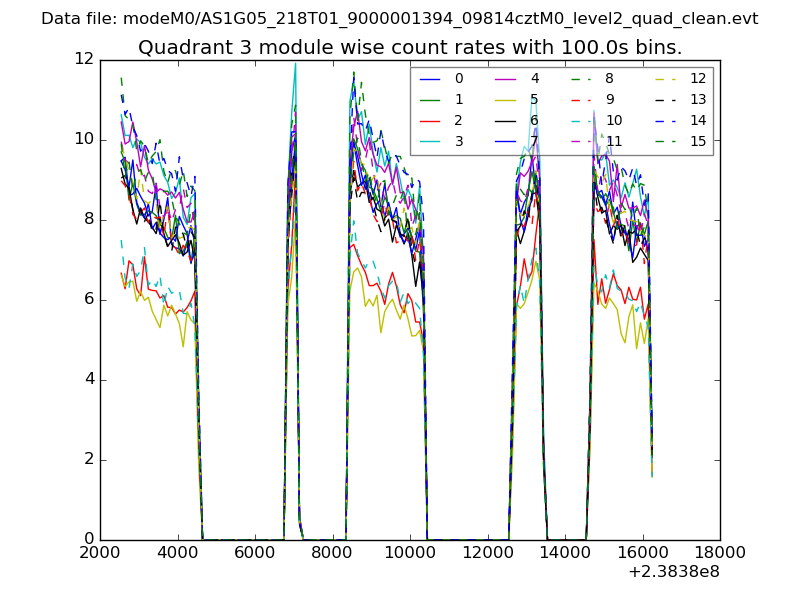
| Module-wise count rates for Quadrant C Data is divided into 100 sec bins |
 |
 |
| Module-wise count rates for Quadrant D Data is divided into 100 sec bins |
 |
 |
| Parameter | Plot |
|---|---|
| CZT HV Monitor | 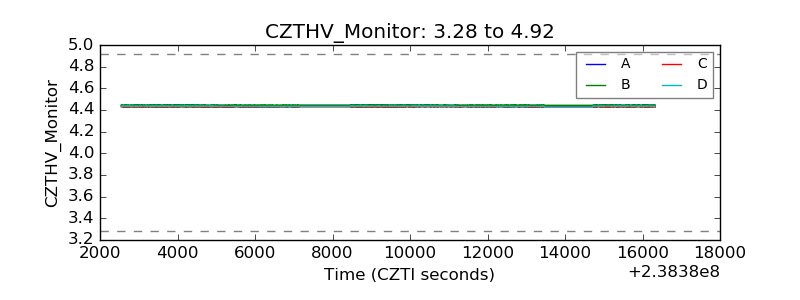 |
| D_VDD | 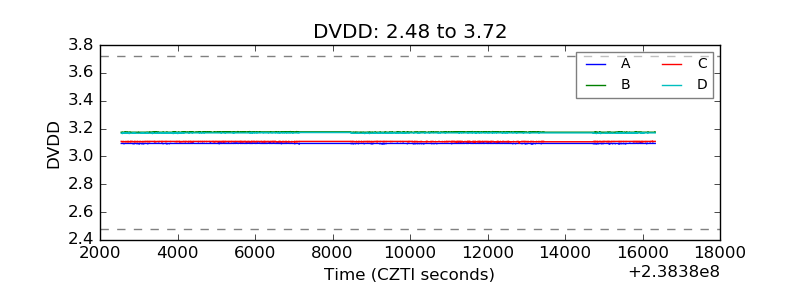 |
| Temperature 1 | 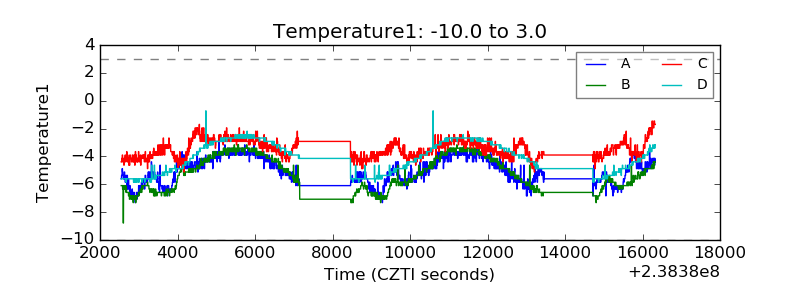 |
| Veto HV Monitor | 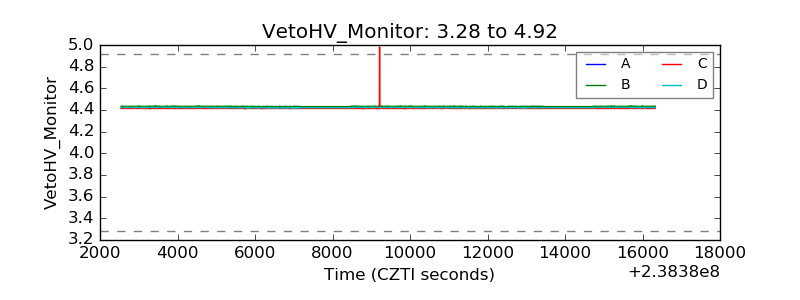 |
| Veto LLD | 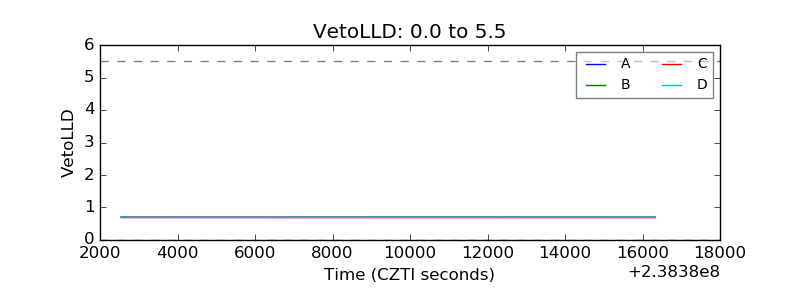 |
| Alpha Counter | 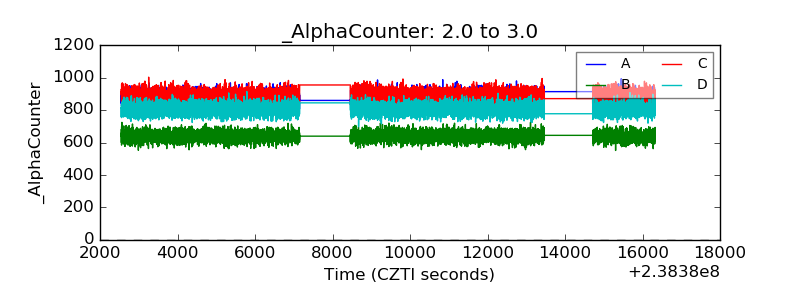 |
| _CPM_Rate | 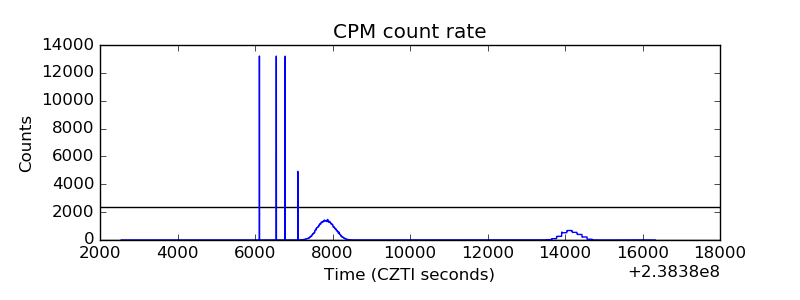 |
| CZT Counter | 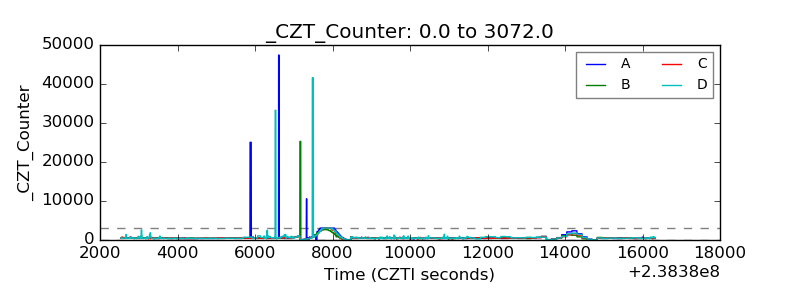 |
| +2.5 Volts monitor |  |
| +5 Volts monitor |  |
| _ROLL_ROT | 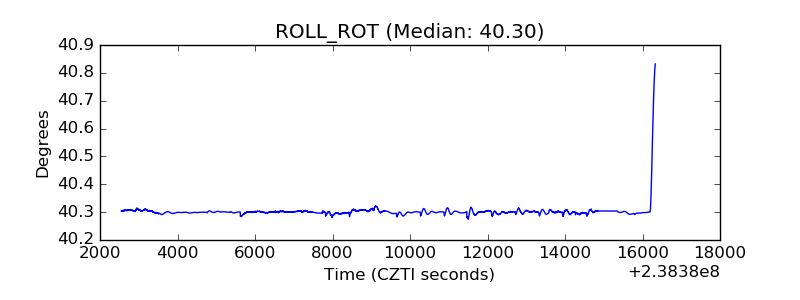 |
| _Roll_DEC | 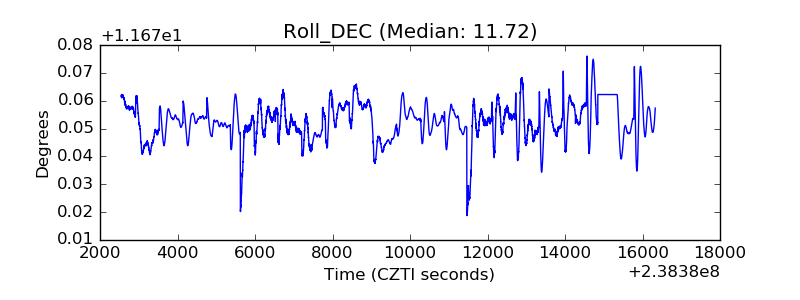 |
| _Roll_RA | 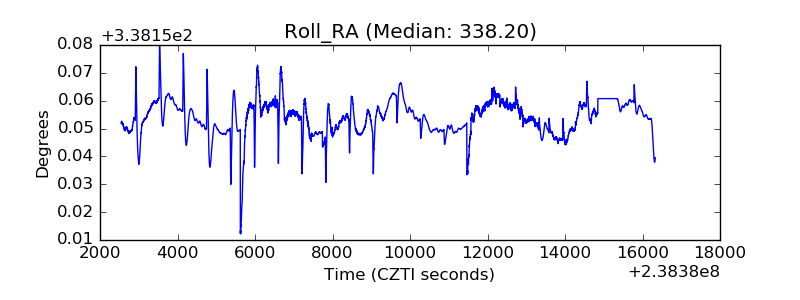 |
| Veto Counter | 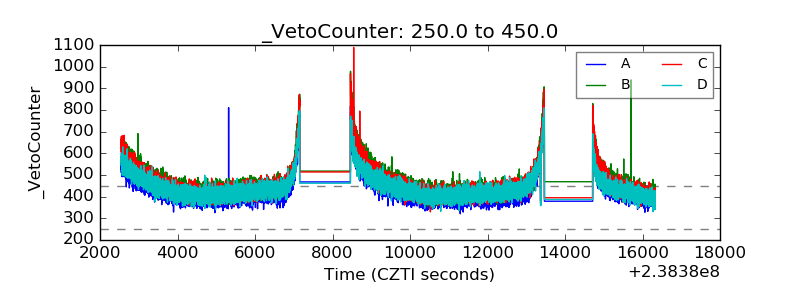 |