| Param | Original file | Final file |
|---|---|---|
| Filename | modeM0/AS1G05_218T01_9000001394_09816cztM0_level2.evt | modeM0/AS1G05_218T01_9000001394_09816cztM0_level2_quad_clean.evt |
| Size (bytes) | 488,963,520 | 84,487,680 |
| Size | 466.3 MB | 80.6 MB |
| Events in quadrant A | 3,337,942 | 523,224 |
| Events in quadrant B | 3,378,900 | 531,248 |
| Events in quadrant C | 3,188,095 | 517,283 |
| Events in quadrant D | 4,423,993 | 495,073 |
| Mode SS | |||
|---|---|---|---|
| Quadrant | BADHDUFLAG | Total packets | Discarded packets |
| A | 0 | 142 | 0 |
| B | 0 | 142 | 0 |
| C | 0 | 142 | 0 |
| D | 0 | 142 | 0 |
| Mode M0 | |||
|---|---|---|---|
| Quadrant | BADHDUFLAG | Total packets | Discarded packets |
| A | 0 | 14641 | 3 |
| B | 0 | 14619 | 2 |
| C | 0 | 14427 | 2 |
| D | 0 | 17833 | 2 |
| Mode M9 | |||
|---|---|---|---|
| Quadrant | BADHDUFLAG | Total packets | Discarded packets |
| A | 0 | 11 | 0 |
| B | 0 | 11 | 0 |
| C | 0 | 11 | 0 |
| D | 0 | 12 | 0 |
| Quadrant | Total seconds | Saturated seconds | Saturation percentage |
|---|---|---|---|
| A | 7062 | 99 | 1.401869% |
| B | 7062 | 99 | 1.401869% |
| C | 7062 | 46 | 0.651374% |
| D | 7062 | 185 | 2.619654% |
Noise dominated data is calculated using 1-second bins in cleaned event files. If a bin has >2000 counts, and if more than 50% of those come from <1% of pixels, then it is considered to be noise-dominated and hence unusable.
| Quadrant | # 1 sec bins | Bins with >0 counts | Bins with >2000 counts | High rate bins dominated by noise | Noise dominated (total time) | Noise dominated (detector-on time) | Marked lightcurve |
|---|---|---|---|---|---|---|---|
| A | 7762 | 7063 | 6 | 6 | 0.08% | 0.08% | 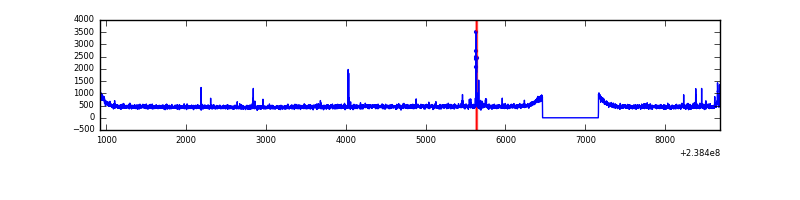 |
| B | 7762 | 7063 | 3 | 3 | 0.04% | 0.04% | 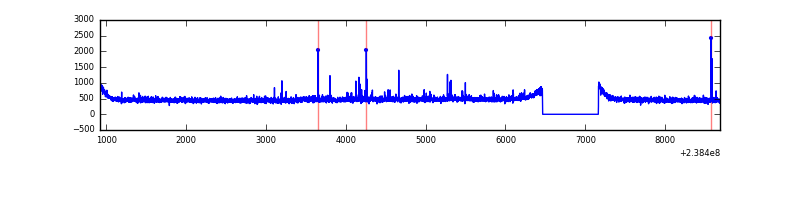 |
| C | 7762 | 7063 | 0 | 0 | 0.00% | 0.00% | 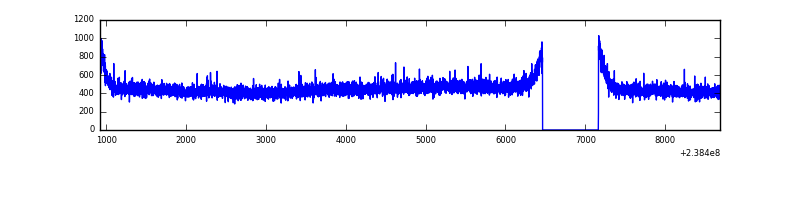 |
| D | 7762 | 7063 | 89 | 89 | 1.15% | 1.26% |  |
Top three noisy pixels from each quadrant. If the there are fewer than three noisy pixels in the level2.evt file, extra rows are filled as -1
| Pixel properties | Quadrant properties | ||||||
|---|---|---|---|---|---|---|---|
| Quadrant | DetID | PixID | Counts | Sigma | Mean | Median | Sigma |
| A | 13 | 248 | 34232 | 193.01 | 848 | 830 | 173.1 |
| A | 8 | 15 | 26214 | 146.68 | 848 | 830 | 173.1 |
| A | 8 | 5 | 9535 | 50.3 | 848 | 830 | 173.1 |
| B | 10 | 252 | 23766 | 140.62 | 846 | 824 | 163.2 |
| B | 4 | 173 | 23250 | 137.45 | 846 | 824 | 163.2 |
| B | 12 | 111 | 18871 | 110.61 | 846 | 824 | 163.2 |
| C | 0 | 207 | 9283 | 44.41 | 814 | 817 | 190.6 |
| C | 13 | 61 | 5997 | 27.17 | 814 | 817 | 190.6 |
| C | 10 | 22 | 3453 | 13.83 | 814 | 817 | 190.6 |
| D | 1 | 52 | 799890 | 3741.28 | 810 | 792 | 213.6 |
| D | 2 | 152 | 232736 | 1085.93 | 810 | 792 | 213.6 |
| D | 5 | 113 | 201873 | 941.44 | 810 | 792 | 213.6 |
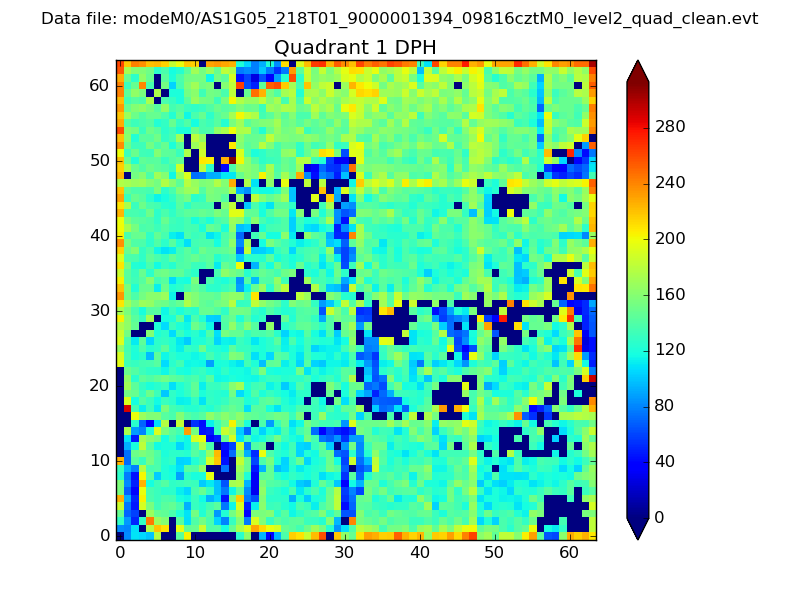
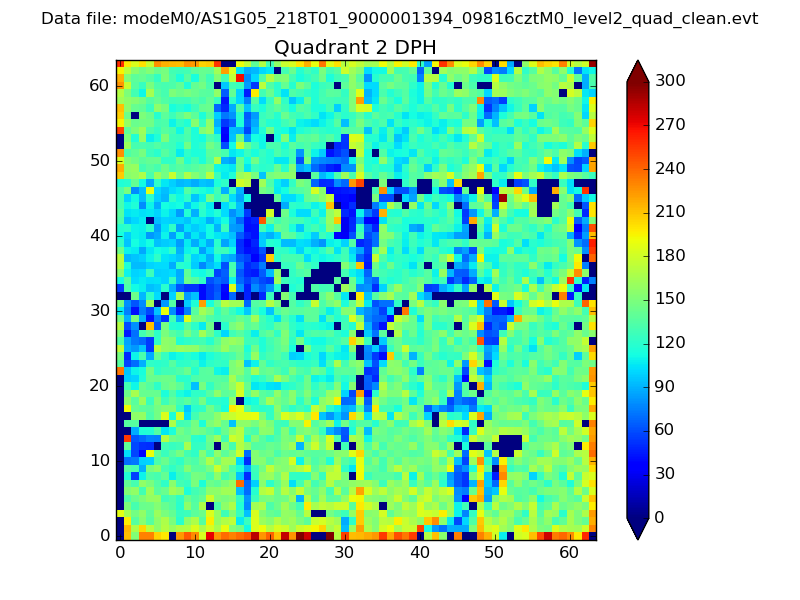
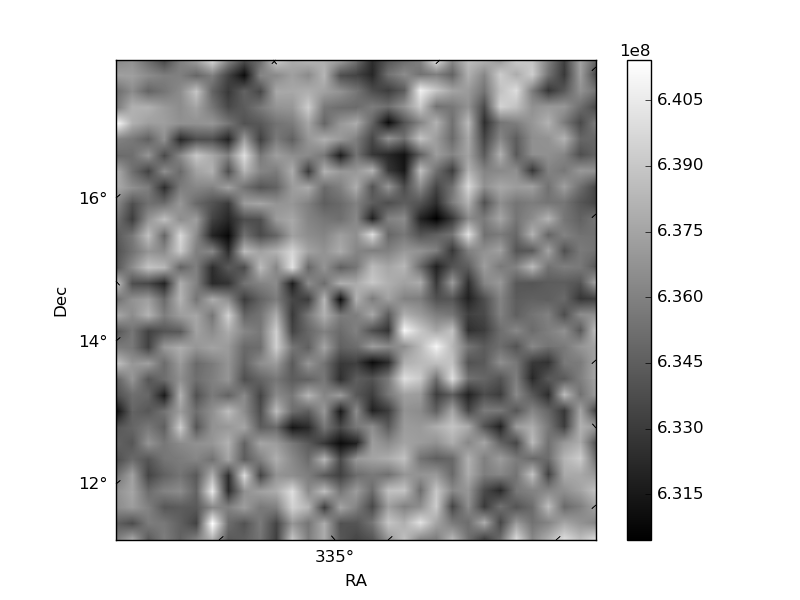
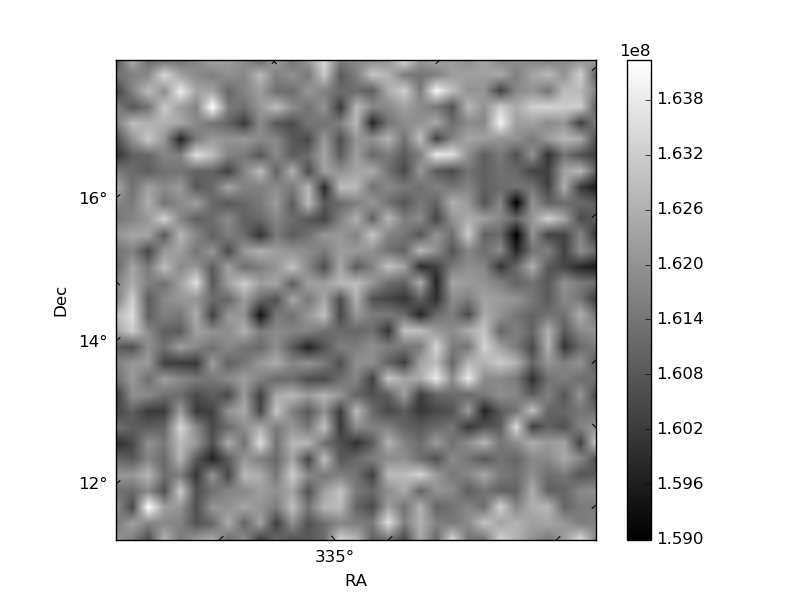
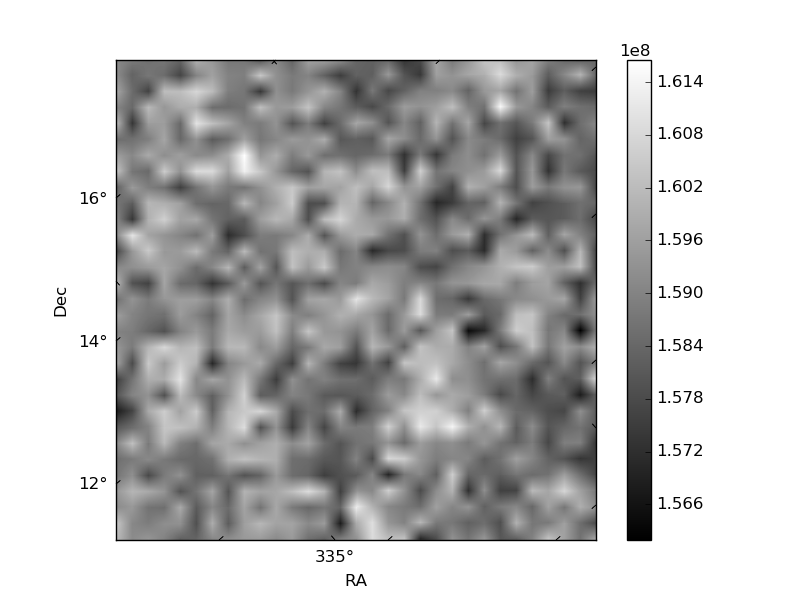
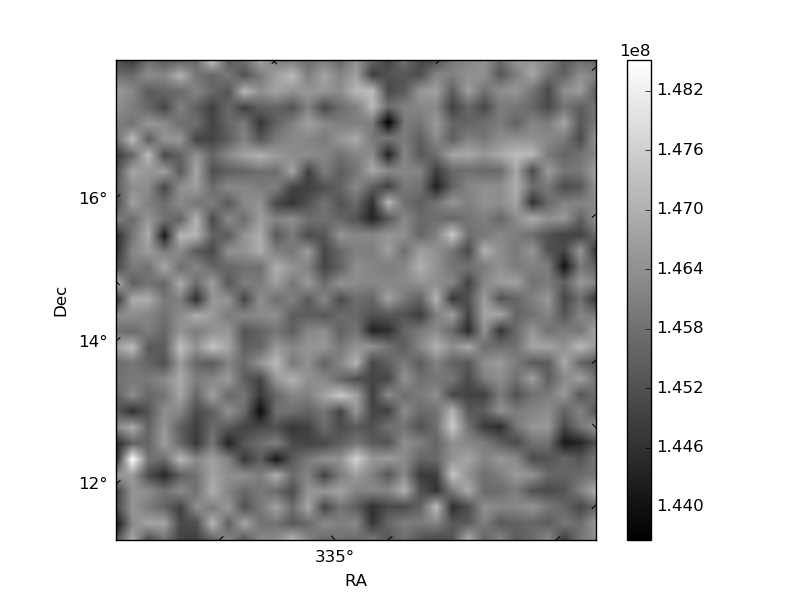
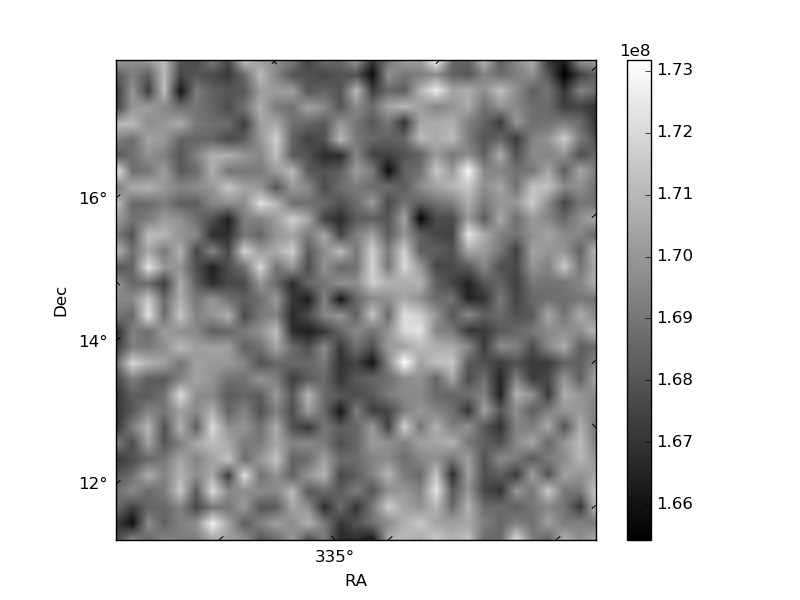
Histogram calculated using DETX and DETY for each event in the final _common_clean file
| Quadrant A | 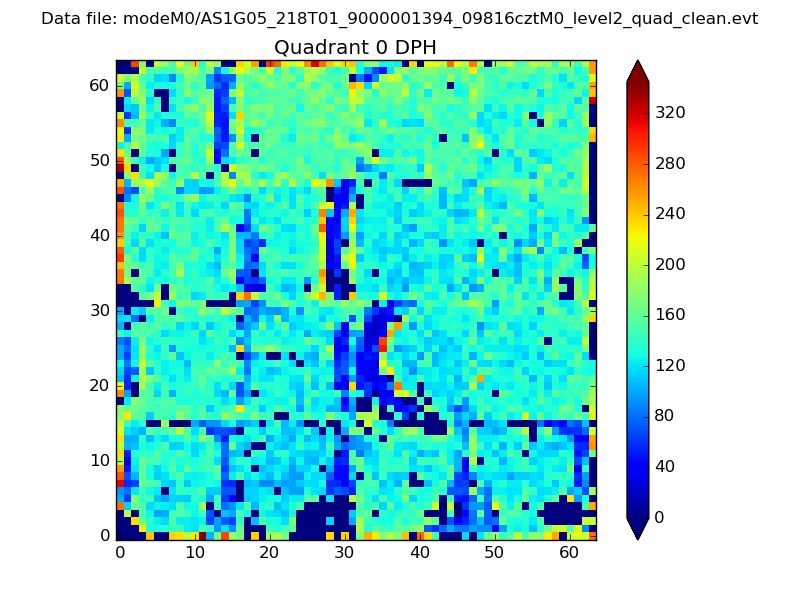 |
 |
Quadrant B |
|---|---|---|---|
| Quadrant D | 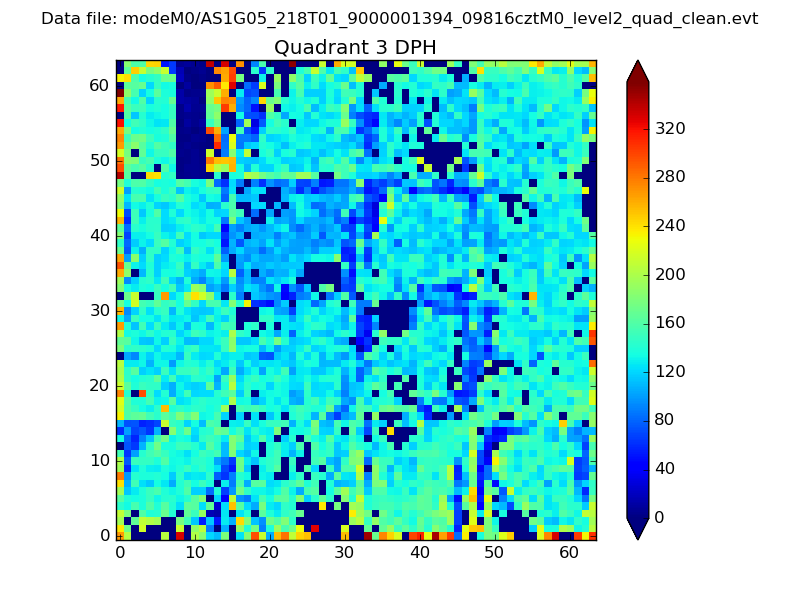 |
 |
Quadrant C |
| Plot type | Count rate plots | Images |
|---|---|---|
| Comparison with Poisson distribution Blue bars denote a histogram of data divided into 1 sec bins. Red curve is a Poisson curve with rate = median count rate of data. |
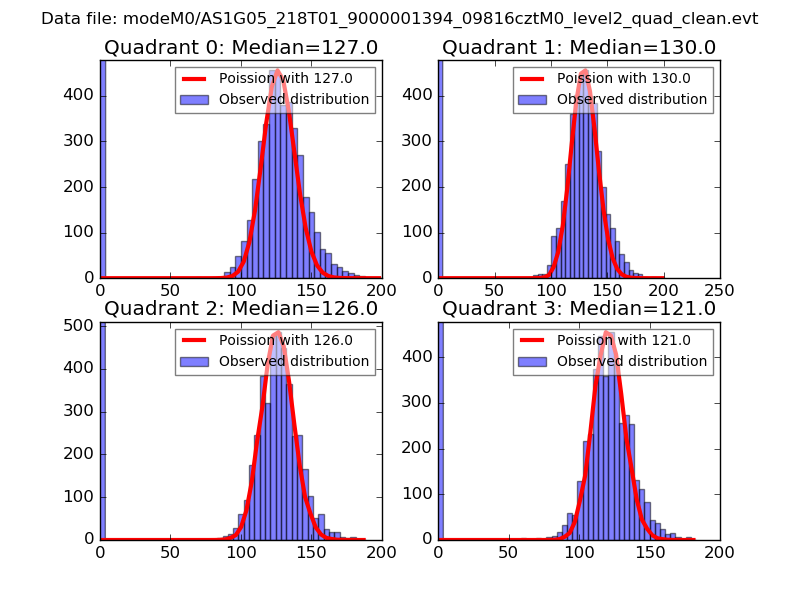 |
 |
| Quadrant-wise count rates Data is divided into 100 sec bins |
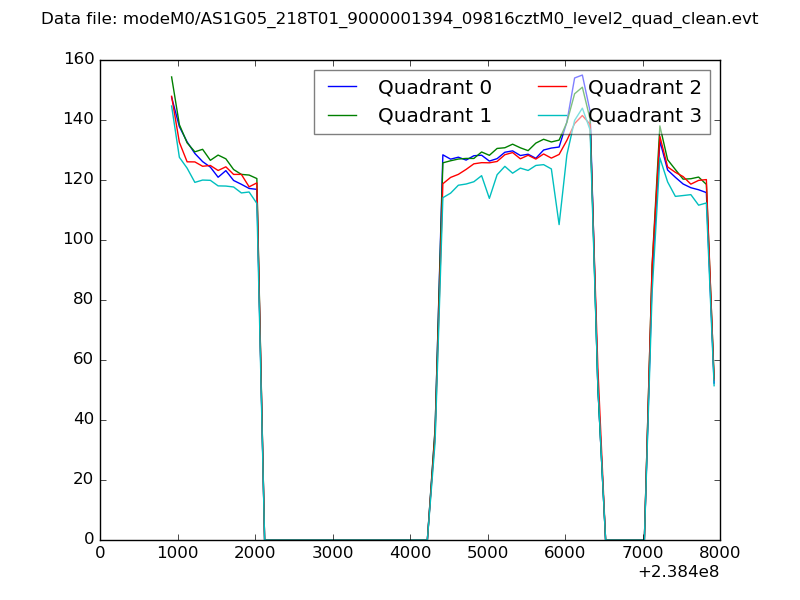 |
|
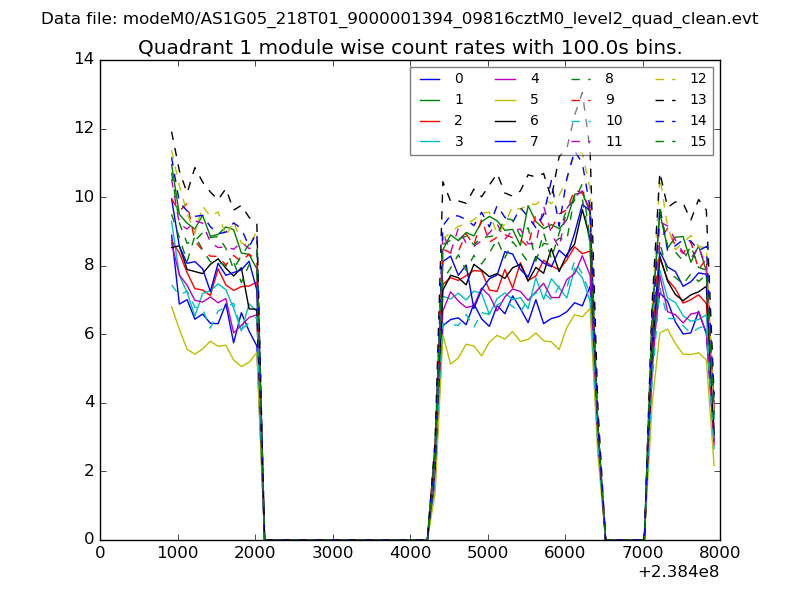
| Module-wise count rates for Quadrant A Data is divided into 100 sec bins |
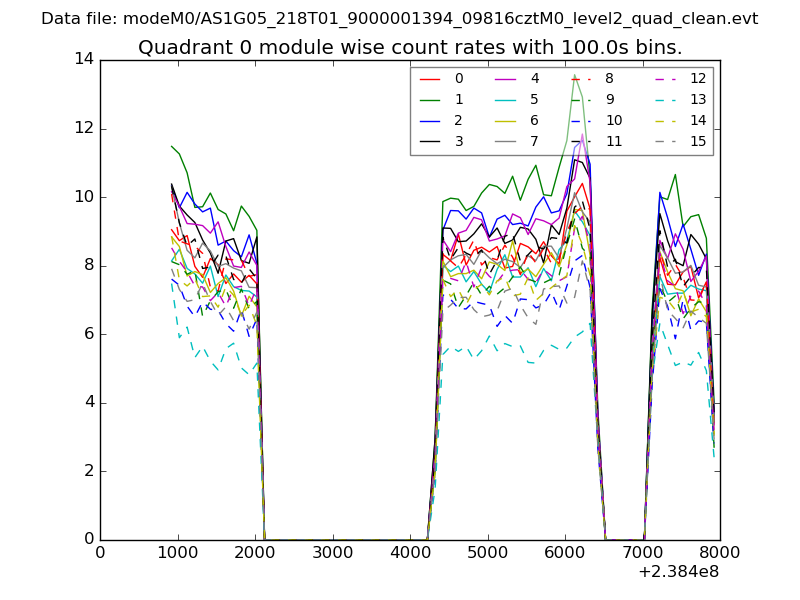 |
 |
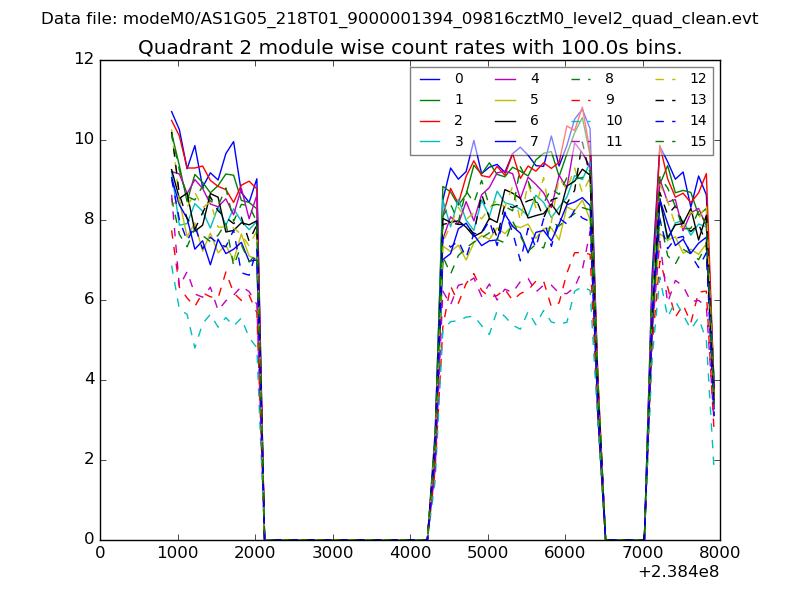
| Module-wise count rates for Quadrant B Data is divided into 100 sec bins |
 |
 |
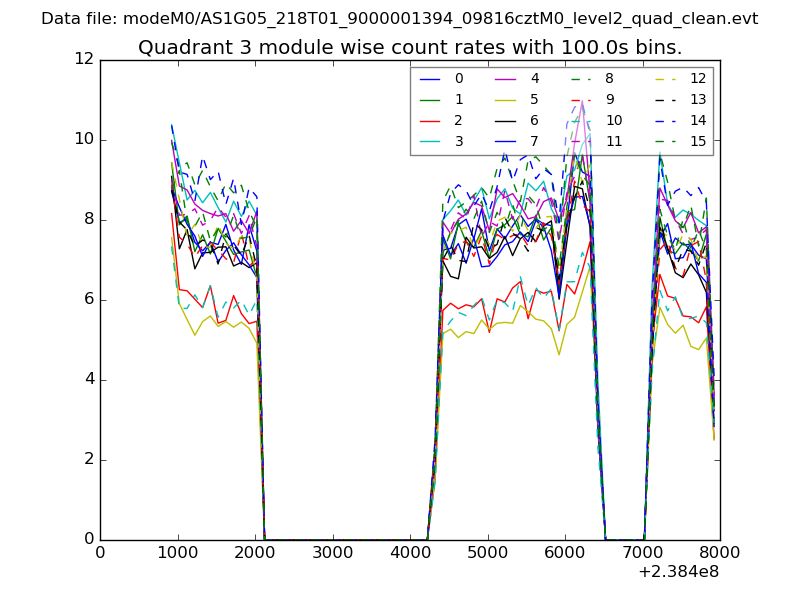
| Module-wise count rates for Quadrant C Data is divided into 100 sec bins |
 |
 |
| Module-wise count rates for Quadrant D Data is divided into 100 sec bins |
 |
 |
| Parameter | Plot |
|---|---|
| CZT HV Monitor | 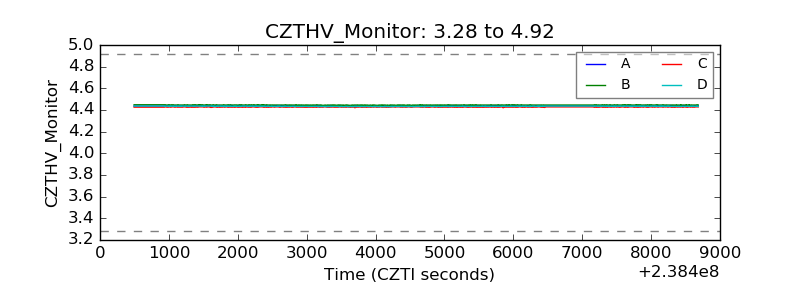 |
| D_VDD | 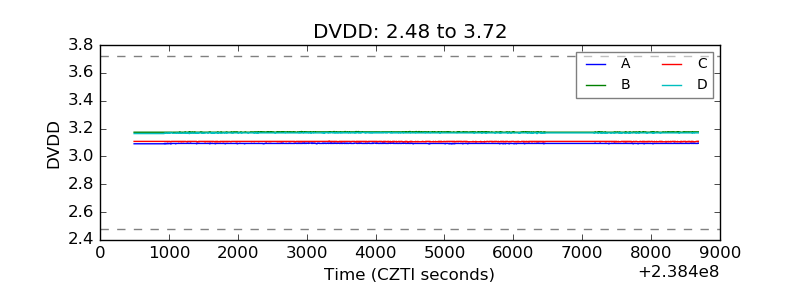 |
| Temperature 1 | 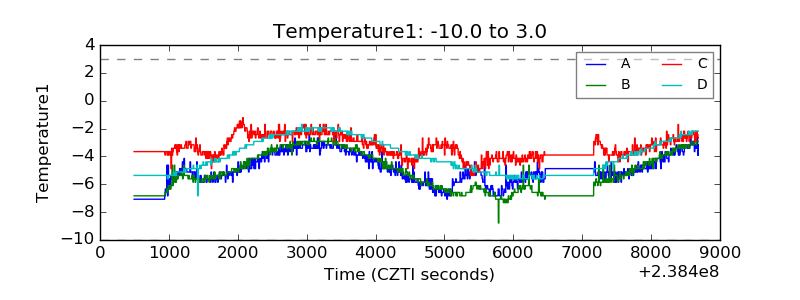 |
| Veto HV Monitor | 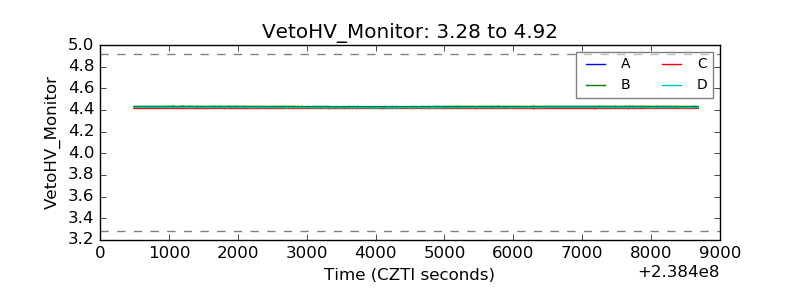 |
| Veto LLD | 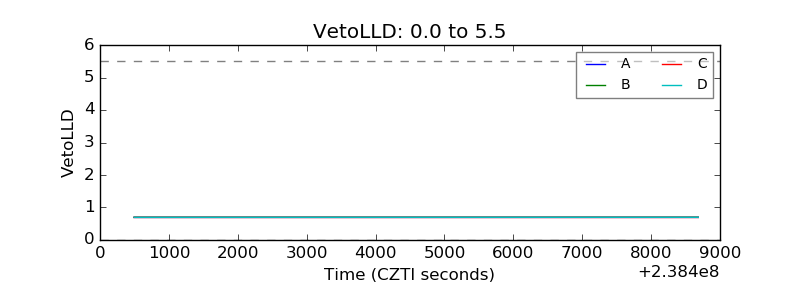 |
| Alpha Counter | 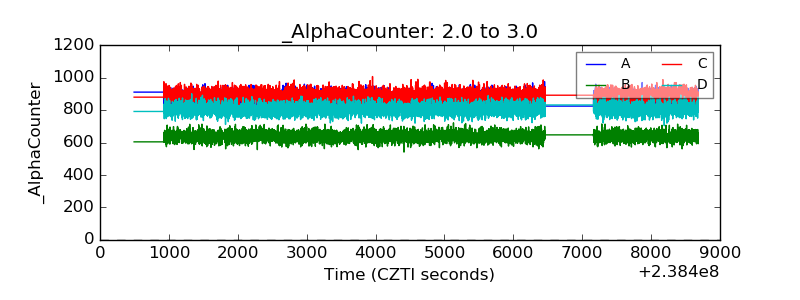 |
| _CPM_Rate | 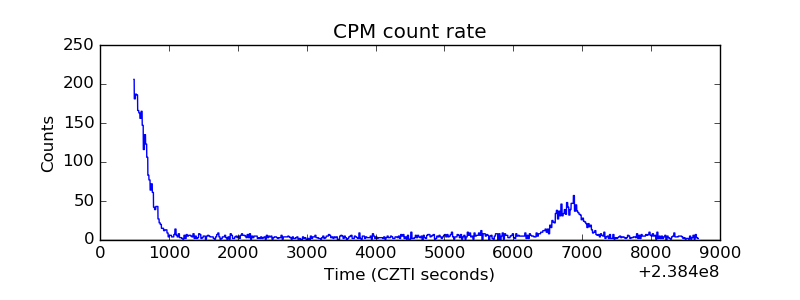 |
| CZT Counter | 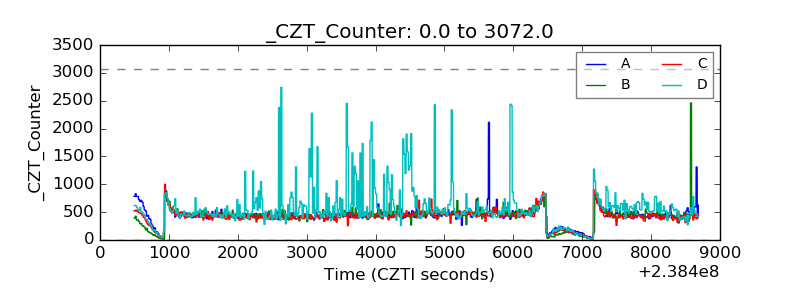 |
| +2.5 Volts monitor |  |
| +5 Volts monitor |  |
| _ROLL_ROT | 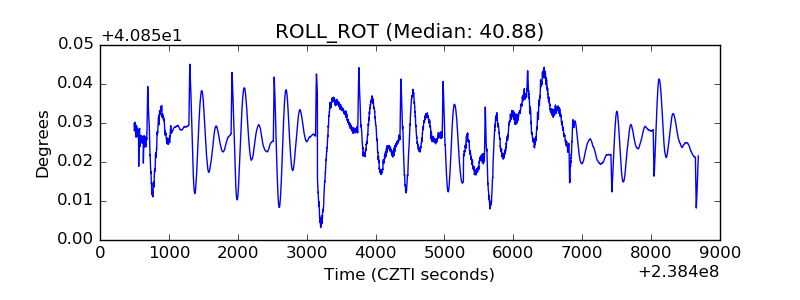 |
| _Roll_DEC | 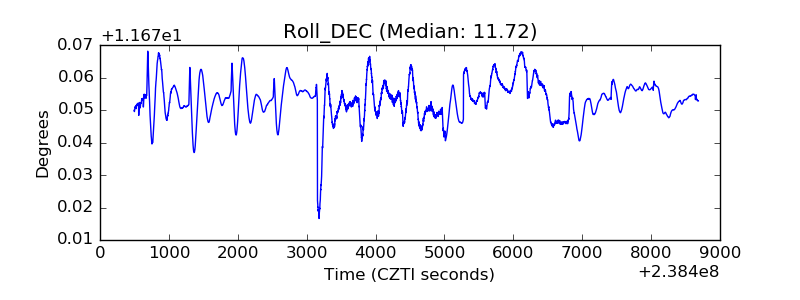 |
| _Roll_RA | 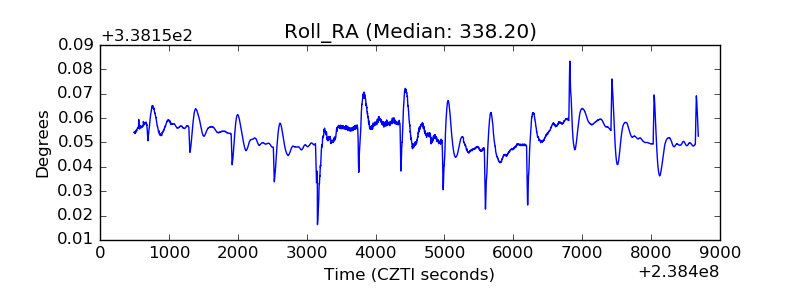 |
| Veto Counter | 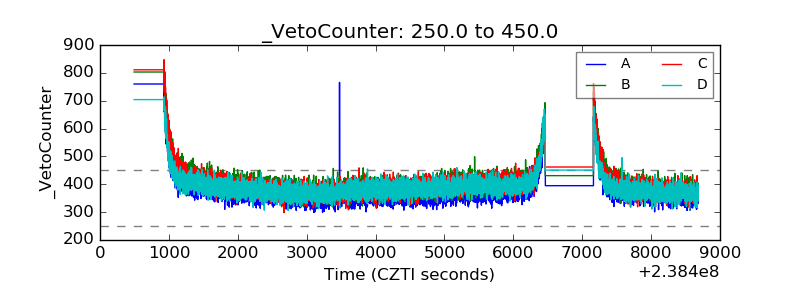 |