| Param | Original file | Final file |
|---|---|---|
| Filename | modeM0/AS1G05_218T01_9000001394_09818cztM0_level2.evt | modeM0/AS1G05_218T01_9000001394_09818cztM0_level2_quad_clean.evt |
| Size (bytes) | 671,941,440 | 110,096,640 |
| Size | 640.8 MB | 105.0 MB |
| Events in quadrant A | 4,610,131 | 687,600 |
| Events in quadrant B | 4,474,303 | 697,626 |
| Events in quadrant C | 4,339,506 | 671,206 |
| Events in quadrant D | 6,297,730 | 636,413 |
| Mode SS | |||
|---|---|---|---|
| Quadrant | BADHDUFLAG | Total packets | Discarded packets |
| A | 0 | 252 | 58 |
| B | 0 | 252 | 64 |
| C | 0 | 252 | 64 |
| D | 0 | 253 | 73 |
| Mode M0 | |||
|---|---|---|---|
| Quadrant | BADHDUFLAG | Total packets | Discarded packets |
| A | 0 | 26614 | 6782 |
| B | 0 | 26352 | 6951 |
| C | 0 | 26386 | 6908 |
| D | 0 | 35117 | 10292 |
| Mode M9 | |||
|---|---|---|---|
| Quadrant | BADHDUFLAG | Total packets | Discarded packets |
| A | 0 | 2 | 1 |
| B | 0 | 2 | 1 |
| C | 0 | 2 | 1 |
| D | 0 | 2 | 1 |
| Quadrant | Total seconds | Saturated seconds | Saturation percentage |
|---|---|---|---|
| A | 9356 | 252 | 2.693459% |
| B | 9305 | 252 | 2.708221% |
| C | 9280 | 232 | 2.500000% |
| D | 8932 | 383 | 4.287953% |
Noise dominated data is calculated using 1-second bins in cleaned event files. If a bin has >2000 counts, and if more than 50% of those come from <1% of pixels, then it is considered to be noise-dominated and hence unusable.
| Quadrant | # 1 sec bins | Bins with >0 counts | Bins with >2000 counts | High rate bins dominated by noise | Noise dominated (total time) | Noise dominated (detector-on time) | Marked lightcurve |
|---|---|---|---|---|---|---|---|
| A | 12562 | 10598 | 1 | 1 | 0.01% | 0.01% | 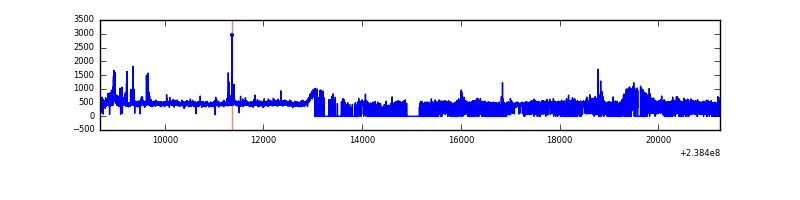 |
| B | 12562 | 10556 | 4 | 4 | 0.03% | 0.04% | 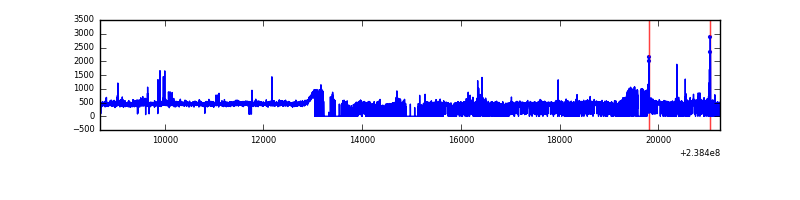 |
| C | 12562 | 10566 | 26 | 26 | 0.21% | 0.25% | 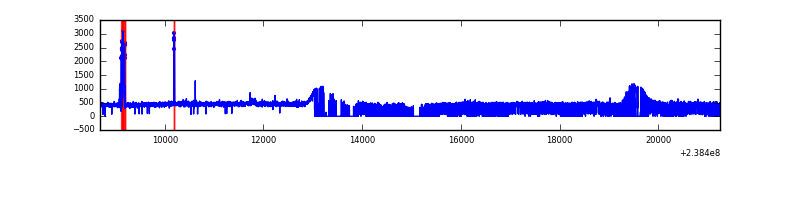 |
| D | 12562 | 10184 | 132 | 132 | 1.05% | 1.30% | 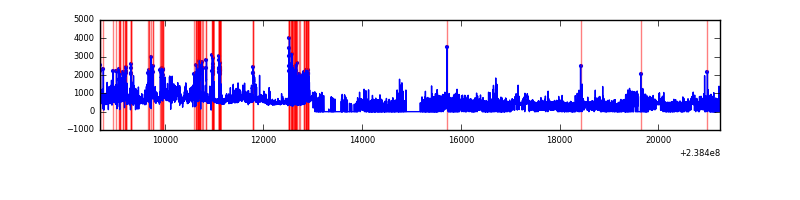 |
Top three noisy pixels from each quadrant. If the there are fewer than three noisy pixels in the level2.evt file, extra rows are filled as -1
| Pixel properties | Quadrant properties | ||||||
|---|---|---|---|---|---|---|---|
| Quadrant | DetID | PixID | Counts | Sigma | Mean | Median | Sigma |
| A | 8 | 15 | 200506 | 863.95 | 1122 | 1097 | 230.8 |
| A | 1 | 162 | 35865 | 150.63 | 1122 | 1097 | 230.8 |
| A | 13 | 248 | 30208 | 126.13 | 1122 | 1097 | 230.8 |
| B | 0 | 214 | 46577 | 208.05 | 1117 | 1087 | 218.6 |
| B | 4 | 239 | 25565 | 111.95 | 1117 | 1087 | 218.6 |
| B | 12 | 111 | 25247 | 110.5 | 1117 | 1087 | 218.6 |
| C | 1 | 3 | 102825 | 402.89 | 1078 | 1083 | 252.5 |
| C | 10 | 22 | 21299 | 80.05 | 1078 | 1083 | 252.5 |
| C | 9 | 54 | 9520 | 33.41 | 1078 | 1083 | 252.5 |
| D | 5 | 113 | 1464136 | 5450.13 | 1026 | 1002 | 268.5 |
| D | 1 | 52 | 520882 | 1936.54 | 1026 | 1002 | 268.5 |
| D | 2 | 152 | 176499 | 653.72 | 1026 | 1002 | 268.5 |
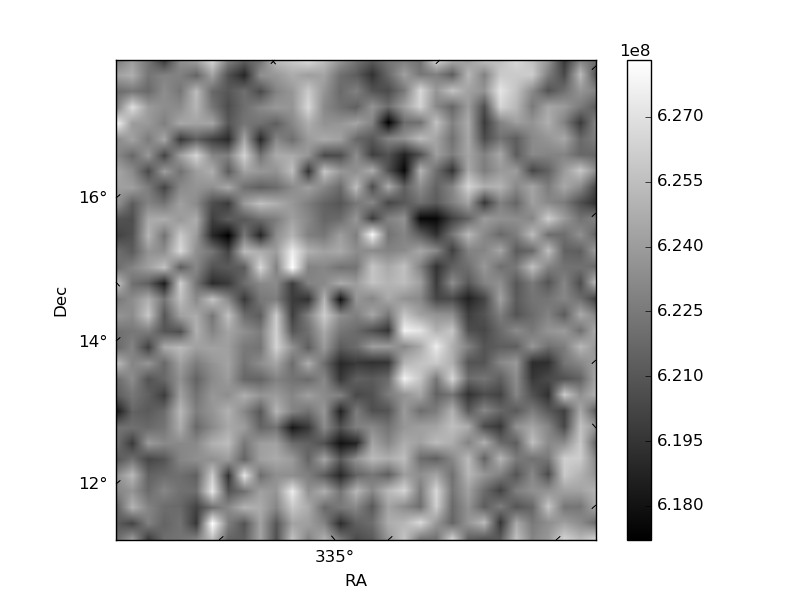
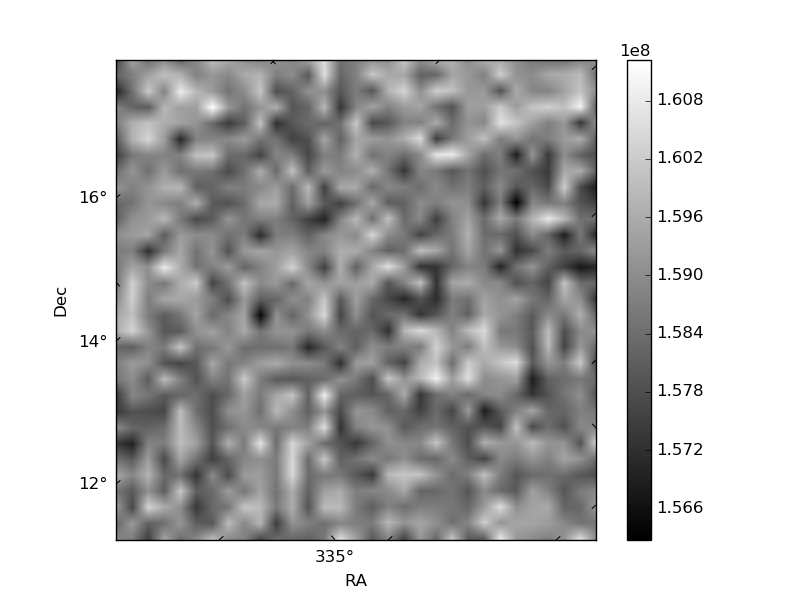
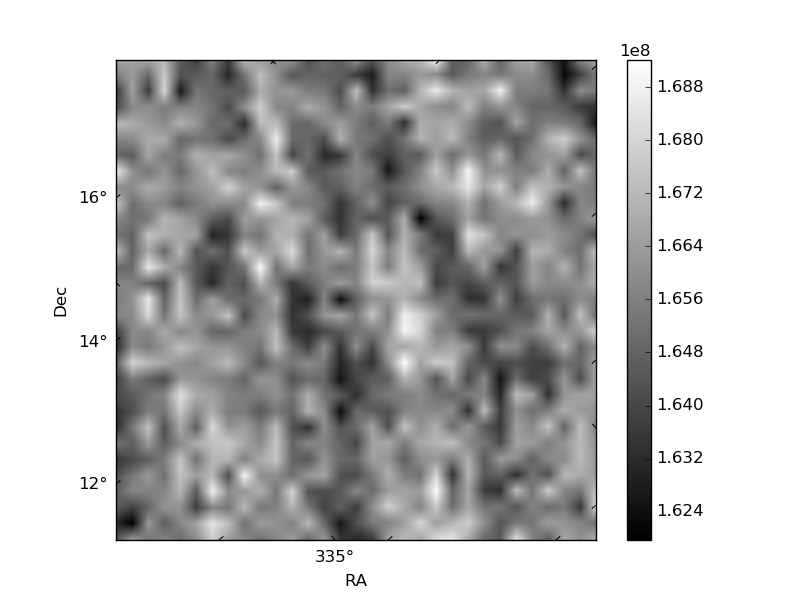
Histogram calculated using DETX and DETY for each event in the final _common_clean file
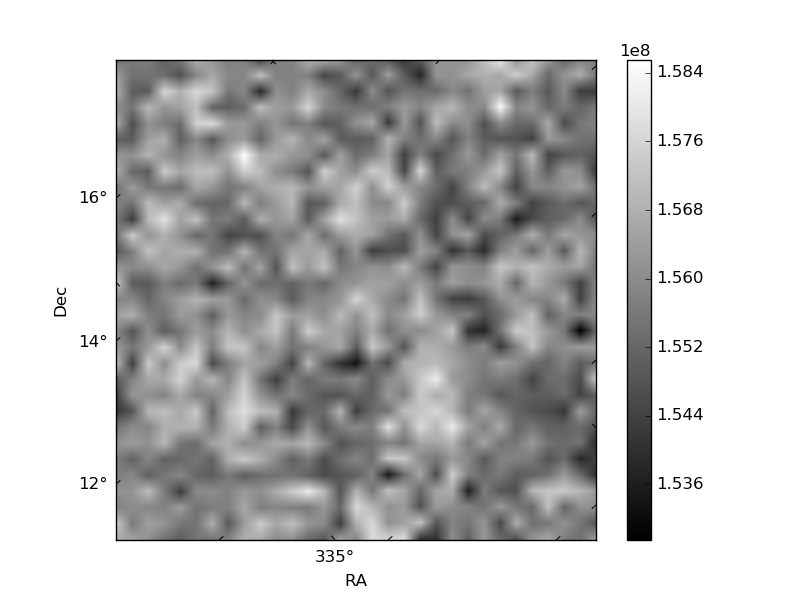
| Quadrant A | 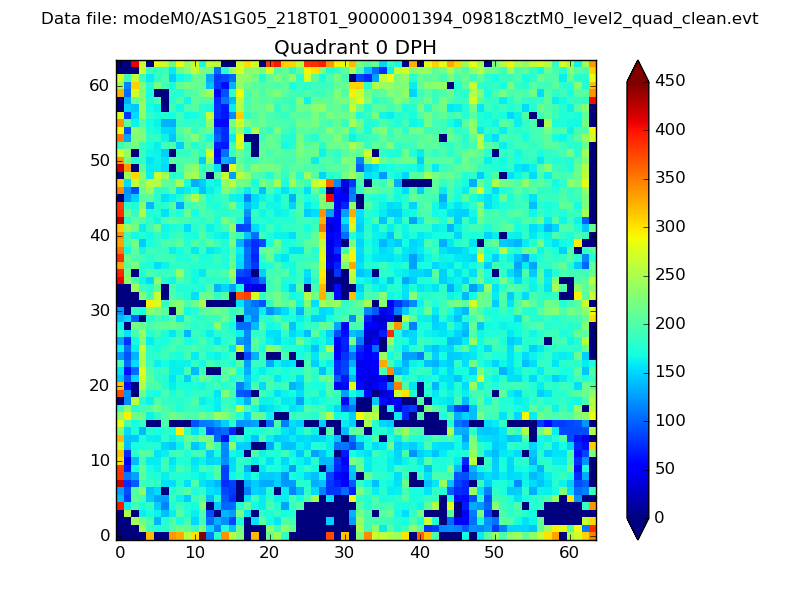 |
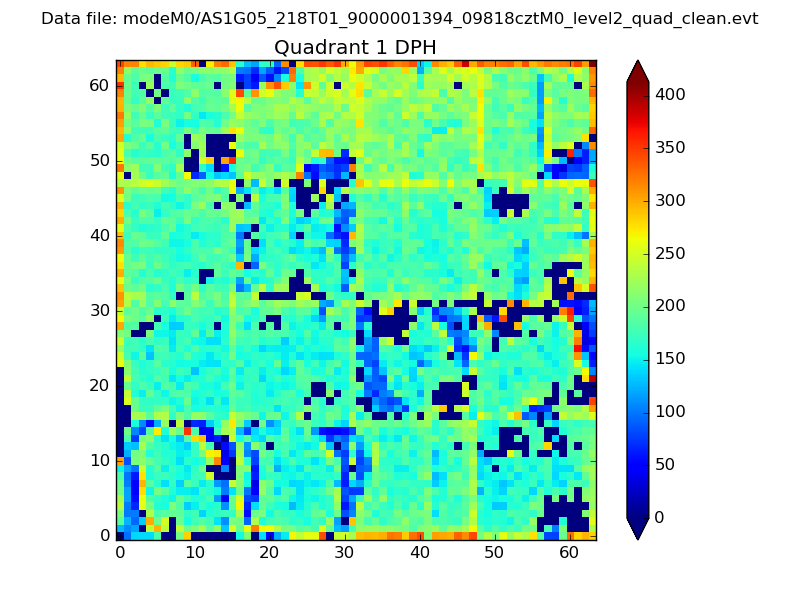 |
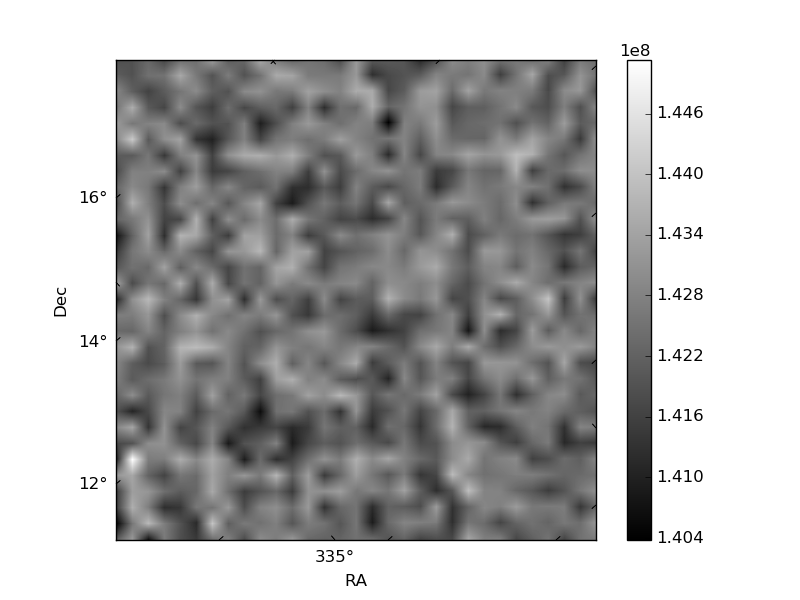
Quadrant B |
|---|---|---|---|
| Quadrant D |  |
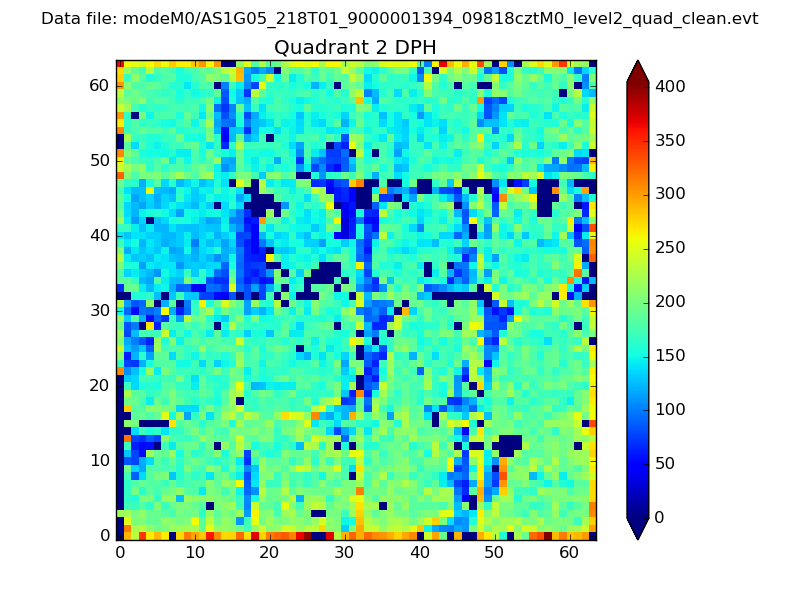 |
Quadrant C |
| Plot type | Count rate plots | Images |
|---|---|---|
| Comparison with Poisson distribution Blue bars denote a histogram of data divided into 1 sec bins. Red curve is a Poisson curve with rate = median count rate of data. |
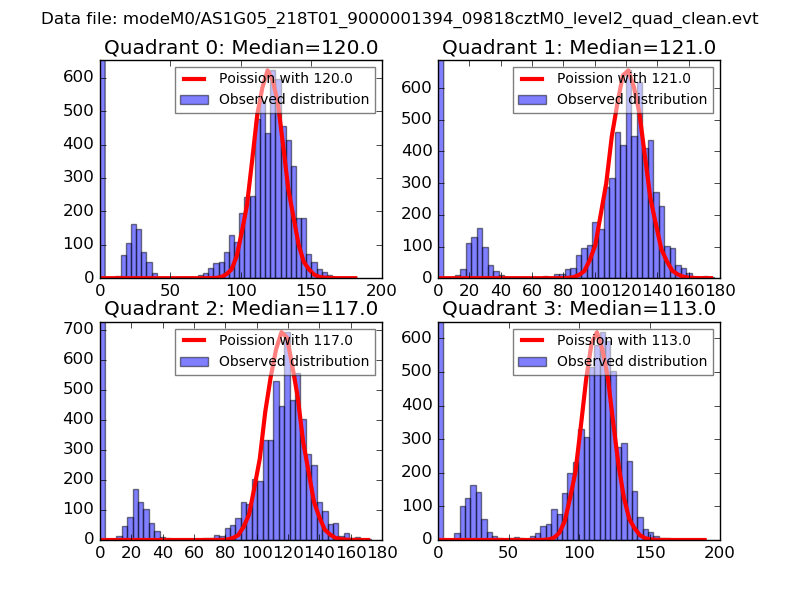 |
 |
| Quadrant-wise count rates Data is divided into 100 sec bins |
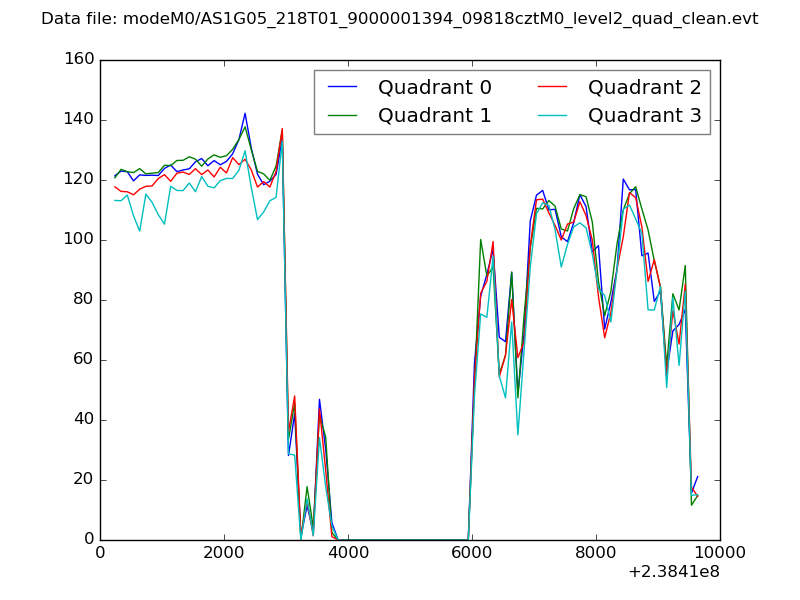 |
|
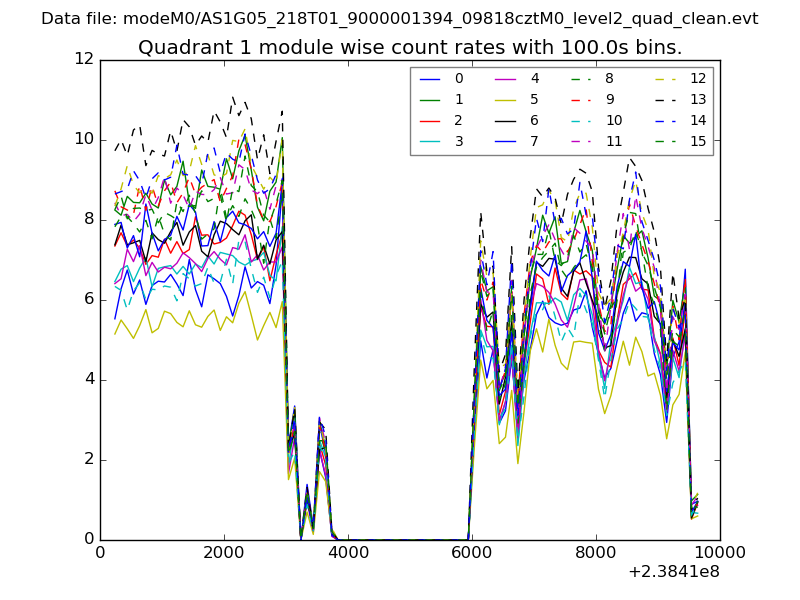
| Module-wise count rates for Quadrant A Data is divided into 100 sec bins |
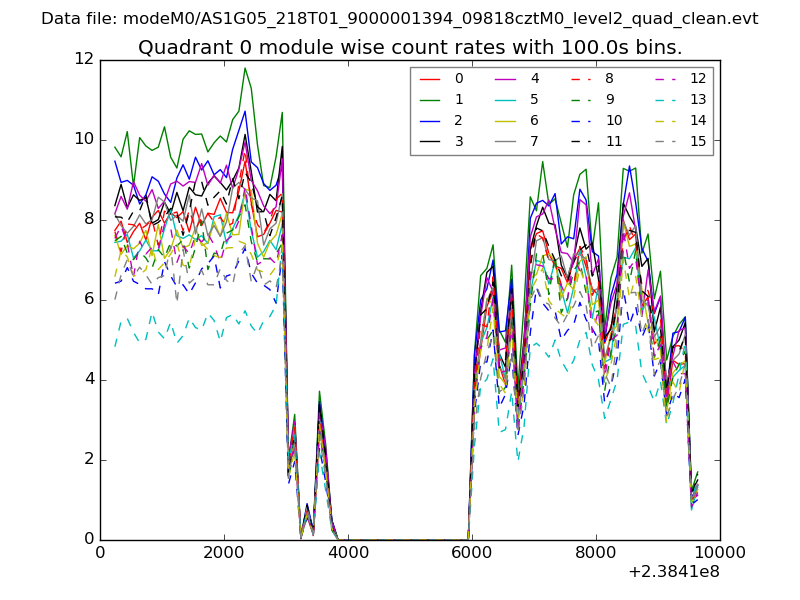 |
 |
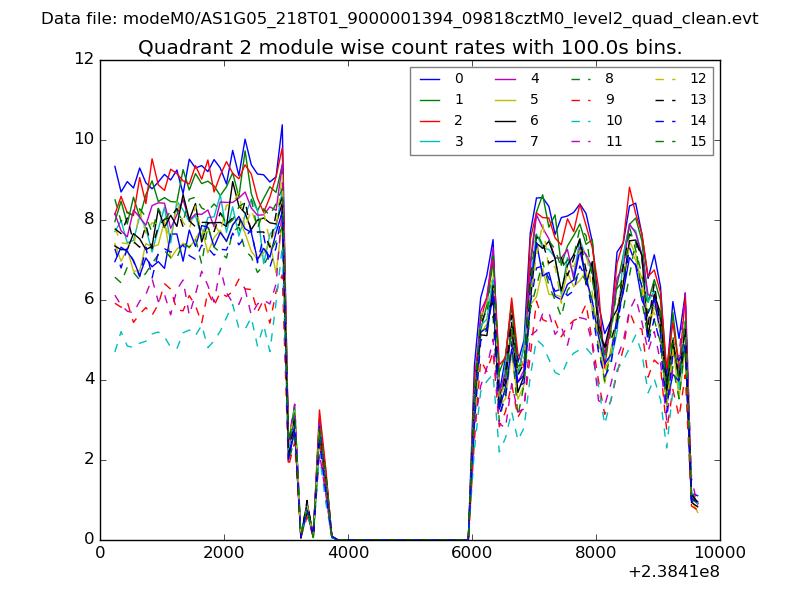
| Module-wise count rates for Quadrant B Data is divided into 100 sec bins |
 |
 |
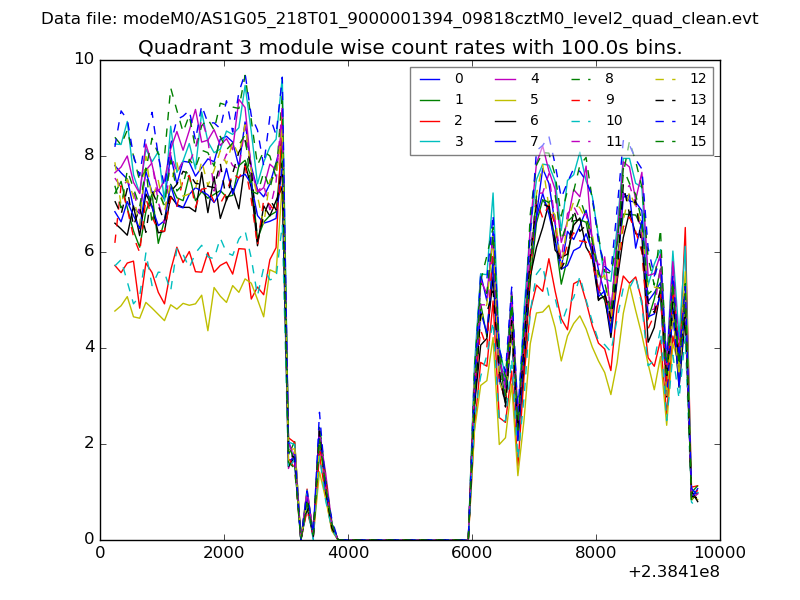
| Module-wise count rates for Quadrant C Data is divided into 100 sec bins |
 |
 |
| Module-wise count rates for Quadrant D Data is divided into 100 sec bins |
 |
 |
| Parameter | Plot |
|---|---|
| CZT HV Monitor | 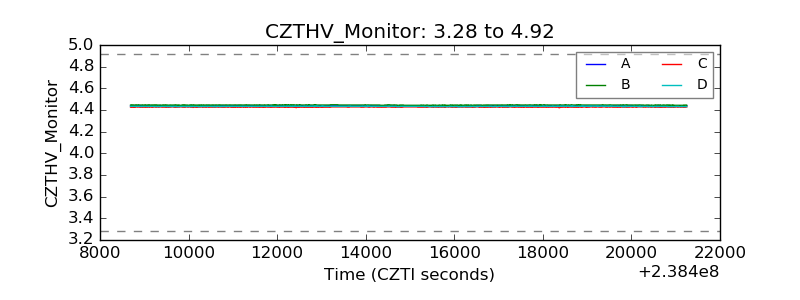 |
| D_VDD | 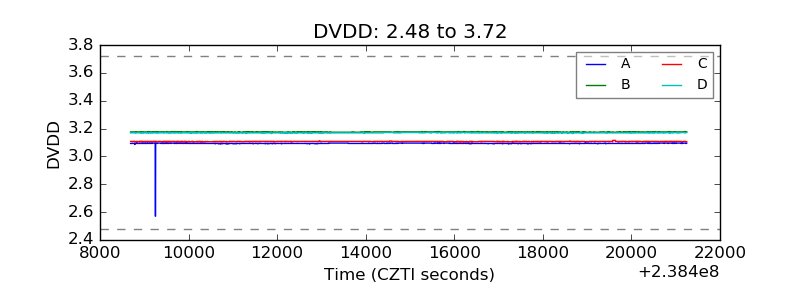 |
| Temperature 1 | 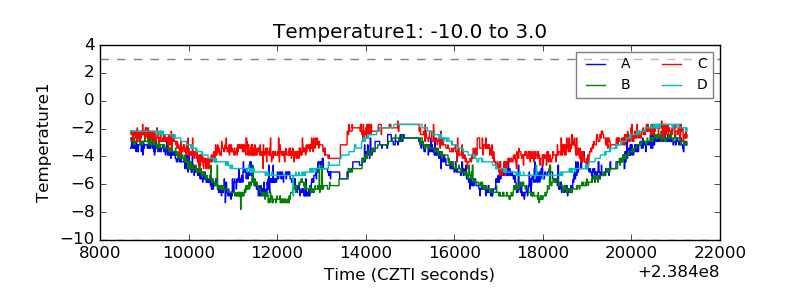 |
| Veto HV Monitor | 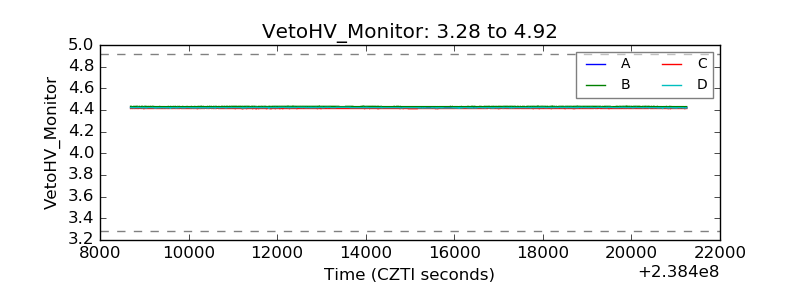 |
| Veto LLD |  |
| Alpha Counter | 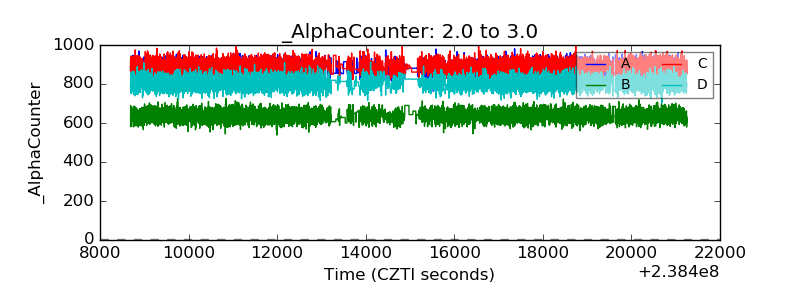 |
| _CPM_Rate | 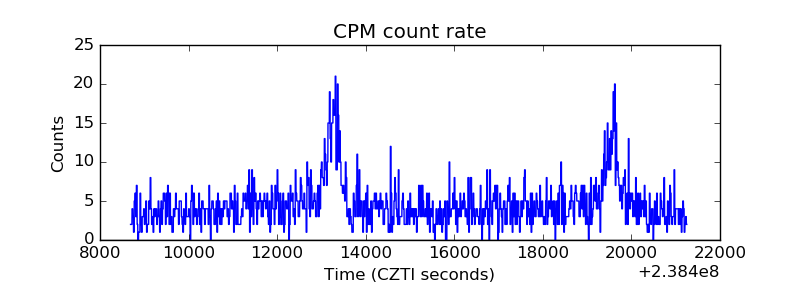 |
| CZT Counter | 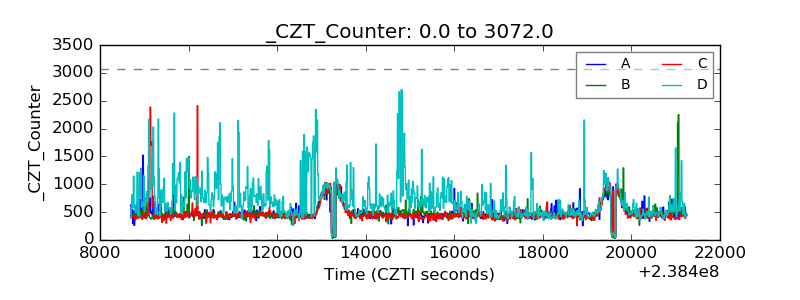 |
| +2.5 Volts monitor |  |
| +5 Volts monitor |  |
| _ROLL_ROT | 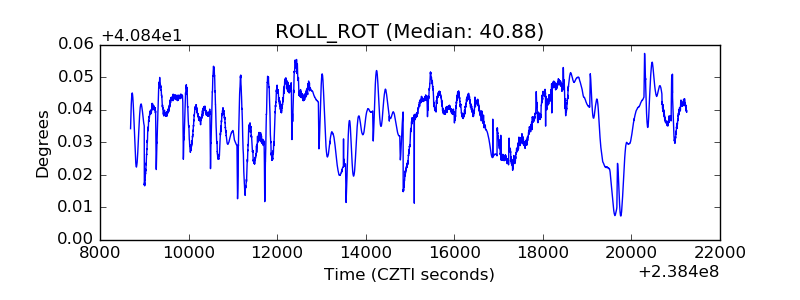 |
| _Roll_DEC | 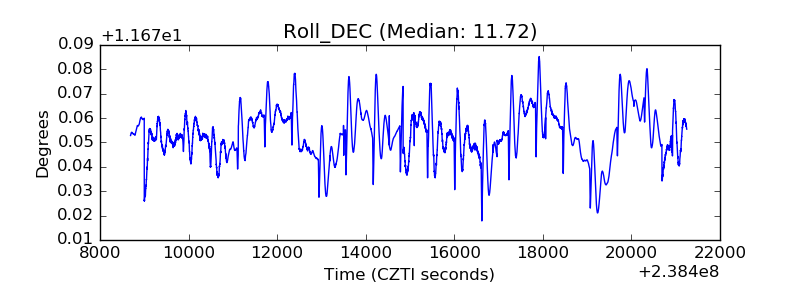 |
| _Roll_RA | 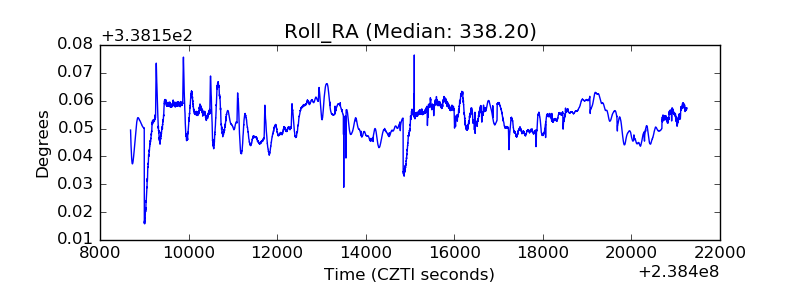 |
| Veto Counter | 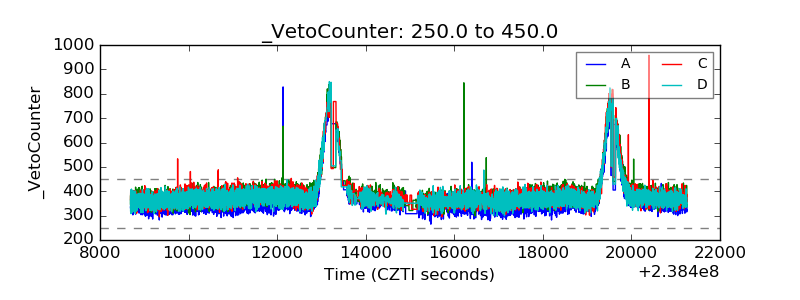 |