| Param | Original file | Final file |
|---|---|---|
| Filename | modeM0/AS1G07_020T01_9000001398cztM0_level2.fits | modeM0/AS1G07_020T01_9000001398cztM0_level2_quad_clean.evt |
| Size (bytes) | 877,348,800 | 786,813,120 |
| Size | 836.7 MB | 750.4 MB |
| Events in quadrant A | 5,297,440 | 4,563,837 |
| Events in quadrant B | 5,127,316 | 4,549,352 |
| Events in quadrant C | 5,262,436 | 4,406,560 |
| Events in quadrant D | 4,424,798 | 3,851,830 |
| Mode M0 | |||
|---|---|---|---|
| Quadrant | BADHDUFLAG | Total packets | Discarded packets |
| A | 0 | 194440 | 0 |
| B | 0 | 204203 | 0 |
| C | 0 | 194065 | 0 |
| D | 0 | 262775 | 0 |
| Mode SS | |||
|---|---|---|---|
| Quadrant | BADHDUFLAG | Total packets | Discarded packets |
| A | 0 | 1922 | 0 |
| B | 0 | 1916 | 0 |
| C | 0 | 1924 | 0 |
| D | 0 | 1922 | 0 |
| Mode M9 | |||
|---|---|---|---|
| Quadrant | BADHDUFLAG | Total packets | Discarded packets |
| A | 0 | 157 | 0 |
| B | 0 | 157 | 0 |
| C | 0 | 157 | 0 |
| D | 0 | 156 | 0 |
| Quadrant | Total seconds | Saturated seconds | Saturation percentage |
|---|---|---|---|
| A | 94297 | 1103 | 1.169708% |
| B | 94071 | 1593 | 1.693402% |
| C | 94274 | 821 | 0.870866% |
| D | 94085 | 3699 | 3.931551% |
Noise dominated data is calculated using 1-second bins in cleaned event files. If a bin has >2000 counts, and if more than 50% of those come from <1% of pixels, then it is considered to be noise-dominated and hence unusable.
| Quadrant | # 1 sec bins | Bins with >0 counts | Bins with >2000 counts | High rate bins dominated by noise | Noise dominated (total time) | Noise dominated (detector-on time) | Marked lightcurve |
|---|---|---|---|---|---|---|---|
| A | 111006 | 94868 | 0 | 0 | 0.00% | 0.00% |  |
| B | 111006 | 94719 | 0 | 0 | 0.00% | 0.00% |  |
| C | 111006 | 94882 | 0 | 0 | 0.00% | 0.00% |  |
| D | 111006 | 94758 | 0 | 0 | 0.00% | 0.00% |  |
Top three noisy pixels from each quadrant. If the there are fewer than three noisy pixels in the level2.evt file, extra rows are filled as -1
| Pixel properties | Quadrant properties | ||||||
|---|---|---|---|---|---|---|---|
| Quadrant | DetID | PixID | Counts | Sigma | Mean | Median | Sigma |
| A | 0 | 29 | 4985 | 10.7 | 1375 | 1283 | 346.0 |
| A | 7 | 110 | 4398 | 9.0 | 1375 | 1283 | 346.0 |
| A | 0 | 30 | 3928 | 7.64 | 1375 | 1283 | 346.0 |
| B | 2 | 9 | 4411 | 11.59 | 1353 | 1285 | 269.8 |
| B | 12 | 226 | 3474 | 8.11 | 1353 | 1285 | 269.8 |
| B | 5 | 128 | 3413 | 7.89 | 1353 | 1285 | 269.8 |
| C | 12 | 241 | 3847 | 7.02 | 1389 | 1287 | 364.8 |
| C | 1 | 80 | 3843 | 7.01 | 1389 | 1287 | 364.8 |
| C | 1 | 81 | 3774 | 6.82 | 1389 | 1287 | 364.8 |
| D | 6 | 231 | 3273 | 6.28 | 1262 | 1143 | 339.4 |
| D | 10 | 189 | 3116 | 5.81 | 1262 | 1143 | 339.4 |
| D | 7 | 3 | 3108 | 5.79 | 1262 | 1143 | 339.4 |
Histogram calculated using DETX and DETY for each event in the final _common_clean file
| Quadrant A | 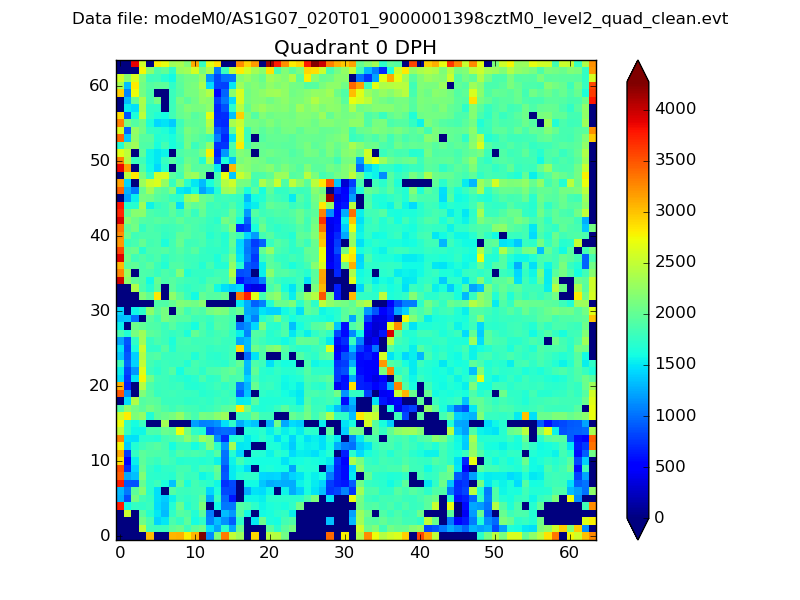 |
 |
Quadrant B |
|---|---|---|---|
| Quadrant D |  |
 |
Quadrant C |
| Plot type | Count rate plots | Images |
|---|---|---|
| Comparison with Poisson distribution Blue bars denote a histogram of data divided into 1 sec bins. Red curve is a Poisson curve with rate = median count rate of data. |
 |
 |
| Quadrant-wise count rates Data is divided into 100 sec bins |
 |
|
| Module-wise count rates for Quadrant A Data is divided into 100 sec bins |
 |
 |
| Module-wise count rates for Quadrant B Data is divided into 100 sec bins |
 |
 |
| Module-wise count rates for Quadrant C Data is divided into 100 sec bins |
 |
 |
| Module-wise count rates for Quadrant D Data is divided into 100 sec bins |
 |
 |
| Parameter | Plot |
|---|---|
| CZT HV Monitor |  |
| D_VDD |  |
| Temperature 1 |  |
| Veto HV Monitor |  |
| Veto LLD |  |
| Alpha Counter |  |
| _CPM_Rate |  |
| CZT Counter |  |
| +2.5 Volts monitor |  |
| +5 Volts monitor |  |
| _ROLL_ROT |  |
| _Roll_DEC |  |
| _Roll_RA |  |
| Veto Counter |  |