| Param | Original file | Final file |
|---|---|---|
| Filename | modeM0/AS1G07_020T01_9000001398_09822cztM0_level2.evt | modeM0/AS1G07_020T01_9000001398_09822cztM0_level2_quad_clean.evt |
| Size (bytes) | 662,572,800 | 92,983,680 |
| Size | 631.9 MB | 88.7 MB |
| Events in quadrant A | 3,969,913 | 576,127 |
| Events in quadrant B | 4,910,214 | 549,042 |
| Events in quadrant C | 3,894,593 | 576,367 |
| Events in quadrant D | 6,710,615 | 518,782 |
| Mode M0 | |||
|---|---|---|---|
| Quadrant | BADHDUFLAG | Total packets | Discarded packets |
| A | 0 | 18371 | 685 |
| B | 0 | 22516 | 2371 |
| C | 0 | 18268 | 687 |
| D | 0 | 27610 | 1828 |
| Mode SS | |||
|---|---|---|---|
| Quadrant | BADHDUFLAG | Total packets | Discarded packets |
| A | 0 | 184 | 0 |
| B | 0 | 184 | 8 |
| C | 0 | 184 | 8 |
| D | 0 | 184 | 6 |
| Mode M9 | |||
|---|---|---|---|
| Quadrant | BADHDUFLAG | Total packets | Discarded packets |
| A | 0 | 16 | 0 |
| B | 0 | 16 | 0 |
| C | 0 | 16 | 0 |
| D | 0 | 16 | 0 |
| Quadrant | Total seconds | Saturated seconds | Saturation percentage |
|---|---|---|---|
| A | 8631 | 58 | 0.671996% |
| B | 8471 | 207 | 2.443631% |
| C | 8631 | 30 | 0.347584% |
| D | 8494 | 253 | 2.978573% |
Noise dominated data is calculated using 1-second bins in cleaned event files. If a bin has >2000 counts, and if more than 50% of those come from <1% of pixels, then it is considered to be noise-dominated and hence unusable.
| Quadrant | # 1 sec bins | Bins with >0 counts | Bins with >2000 counts | High rate bins dominated by noise | Noise dominated (total time) | Noise dominated (detector-on time) | Marked lightcurve |
|---|---|---|---|---|---|---|---|
| A | 10631 | 8899 | 0 | 0 | 0.00% | 0.00% | 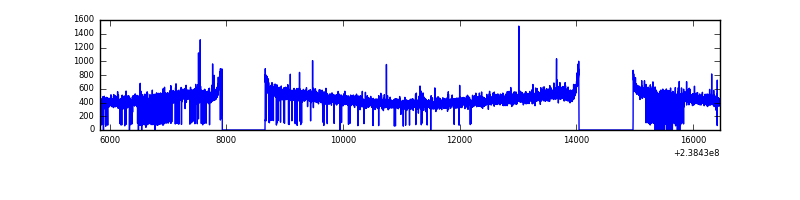 |
| B | 10631 | 8761 | 44 | 44 | 0.41% | 0.50% | 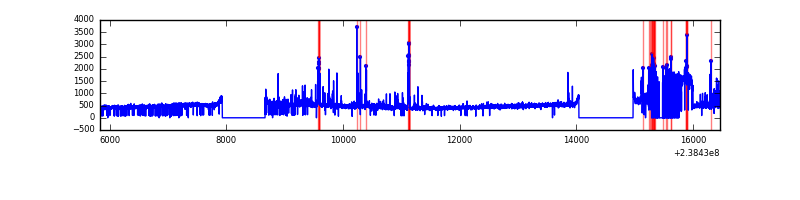 |
| C | 10631 | 8903 | 1 | 1 | 0.01% | 0.01% | 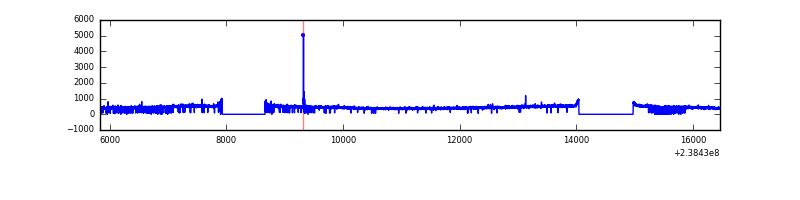 |
| D | 10631 | 8816 | 177 | 177 | 1.66% | 2.01% | 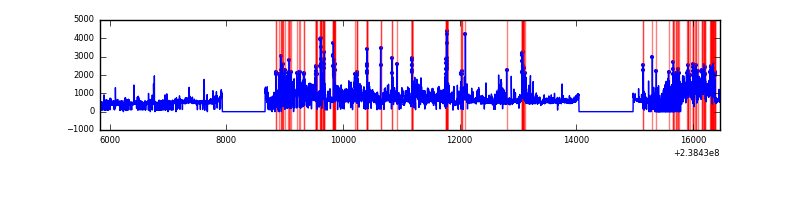 |
Top three noisy pixels from each quadrant. If the there are fewer than three noisy pixels in the level2.evt file, extra rows are filled as -1
| Pixel properties | Quadrant properties | ||||||
|---|---|---|---|---|---|---|---|
| Quadrant | DetID | PixID | Counts | Sigma | Mean | Median | Sigma |
| A | 0 | 226 | 9470 | 40.33 | 1025 | 1003 | 210.0 |
| A | 15 | 174 | 8510 | 35.76 | 1025 | 1003 | 210.0 |
| A | 12 | 194 | 8452 | 35.48 | 1025 | 1003 | 210.0 |
| B | 4 | 173 | 518971 | 2685.31 | 1004 | 979 | 192.9 |
| B | 4 | 239 | 162951 | 839.68 | 1004 | 979 | 192.9 |
| B | 0 | 85 | 134633 | 692.87 | 1004 | 979 | 192.9 |
| C | 14 | 234 | 10180 | 39.54 | 994 | 998 | 232.2 |
| C | 13 | 61 | 7541 | 28.18 | 994 | 998 | 232.2 |
| C | 12 | 4 | 3629 | 11.33 | 994 | 998 | 232.2 |
| D | 5 | 113 | 2043727 | 8774.31 | 959 | 934 | 232.8 |
| D | 1 | 52 | 388569 | 1664.99 | 959 | 934 | 232.8 |
| D | 2 | 152 | 282221 | 1208.2 | 959 | 934 | 232.8 |
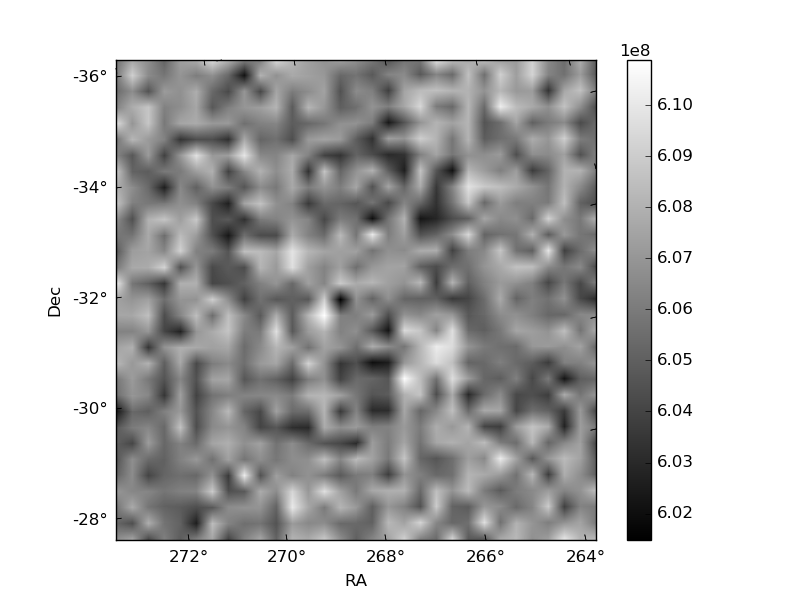
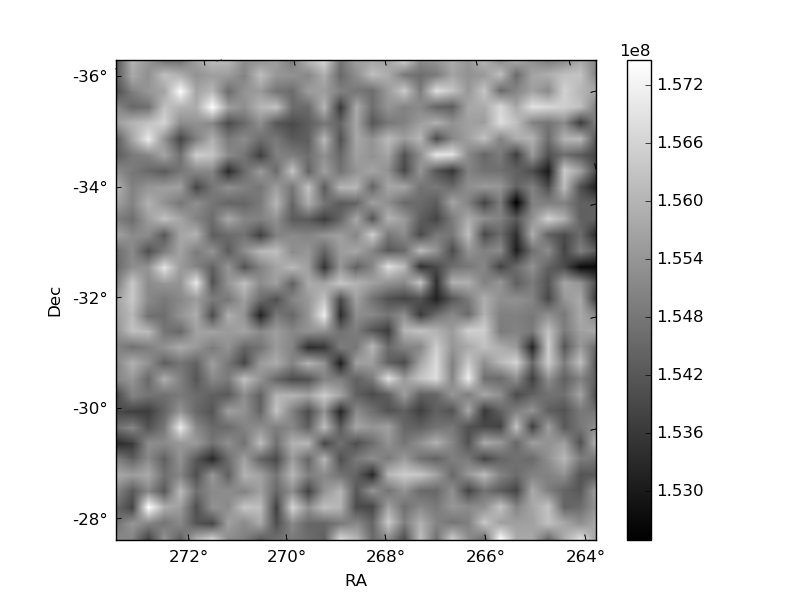
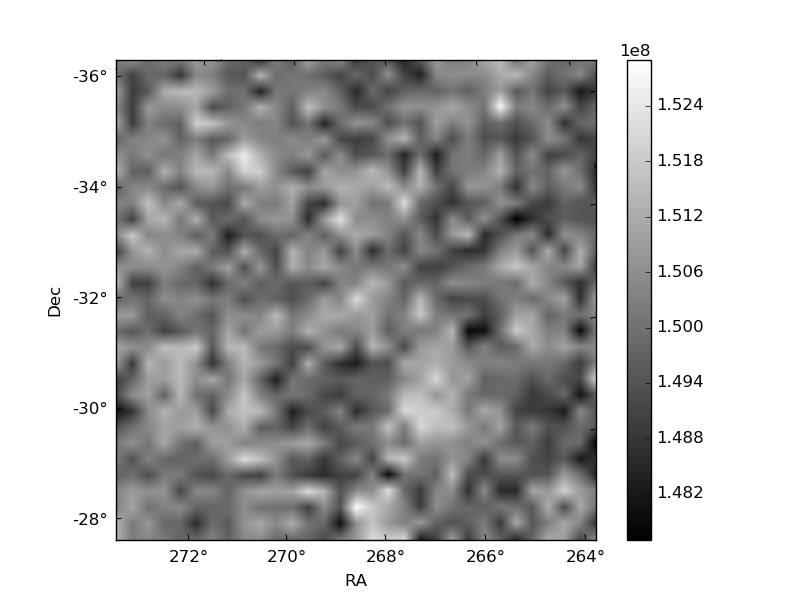
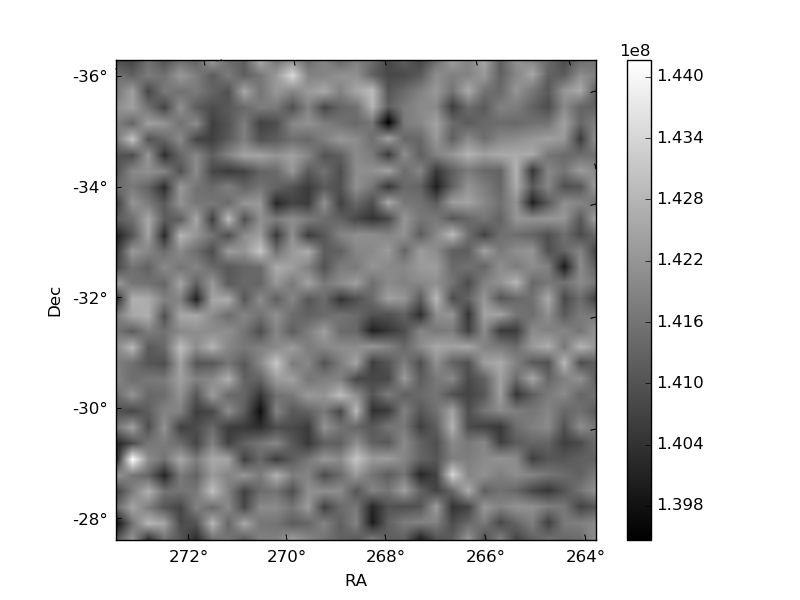
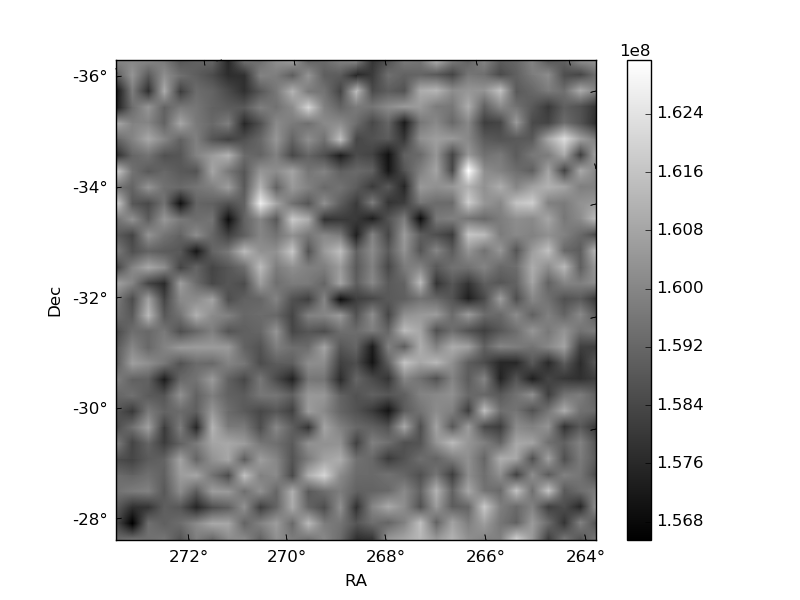
Histogram calculated using DETX and DETY for each event in the final _common_clean file
| Quadrant A | 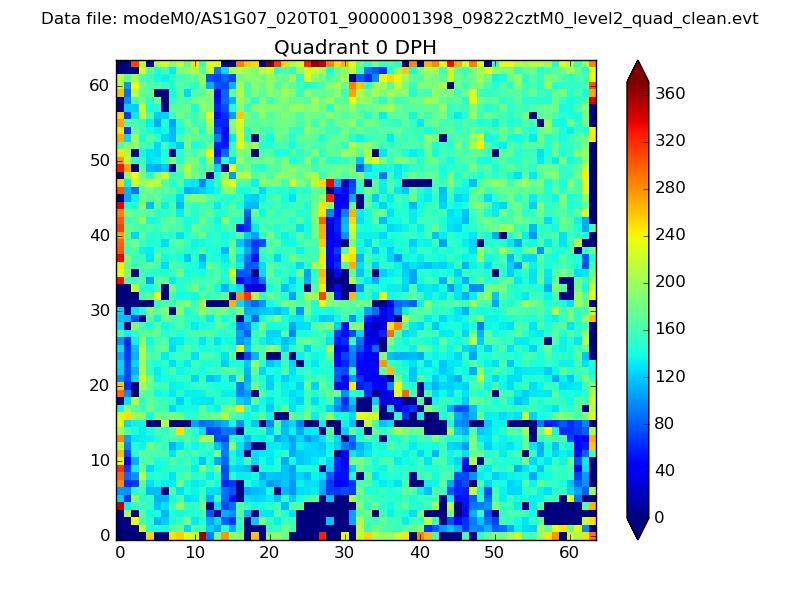 |
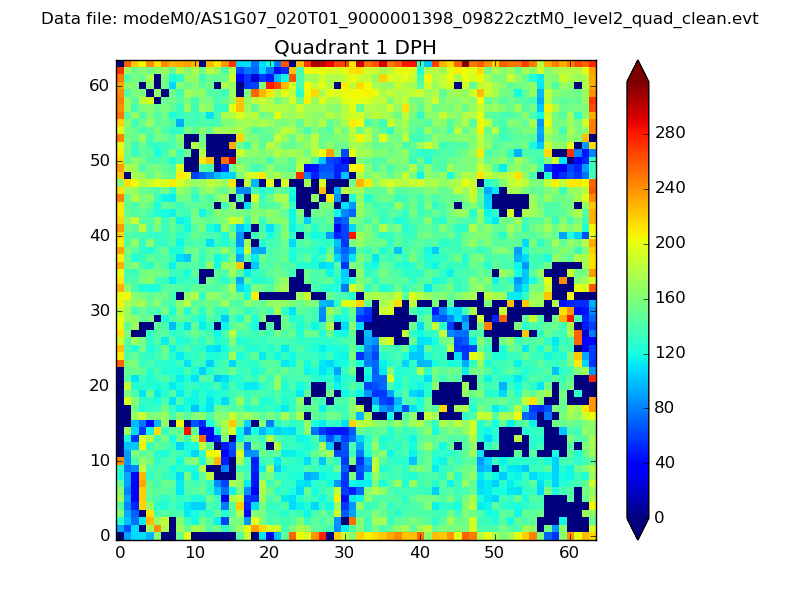 |
Quadrant B |
|---|---|---|---|
| Quadrant D |  |
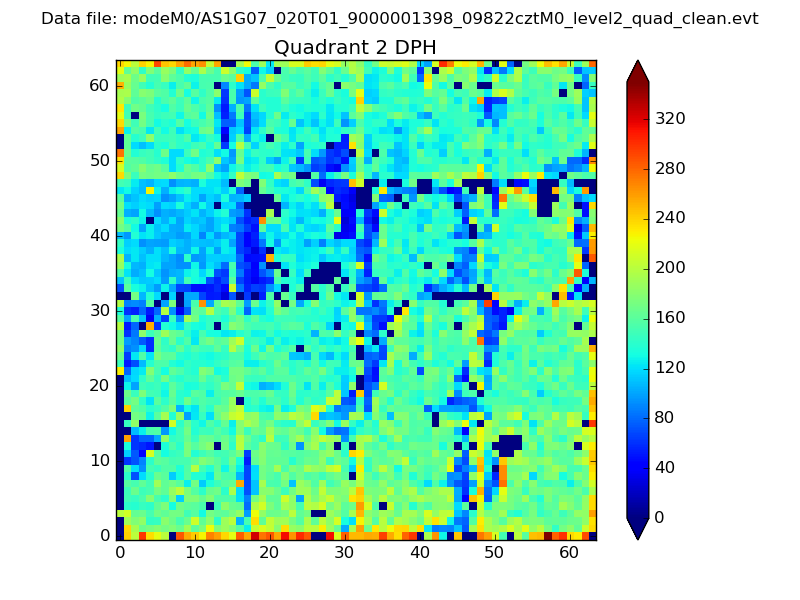 |
Quadrant C |
| Plot type | Count rate plots | Images |
|---|---|---|
| Comparison with Poisson distribution Blue bars denote a histogram of data divided into 1 sec bins. Red curve is a Poisson curve with rate = median count rate of data. |
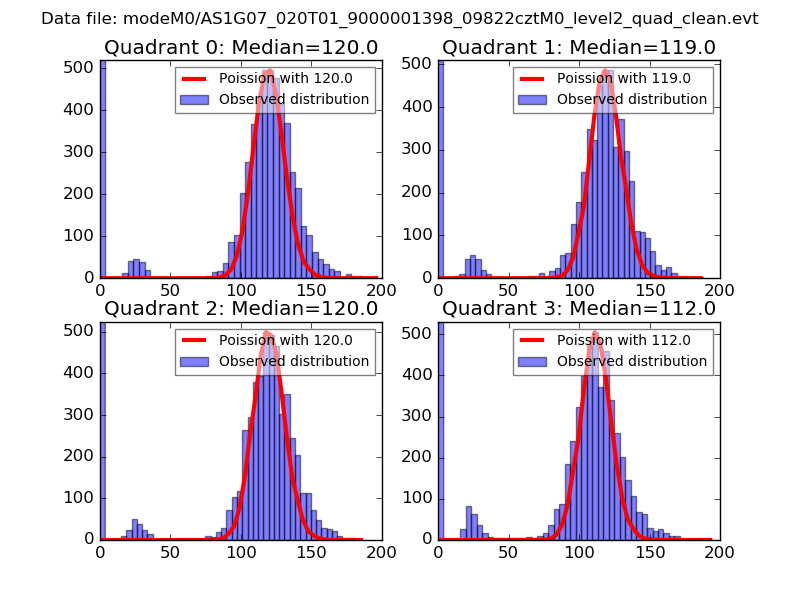 |
 |
| Quadrant-wise count rates Data is divided into 100 sec bins |
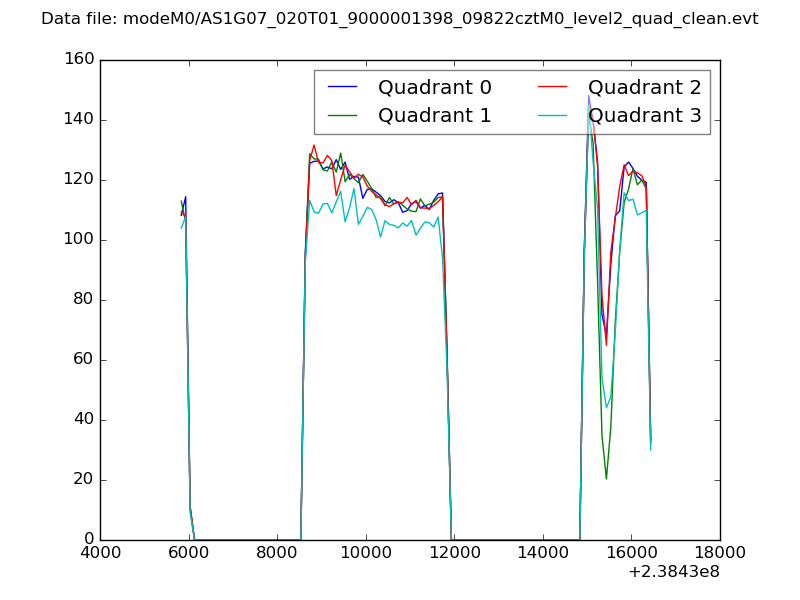 |
|
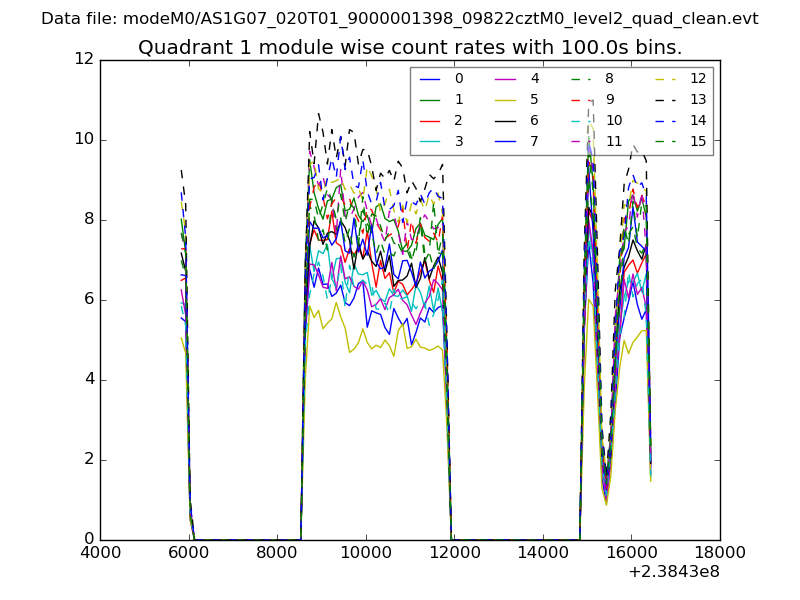
| Module-wise count rates for Quadrant A Data is divided into 100 sec bins |
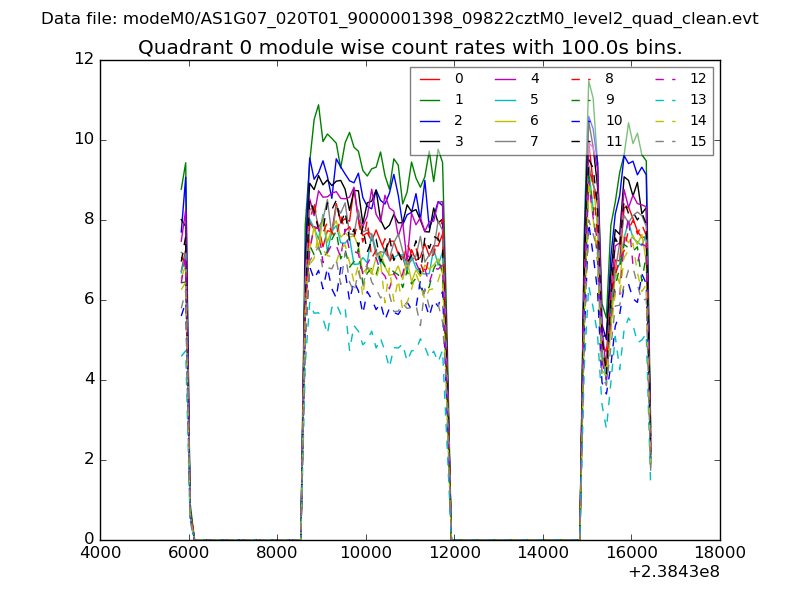 |
 |
| Module-wise count rates for Quadrant B Data is divided into 100 sec bins |
 |
 |
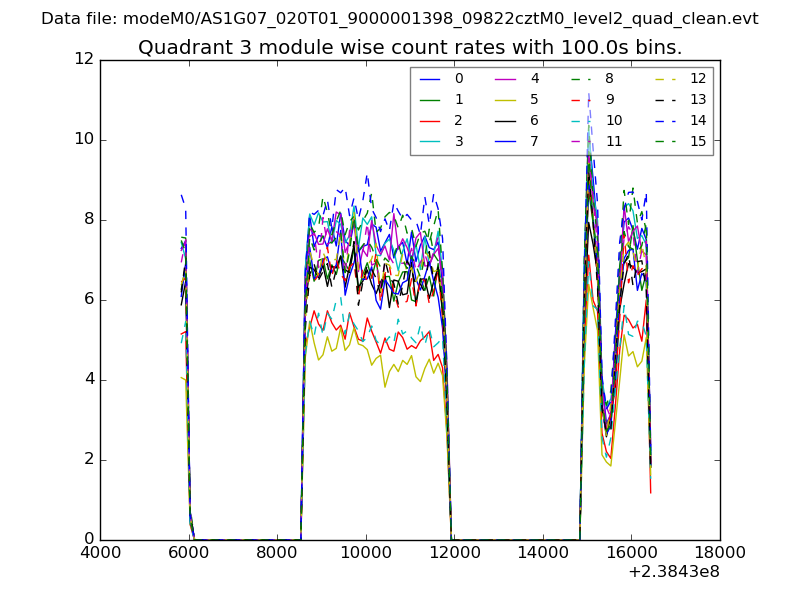
| Module-wise count rates for Quadrant C Data is divided into 100 sec bins |
 |
 |
| Module-wise count rates for Quadrant D Data is divided into 100 sec bins |
 |
 |
| Parameter | Plot |
|---|---|
| CZT HV Monitor | 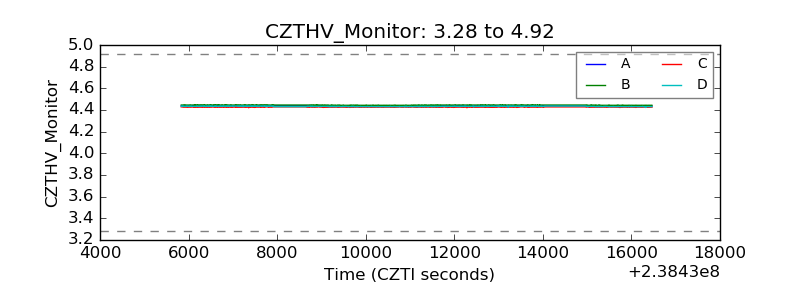 |
| D_VDD | 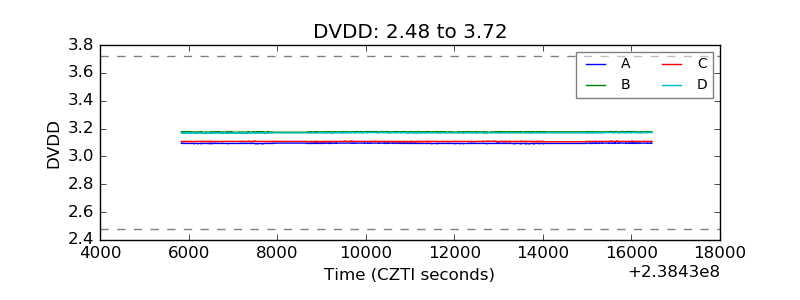 |
| Temperature 1 | 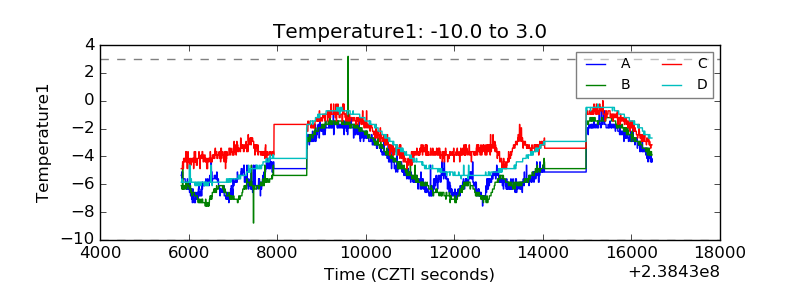 |
| Veto HV Monitor | 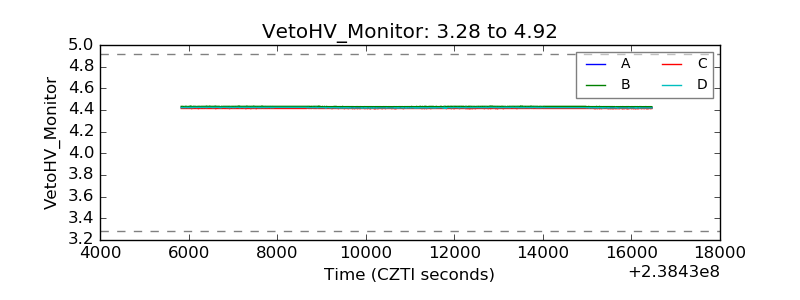 |
| Veto LLD | 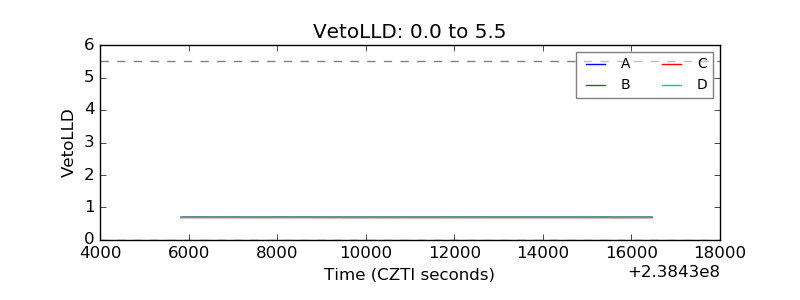 |
| Alpha Counter | 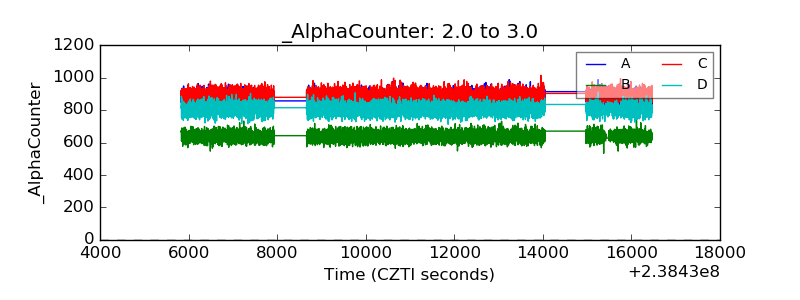 |
| _CPM_Rate | 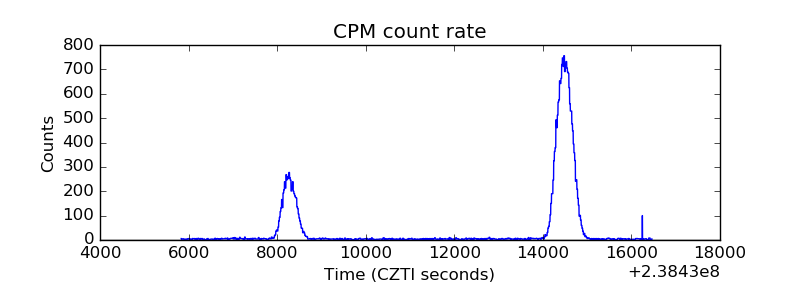 |
| CZT Counter | 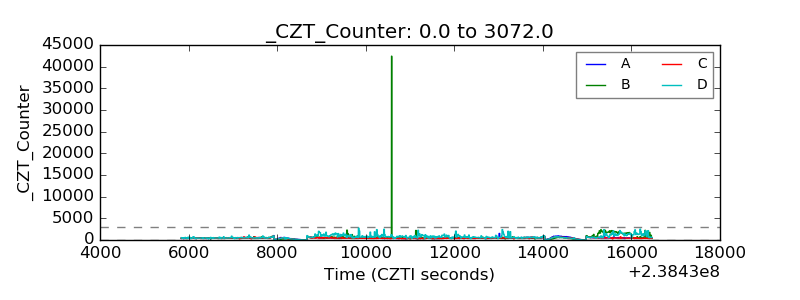 |
| +2.5 Volts monitor |  |
| +5 Volts monitor | 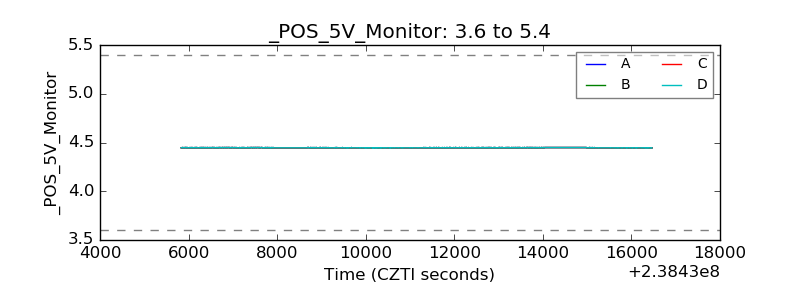 |
| _ROLL_ROT | 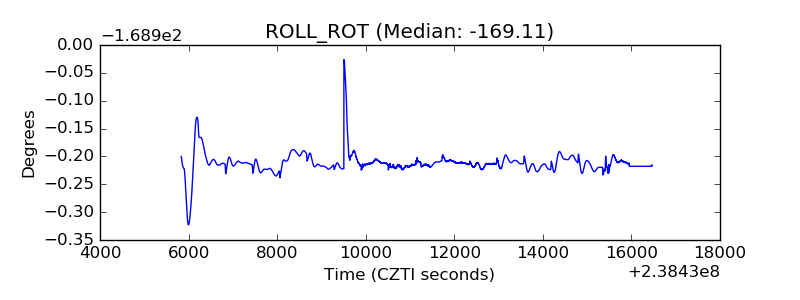 |
| _Roll_DEC | 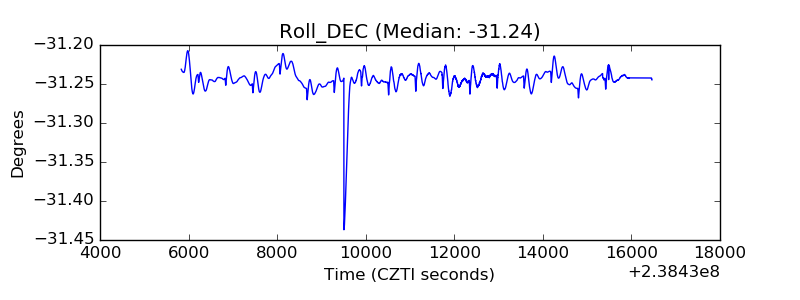 |
| _Roll_RA | 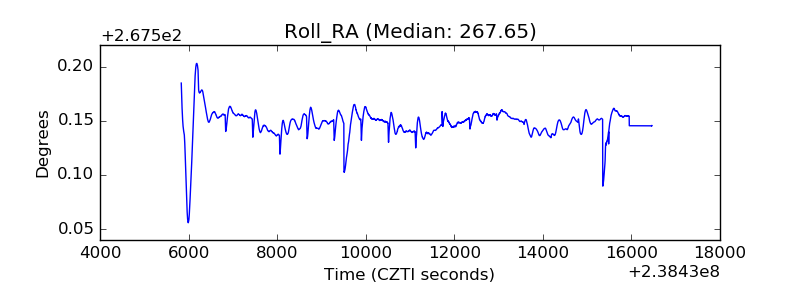 |
| Veto Counter | 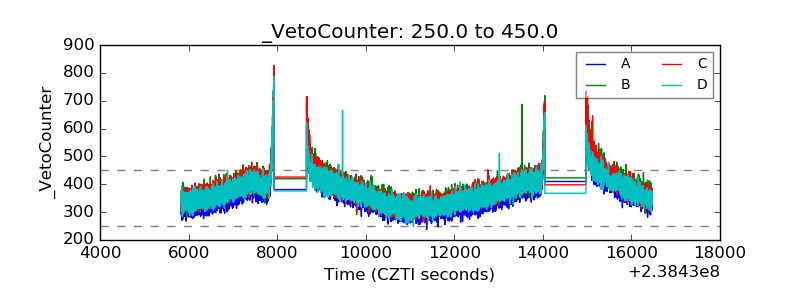 |