| Param | Original file | Final file |
|---|---|---|
| Filename | modeM0/AS1G07_020T01_9000001398_09825cztM0_level2.evt | modeM0/AS1G07_020T01_9000001398_09825cztM0_level2_quad_clean.evt |
| Size (bytes) | 531,881,280 | 87,353,280 |
| Size | 507.2 MB | 83.3 MB |
| Events in quadrant A | 3,081,811 | 563,455 |
| Events in quadrant B | 3,402,030 | 575,850 |
| Events in quadrant C | 2,897,680 | 564,809 |
| Events in quadrant D | 6,294,668 | 496,362 |
| Mode M0 | |||
|---|---|---|---|
| Quadrant | BADHDUFLAG | Total packets | Discarded packets |
| A | 0 | 13415 | 5 |
| B | 0 | 14367 | 10 |
| C | 0 | 13009 | 7 |
| D | 0 | 23241 | 29 |
| Mode SS | |||
|---|---|---|---|
| Quadrant | BADHDUFLAG | Total packets | Discarded packets |
| A | 0 | 130 | 0 |
| B | 0 | 130 | 0 |
| C | 0 | 130 | 0 |
| D | 0 | 130 | 0 |
| Mode M9 | |||
|---|---|---|---|
| Quadrant | BADHDUFLAG | Total packets | Discarded packets |
| A | 0 | 14 | 0 |
| B | 0 | 14 | 0 |
| C | 0 | 14 | 0 |
| D | 0 | 15 | 0 |
| Quadrant | Total seconds | Saturated seconds | Saturation percentage |
|---|---|---|---|
| A | 6373 | 20 | 0.313824% |
| B | 6371 | 79 | 1.239994% |
| C | 6372 | 4 | 0.062775% |
| D | 6368 | 432 | 6.783920% |
Noise dominated data is calculated using 1-second bins in cleaned event files. If a bin has >2000 counts, and if more than 50% of those come from <1% of pixels, then it is considered to be noise-dominated and hence unusable.
| Quadrant | # 1 sec bins | Bins with >0 counts | Bins with >2000 counts | High rate bins dominated by noise | Noise dominated (total time) | Noise dominated (detector-on time) | Marked lightcurve |
|---|---|---|---|---|---|---|---|
| A | 7559 | 6375 | 7 | 7 | 0.09% | 0.11% | 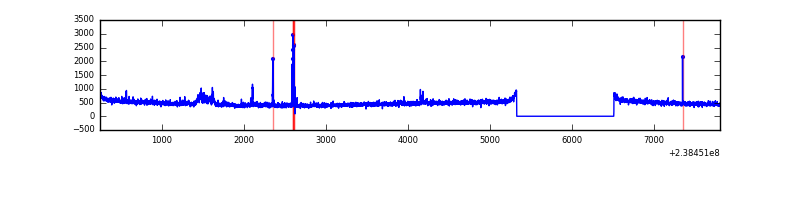 |
| B | 7559 | 6375 | 23 | 23 | 0.30% | 0.36% | 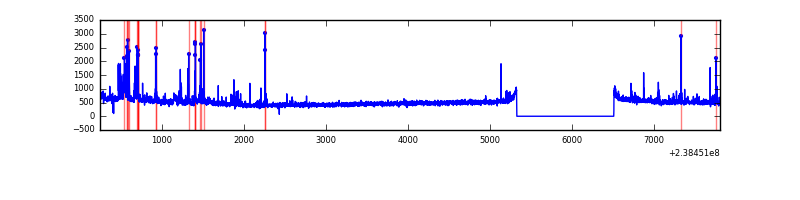 |
| C | 7559 | 6375 | 0 | 0 | 0.00% | 0.00% | 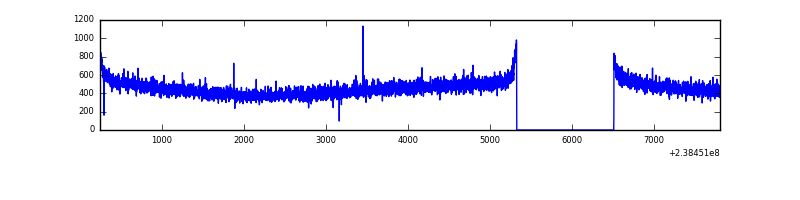 |
| D | 7559 | 6374 | 338 | 338 | 4.47% | 5.30% | 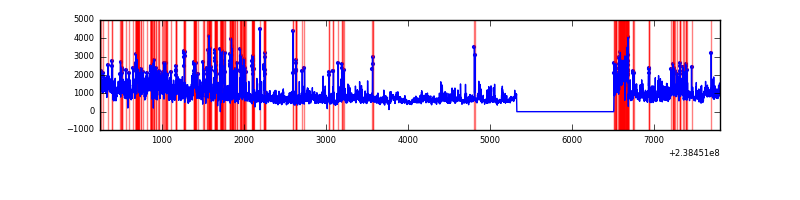 |
Top three noisy pixels from each quadrant. If the there are fewer than three noisy pixels in the level2.evt file, extra rows are filled as -1
| Pixel properties | Quadrant properties | ||||||
|---|---|---|---|---|---|---|---|
| Quadrant | DetID | PixID | Counts | Sigma | Mean | Median | Sigma |
| A | 8 | 15 | 74564 | 477.61 | 764 | 750 | 154.5 |
| A | 14 | 111 | 39523 | 250.88 | 764 | 750 | 154.5 |
| A | 15 | 174 | 14375 | 88.16 | 764 | 750 | 154.5 |
| B | 4 | 239 | 148864 | 1019.34 | 773 | 756 | 145.3 |
| B | 12 | 0 | 79539 | 542.22 | 773 | 756 | 145.3 |
| B | 4 | 48 | 55560 | 377.19 | 773 | 756 | 145.3 |
| C | 13 | 61 | 5693 | 28.67 | 741 | 745 | 172.6 |
| C | 12 | 4 | 4251 | 20.32 | 741 | 745 | 172.6 |
| C | 10 | 22 | 2990 | 13.01 | 741 | 745 | 172.6 |
| D | 5 | 113 | 2110306 | 11891.95 | 708 | 691 | 177.4 |
| D | 7 | 71 | 371774 | 2091.8 | 708 | 691 | 177.4 |
| D | 2 | 152 | 324704 | 1826.47 | 708 | 691 | 177.4 |
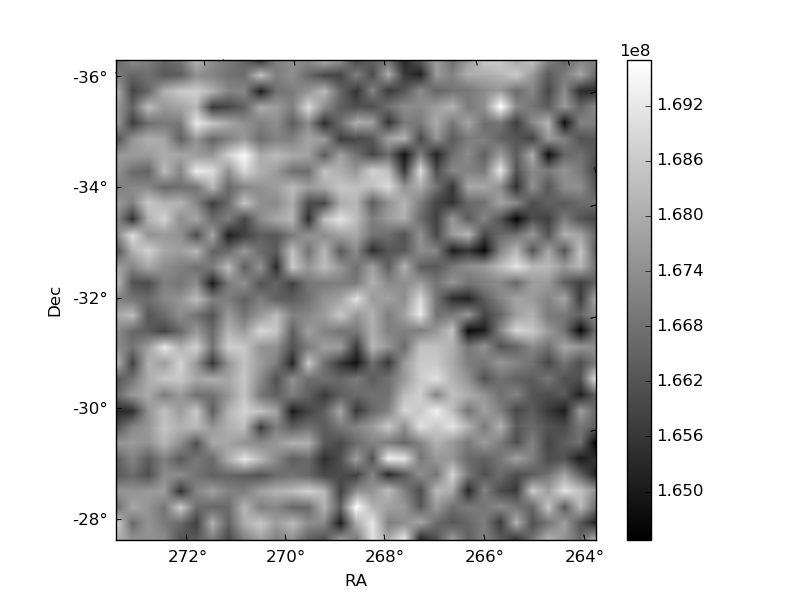
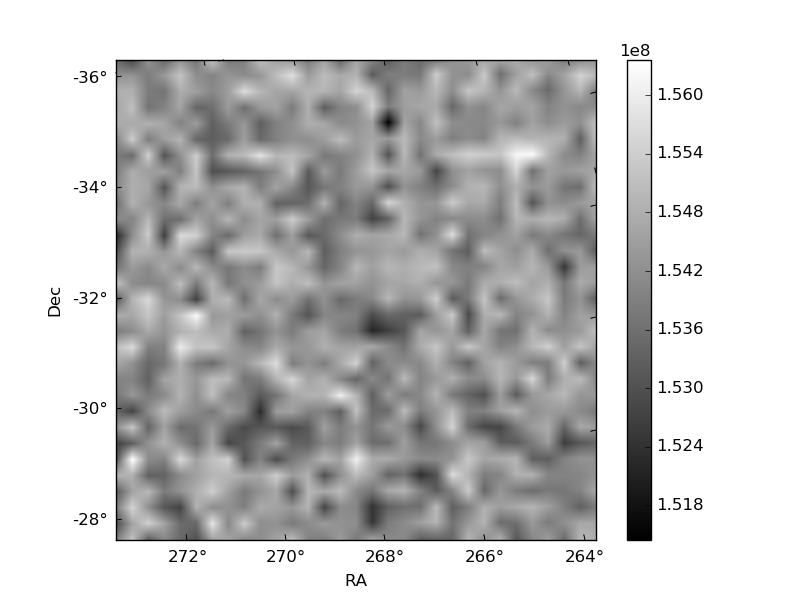
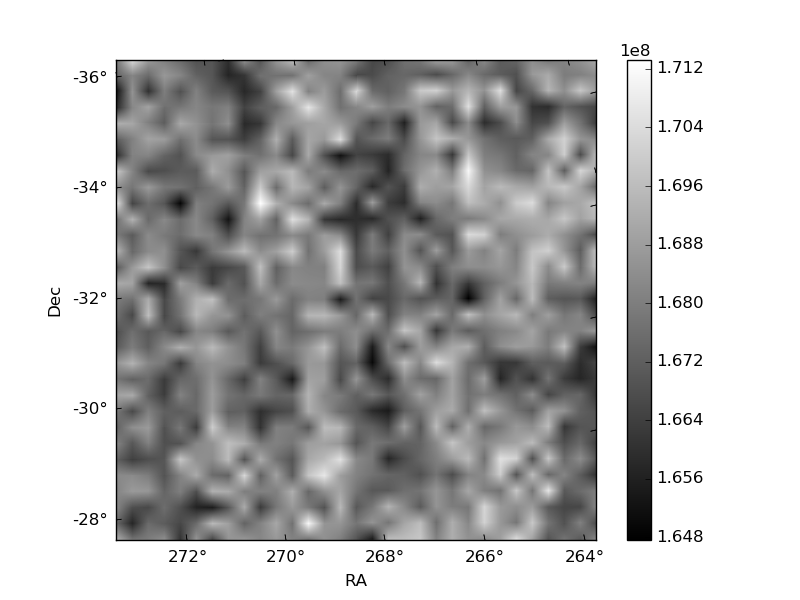
Histogram calculated using DETX and DETY for each event in the final _common_clean file
| Quadrant A | 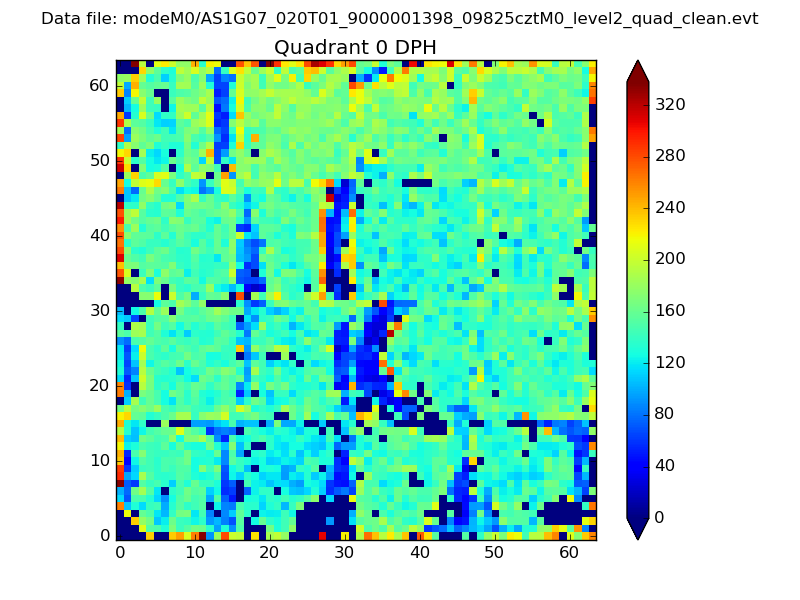 |
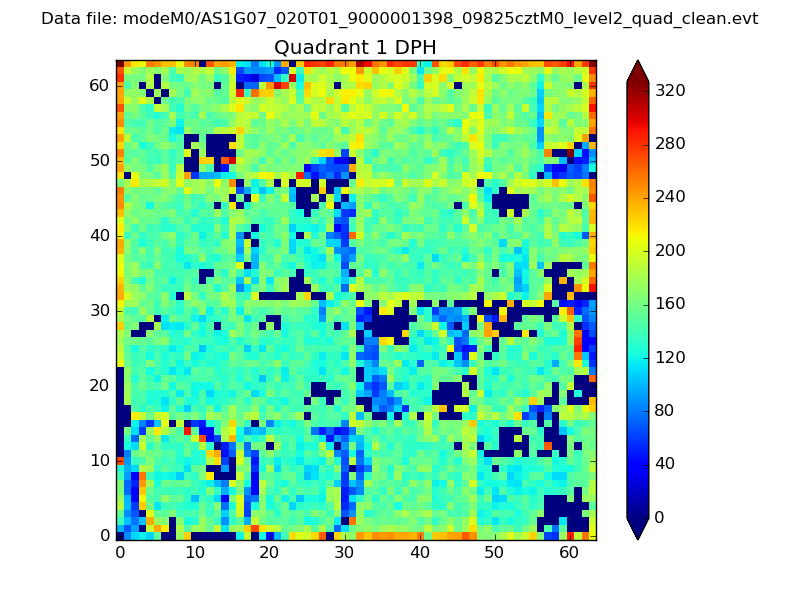 |
Quadrant B |
|---|---|---|---|
| Quadrant D |  |
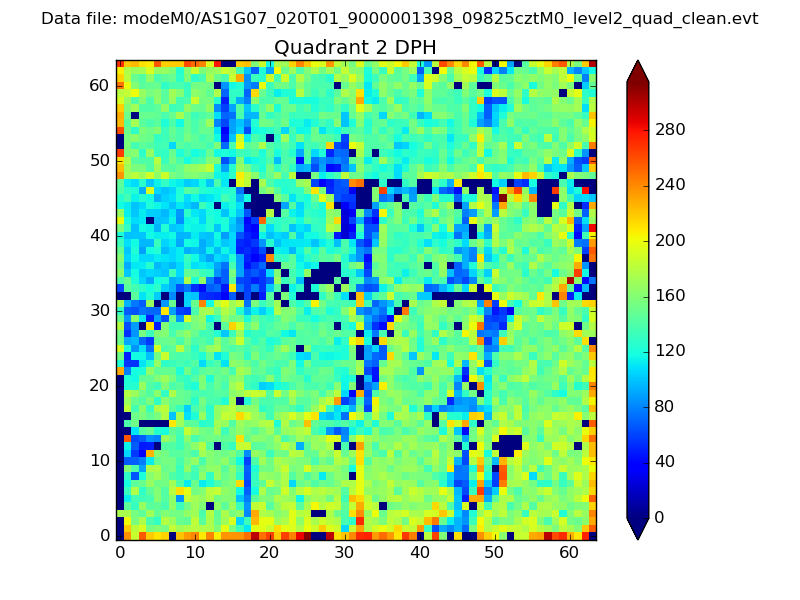 |
Quadrant C |
| Plot type | Count rate plots | Images |
|---|---|---|
| Comparison with Poisson distribution Blue bars denote a histogram of data divided into 1 sec bins. Red curve is a Poisson curve with rate = median count rate of data. |
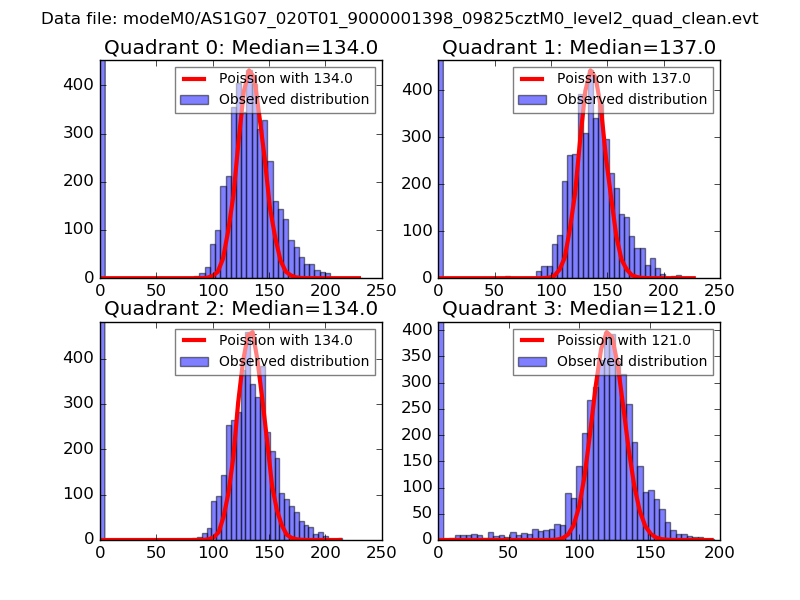 |
 |
| Quadrant-wise count rates Data is divided into 100 sec bins |
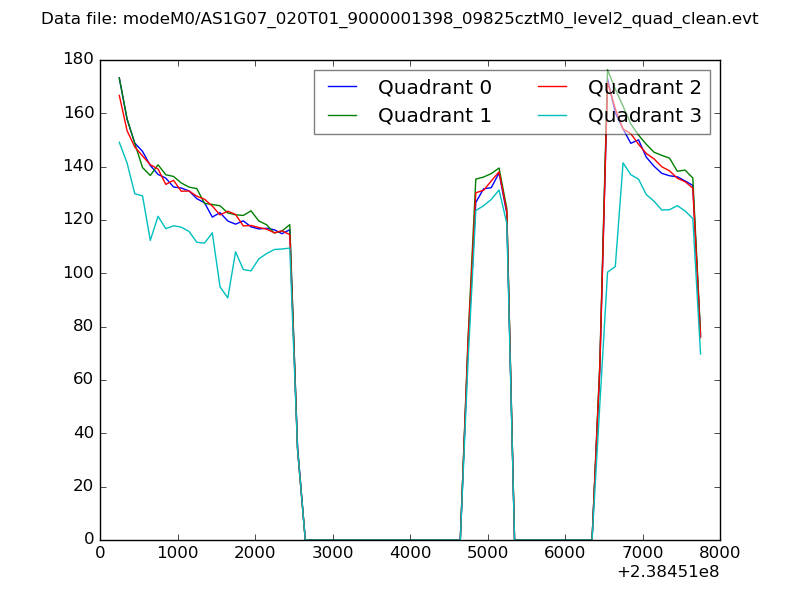 |
|
| Module-wise count rates for Quadrant A Data is divided into 100 sec bins |
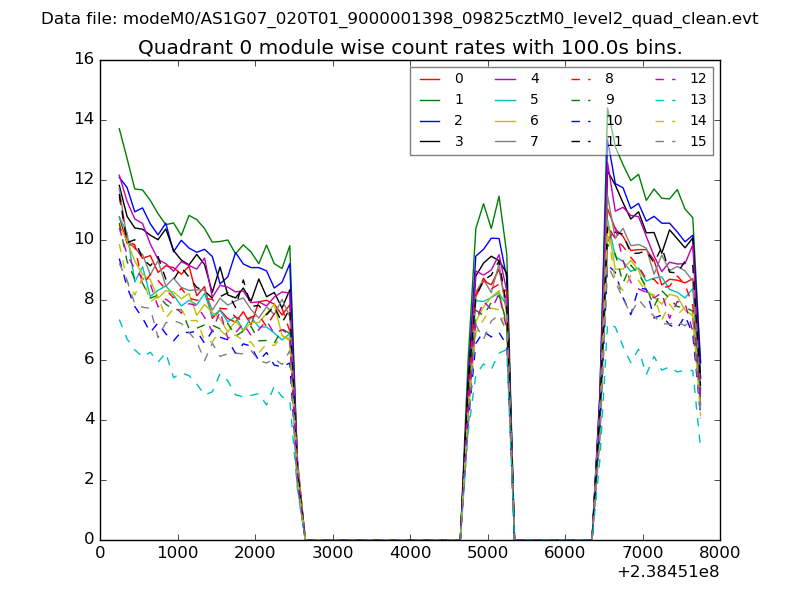 |
 |
| Module-wise count rates for Quadrant B Data is divided into 100 sec bins |
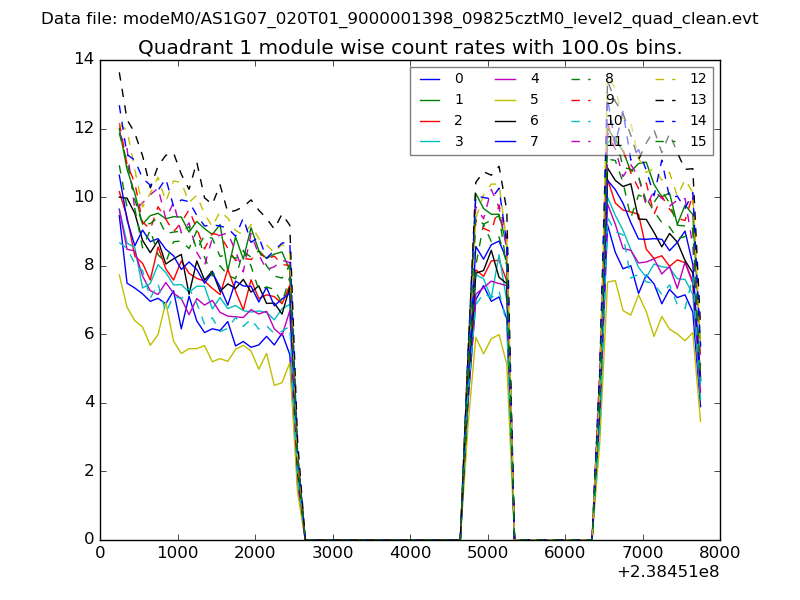 |
 |
| Module-wise count rates for Quadrant C Data is divided into 100 sec bins |
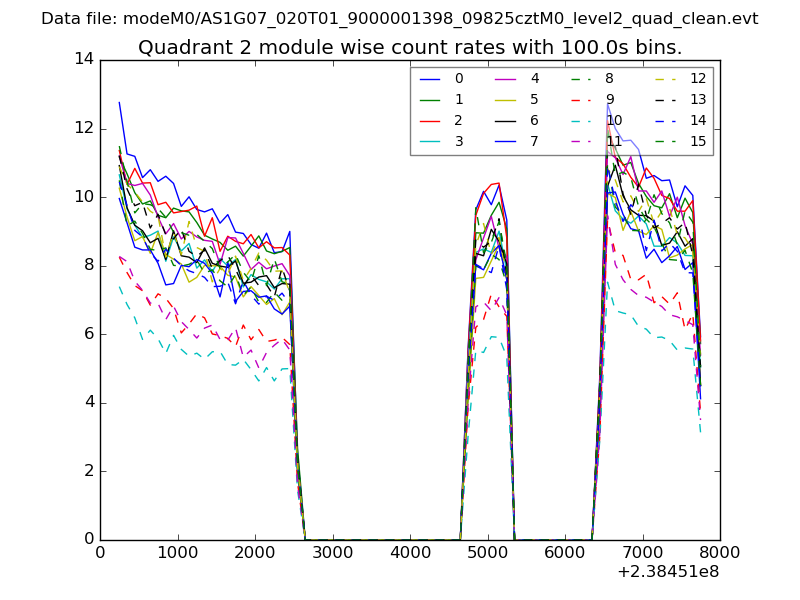 |
 |
| Module-wise count rates for Quadrant D Data is divided into 100 sec bins |
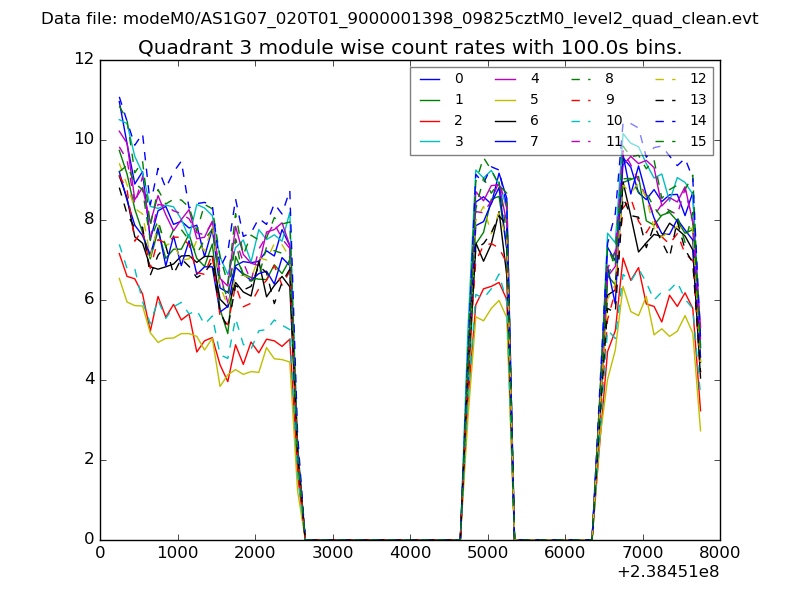 |
 |
| Parameter | Plot |
|---|---|
| CZT HV Monitor | 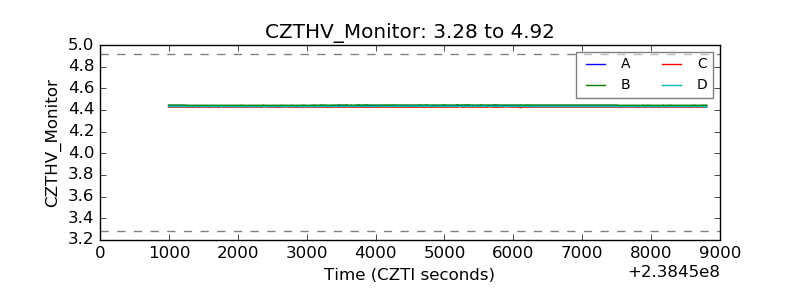 |
| D_VDD | 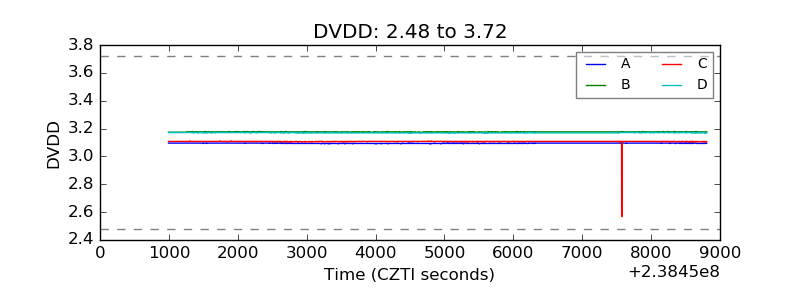 |
| Temperature 1 | 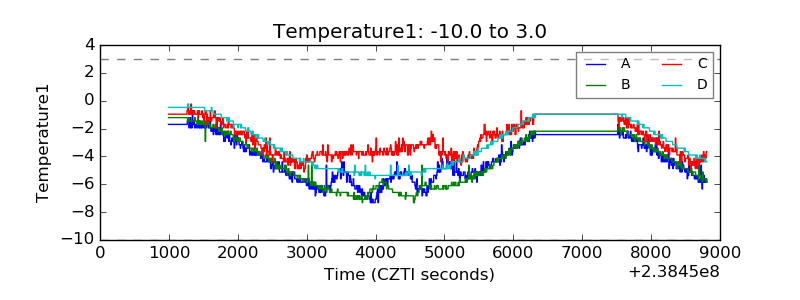 |
| Veto HV Monitor |  |
| Veto LLD |  |
| Alpha Counter | 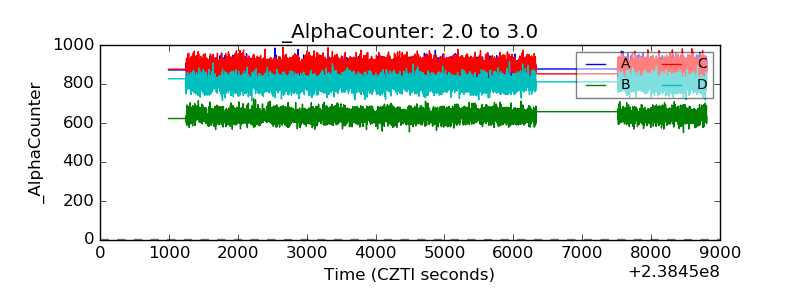 |
| _CPM_Rate | 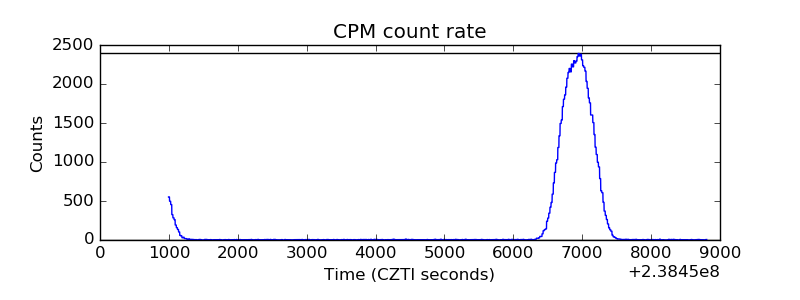 |
| CZT Counter |  |
| +2.5 Volts monitor |  |
| +5 Volts monitor | 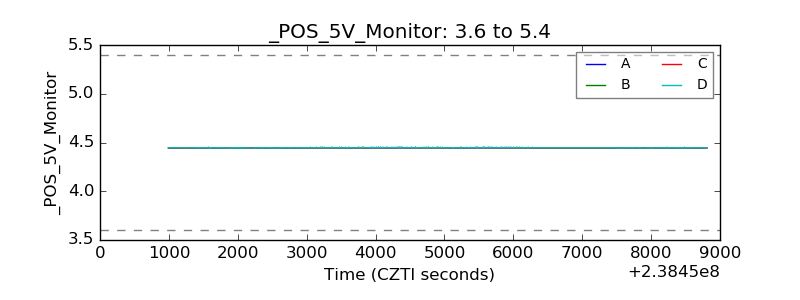 |
| _ROLL_ROT | 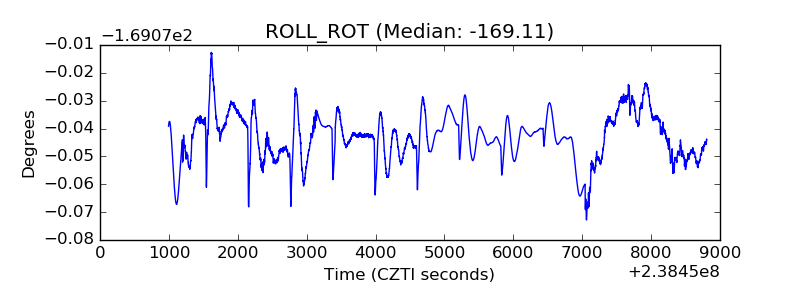 |
| _Roll_DEC | 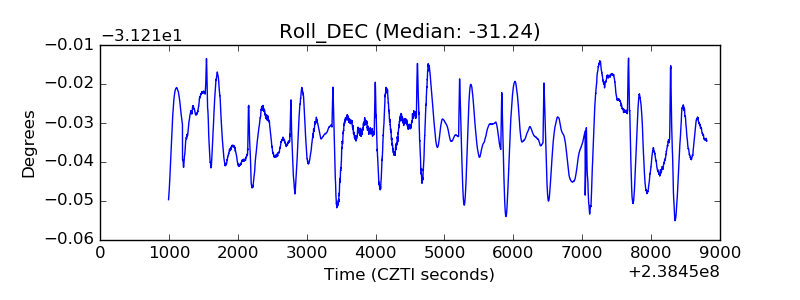 |
| _Roll_RA |  |
| Veto Counter | 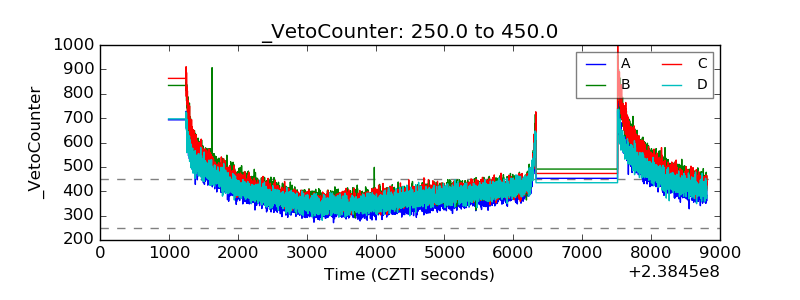 |