| Param | Original file | Final file |
|---|---|---|
| Filename | modeM0/AS1G07_020T01_9000001398_09827cztM0_level2.evt | modeM0/AS1G07_020T01_9000001398_09827cztM0_level2_quad_clean.evt |
| Size (bytes) | 474,523,200 | 86,935,680 |
| Size | 452.5 MB | 82.9 MB |
| Events in quadrant A | 3,089,114 | 552,351 |
| Events in quadrant B | 3,221,302 | 575,990 |
| Events in quadrant C | 2,970,408 | 561,026 |
| Events in quadrant D | 4,669,362 | 510,376 |
| Mode M0 | |||
|---|---|---|---|
| Quadrant | BADHDUFLAG | Total packets | Discarded packets |
| A | 0 | 13112 | 9 |
| B | 0 | 13461 | 2 |
| C | 0 | 12770 | 4 |
| D | 0 | 18279 | 6 |
| Mode SS | |||
|---|---|---|---|
| Quadrant | BADHDUFLAG | Total packets | Discarded packets |
| A | 0 | 126 | 0 |
| B | 0 | 126 | 0 |
| C | 0 | 126 | 0 |
| D | 0 | 126 | 0 |
| Mode M9 | |||
|---|---|---|---|
| Quadrant | BADHDUFLAG | Total packets | Discarded packets |
| A | 0 | 22 | 0 |
| B | 0 | 22 | 0 |
| C | 0 | 22 | 0 |
| D | 0 | 23 | 0 |
| Quadrant | Total seconds | Saturated seconds | Saturation percentage |
|---|---|---|---|
| A | 6199 | 54 | 0.871108% |
| B | 6202 | 57 | 0.919058% |
| C | 6201 | 14 | 0.225770% |
| D | 6201 | 172 | 2.773746% |
Noise dominated data is calculated using 1-second bins in cleaned event files. If a bin has >2000 counts, and if more than 50% of those come from <1% of pixels, then it is considered to be noise-dominated and hence unusable.
| Quadrant | # 1 sec bins | Bins with >0 counts | Bins with >2000 counts | High rate bins dominated by noise | Noise dominated (total time) | Noise dominated (detector-on time) | Marked lightcurve |
|---|---|---|---|---|---|---|---|
| A | 7522 | 6203 | 11 | 11 | 0.15% | 0.18% | 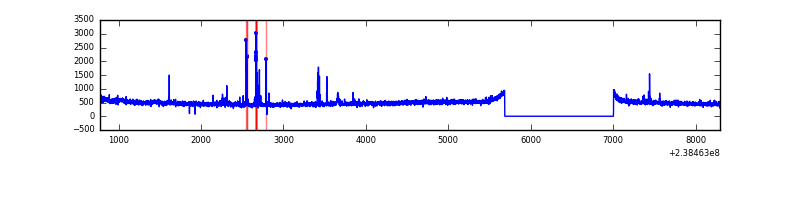 |
| B | 7522 | 6203 | 3 | 3 | 0.04% | 0.05% | 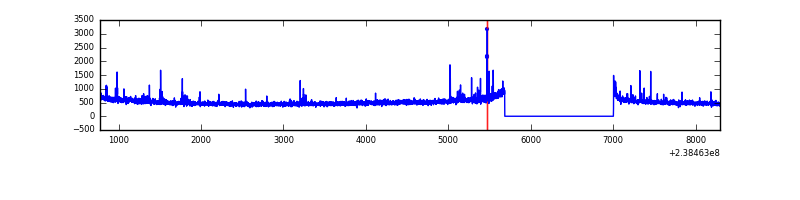 |
| C | 7522 | 6203 | 1 | 1 | 0.01% | 0.02% | 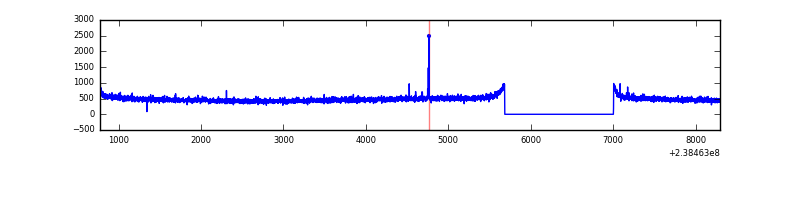 |
| D | 7522 | 6203 | 163 | 163 | 2.17% | 2.63% | 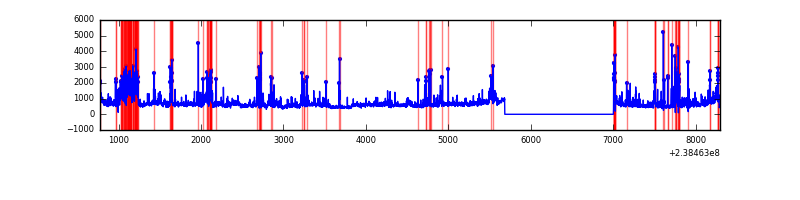 |
Top three noisy pixels from each quadrant. If the there are fewer than three noisy pixels in the level2.evt file, extra rows are filled as -1
| Pixel properties | Quadrant properties | ||||||
|---|---|---|---|---|---|---|---|
| Quadrant | DetID | PixID | Counts | Sigma | Mean | Median | Sigma |
| A | 14 | 111 | 86547 | 547.68 | 768 | 752 | 156.7 |
| A | 14 | 254 | 28554 | 177.48 | 768 | 752 | 156.7 |
| A | 13 | 248 | 13924 | 84.08 | 768 | 752 | 156.7 |
| B | 0 | 214 | 48425 | 324.18 | 787 | 769 | 147.0 |
| B | 4 | 239 | 46718 | 312.57 | 787 | 769 | 147.0 |
| B | 0 | 219 | 22896 | 150.52 | 787 | 769 | 147.0 |
| C | 12 | 4 | 10198 | 54.11 | 757 | 763 | 174.4 |
| C | 13 | 61 | 5802 | 28.9 | 757 | 763 | 174.4 |
| C | 10 | 22 | 4414 | 20.94 | 757 | 763 | 174.4 |
| D | 7 | 46 | 646377 | 3608.35 | 731 | 715 | 178.9 |
| D | 1 | 52 | 422932 | 2359.6 | 731 | 715 | 178.9 |
| D | 12 | 233 | 272374 | 1518.19 | 731 | 715 | 178.9 |
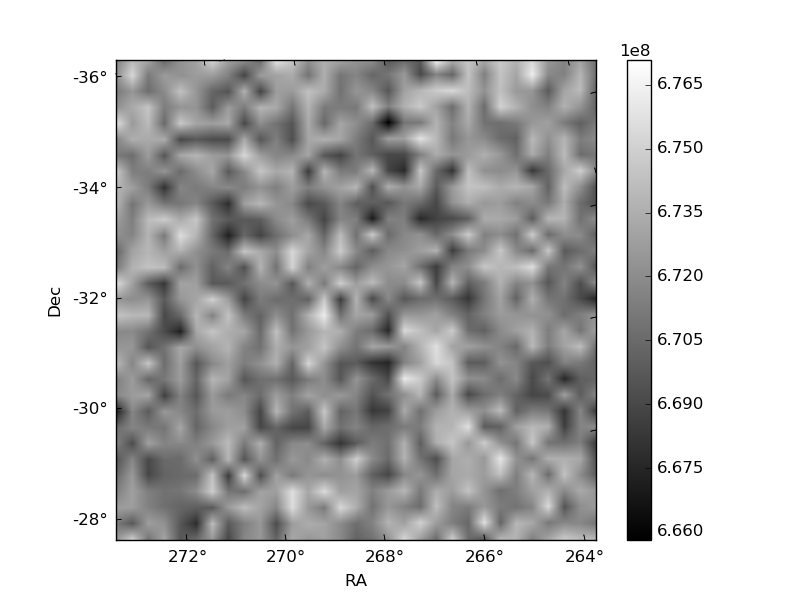
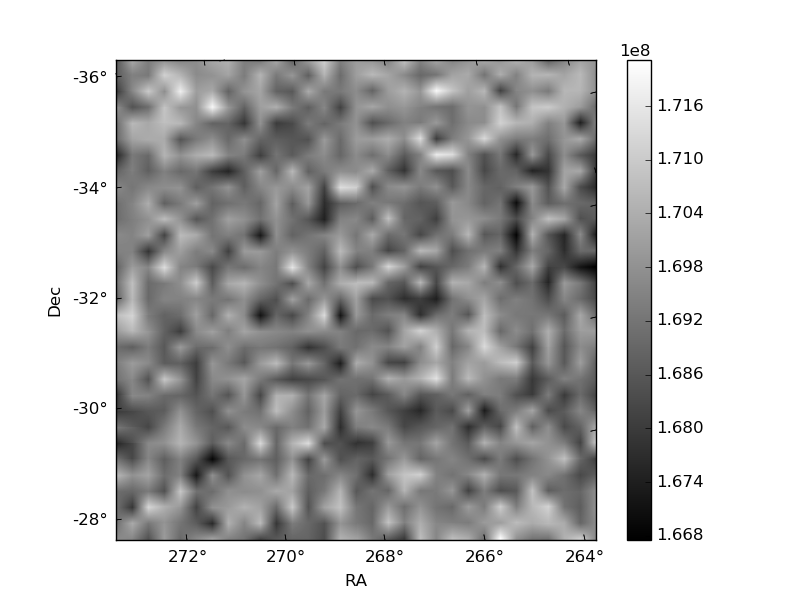
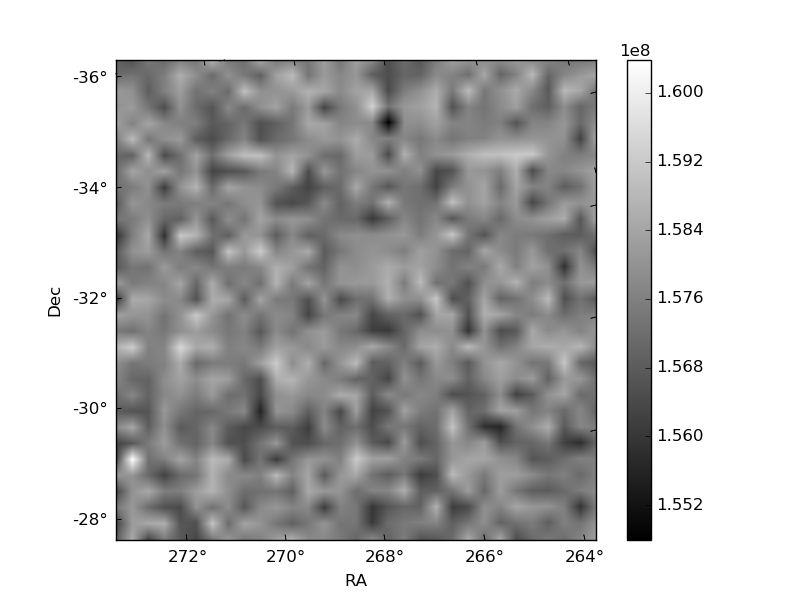
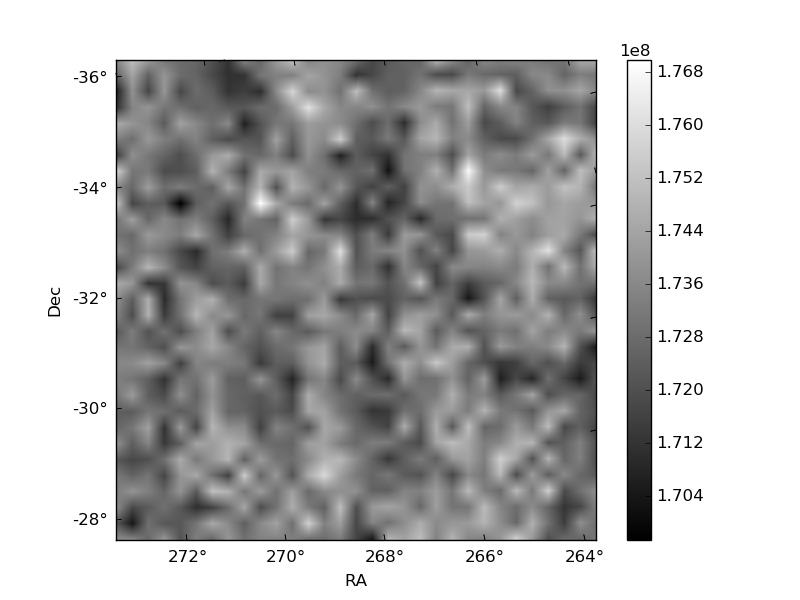
Histogram calculated using DETX and DETY for each event in the final _common_clean file
| Quadrant A | 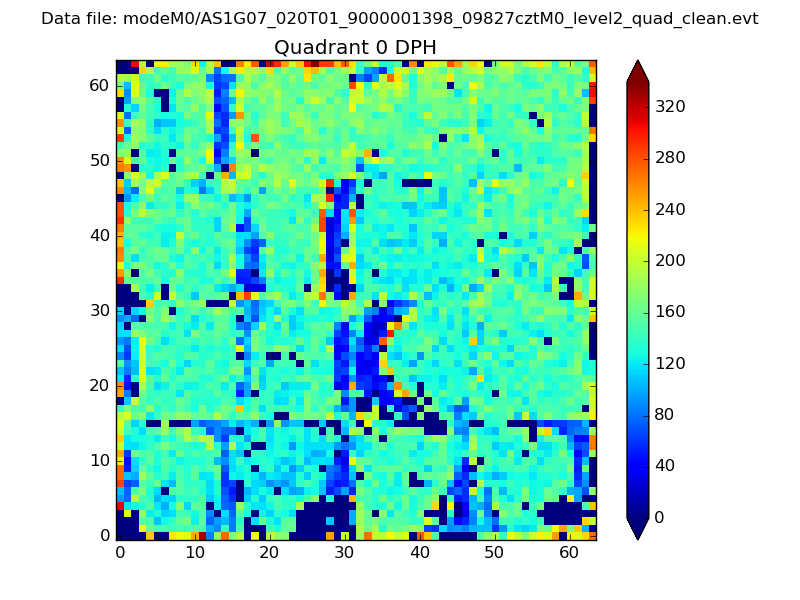 |
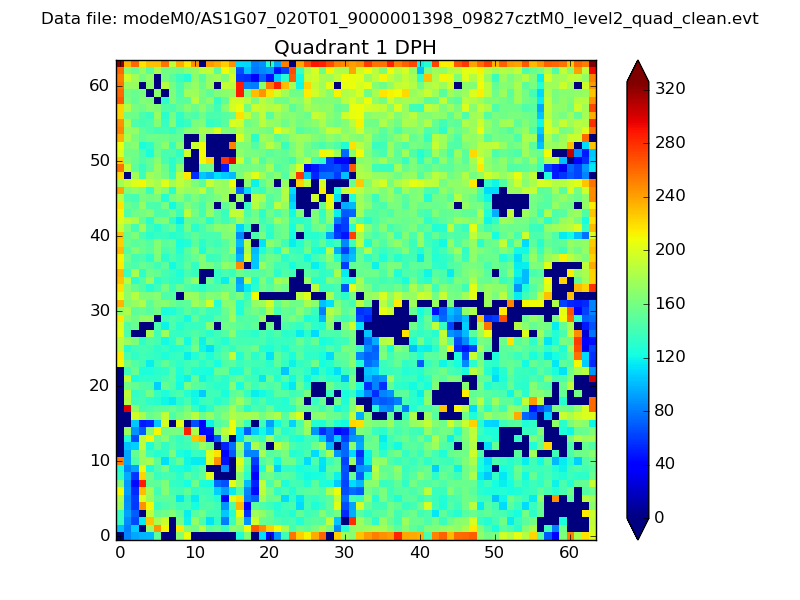 |
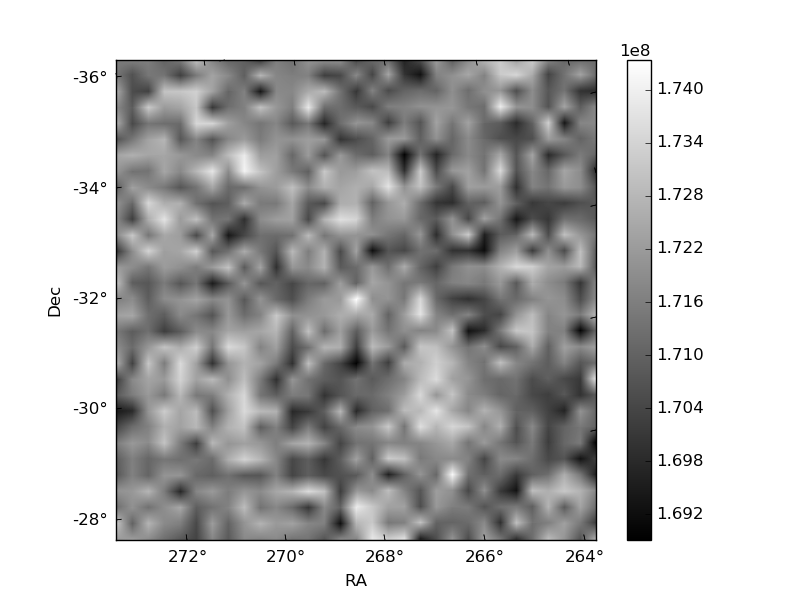
Quadrant B |
|---|---|---|---|
| Quadrant D | 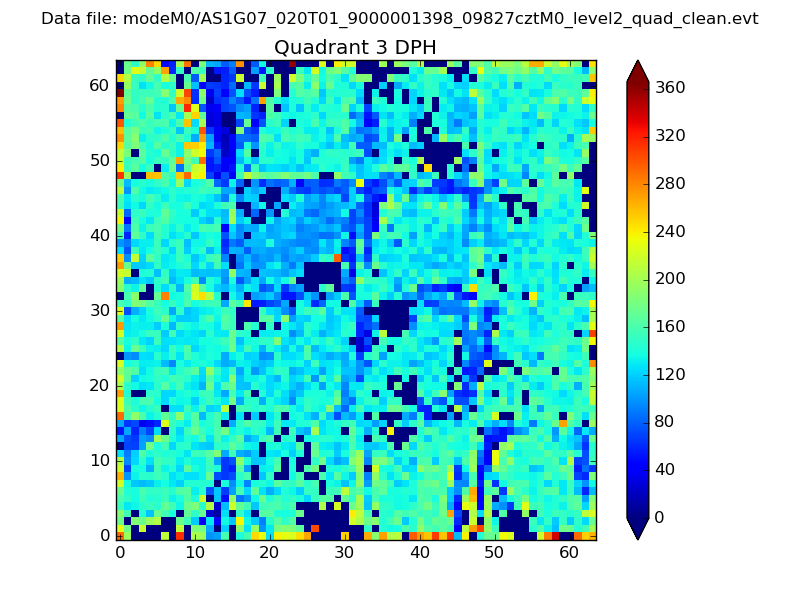 |
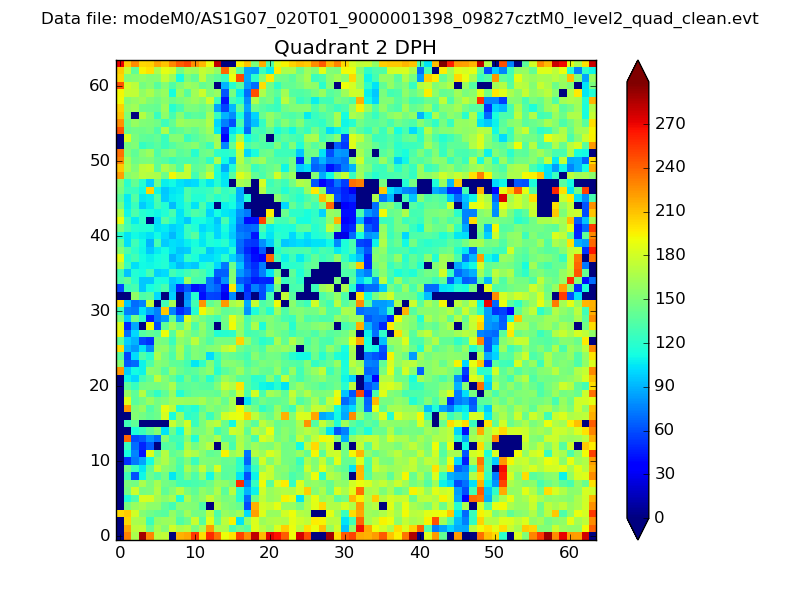 |
Quadrant C |
| Plot type | Count rate plots | Images |
|---|---|---|
| Comparison with Poisson distribution Blue bars denote a histogram of data divided into 1 sec bins. Red curve is a Poisson curve with rate = median count rate of data. |
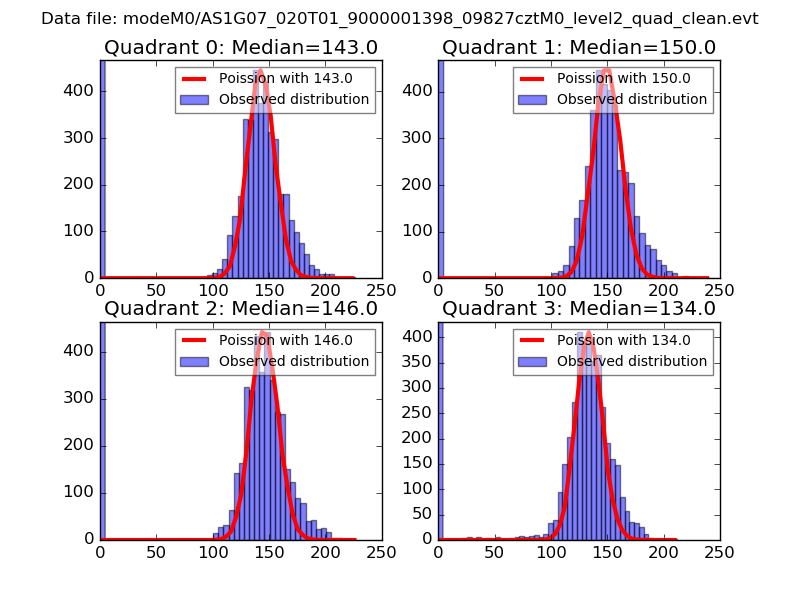 |
 |
| Quadrant-wise count rates Data is divided into 100 sec bins |
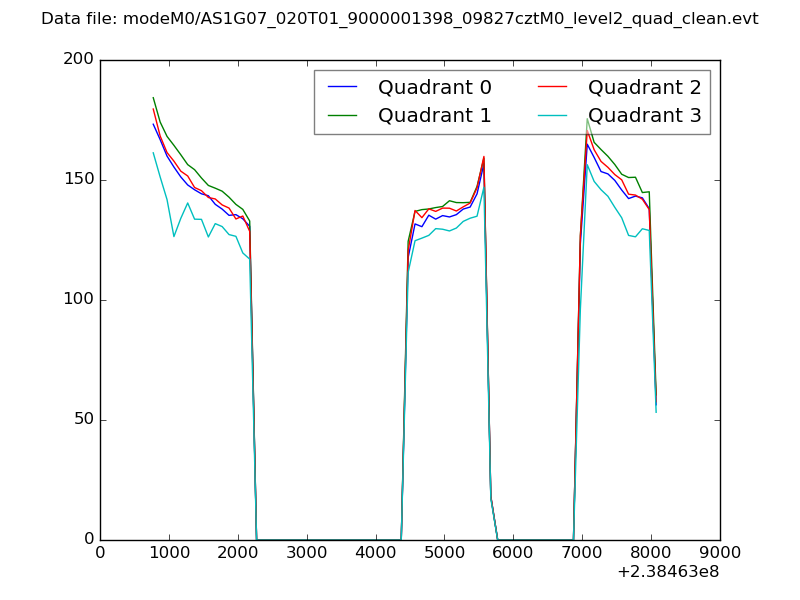 |
|
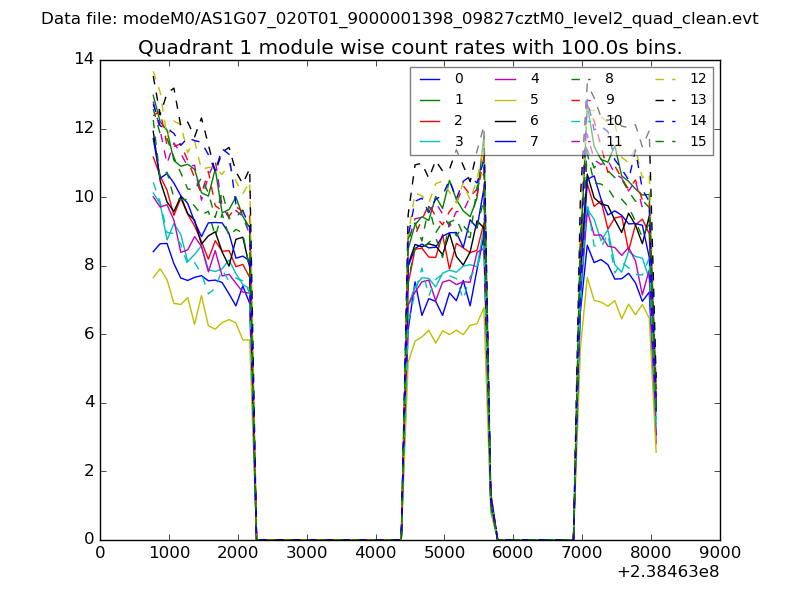
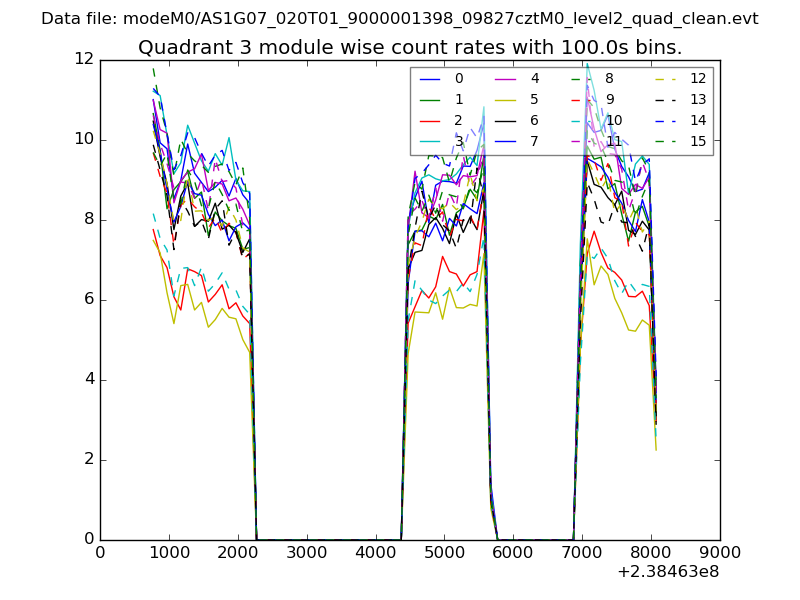
| Module-wise count rates for Quadrant A Data is divided into 100 sec bins |
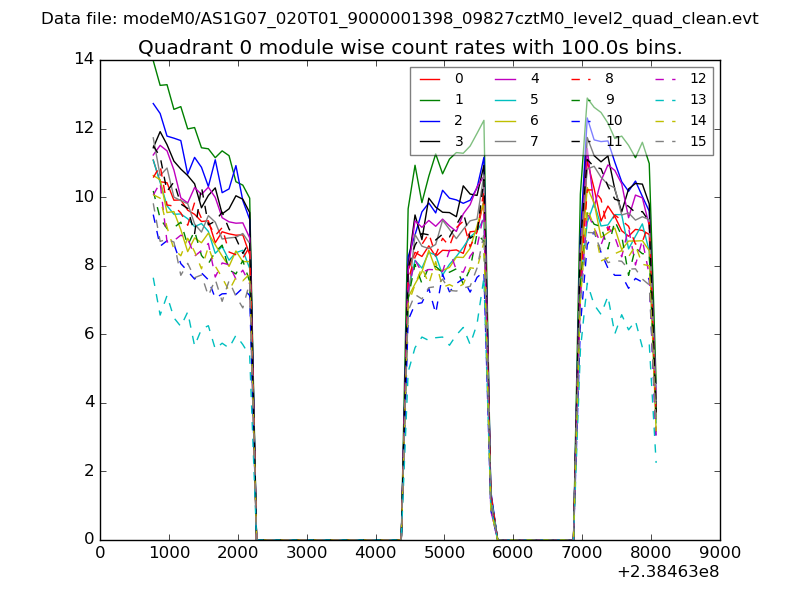 |
 |
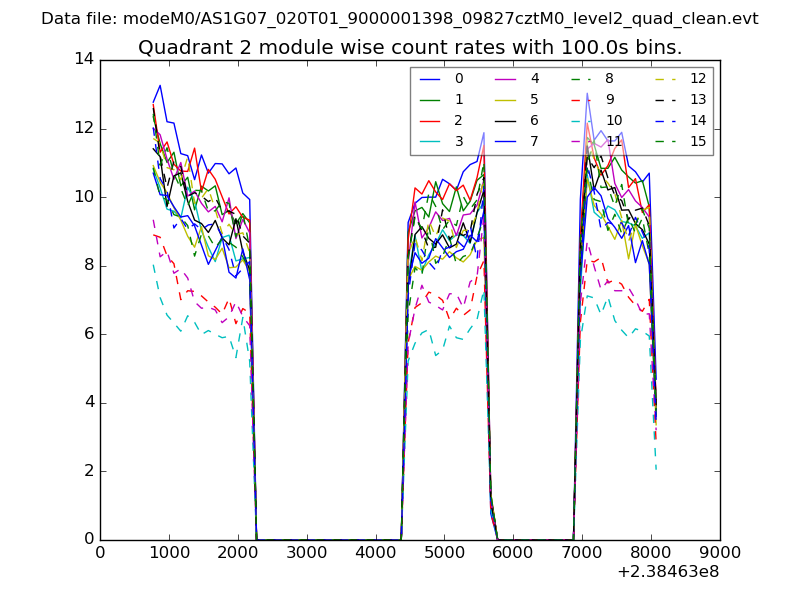
| Module-wise count rates for Quadrant B Data is divided into 100 sec bins |
 |
 |
| Module-wise count rates for Quadrant C Data is divided into 100 sec bins |
 |
 |
| Module-wise count rates for Quadrant D Data is divided into 100 sec bins |
 |
 |
| Parameter | Plot |
|---|---|
| CZT HV Monitor | 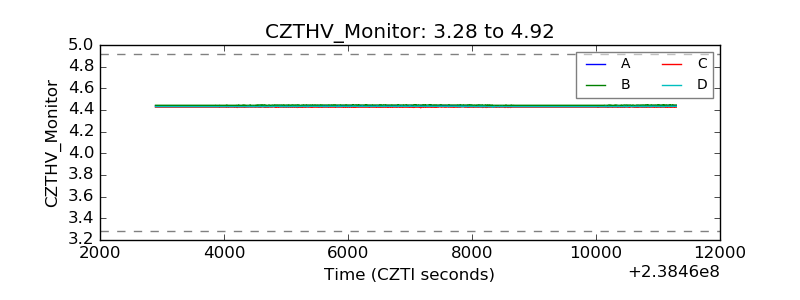 |
| D_VDD | 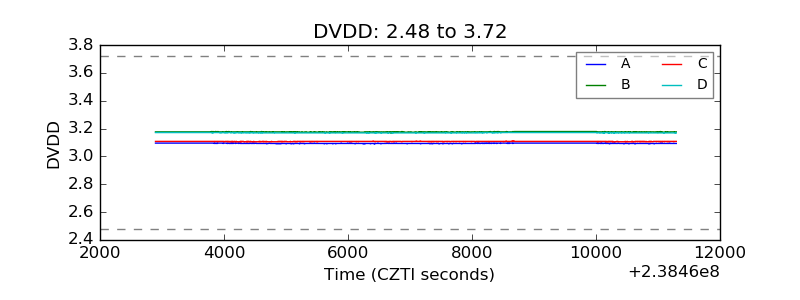 |
| Temperature 1 | 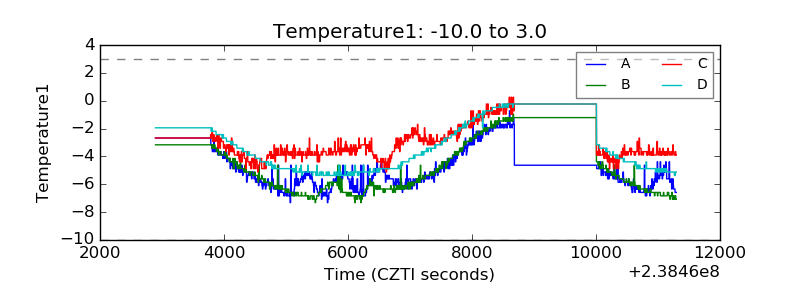 |
| Veto HV Monitor | 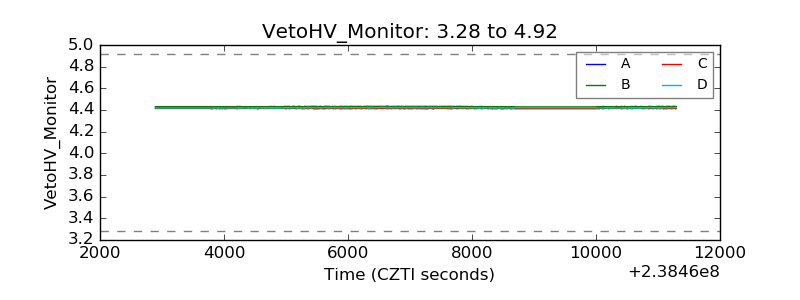 |
| Veto LLD | 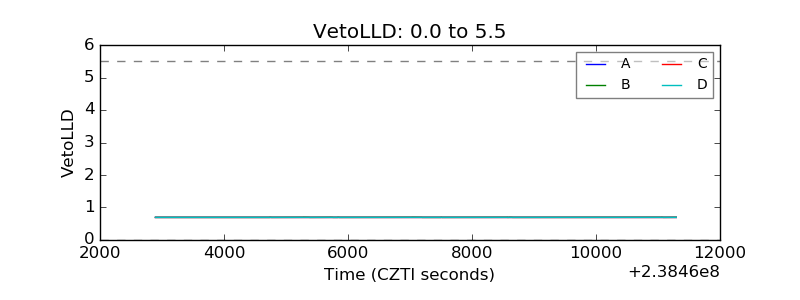 |
| Alpha Counter | 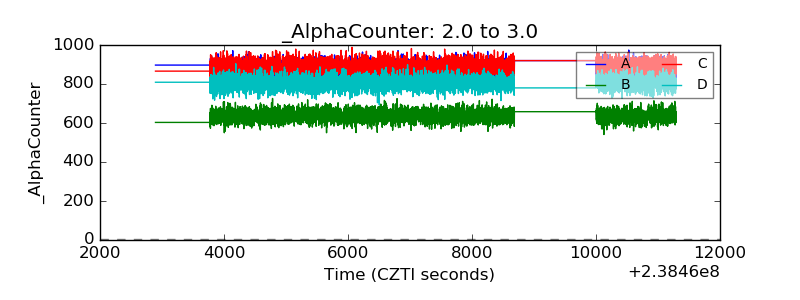 |
| _CPM_Rate | 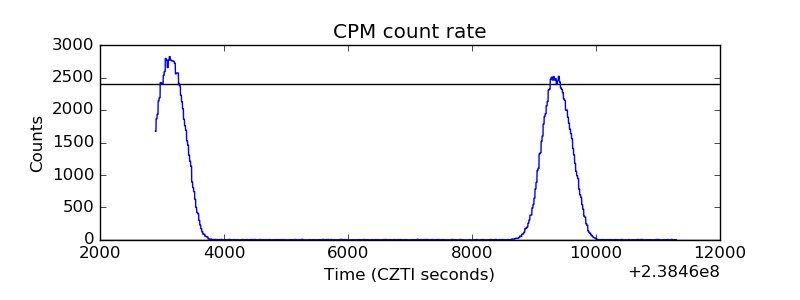 |
| CZT Counter | 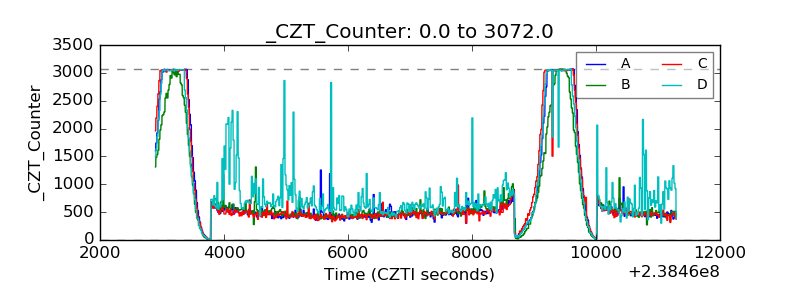 |
| +2.5 Volts monitor | 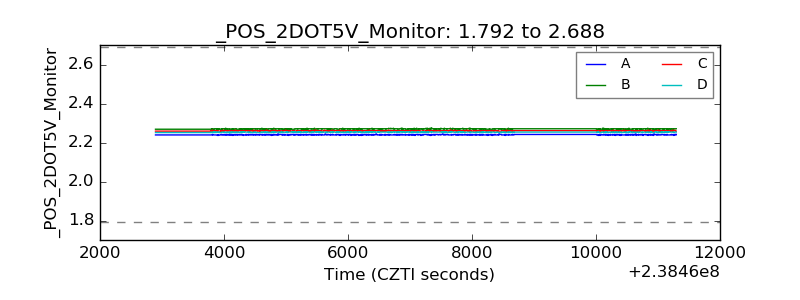 |
| +5 Volts monitor |  |
| _ROLL_ROT | 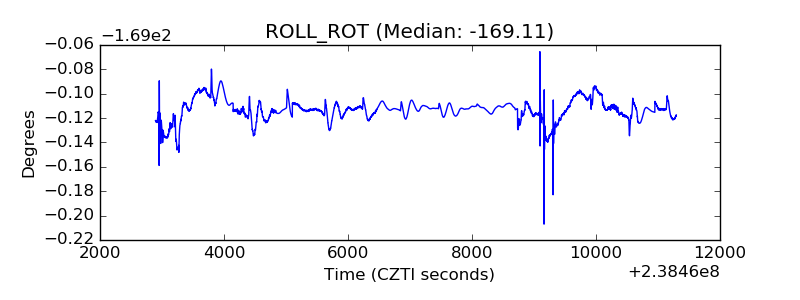 |
| _Roll_DEC | 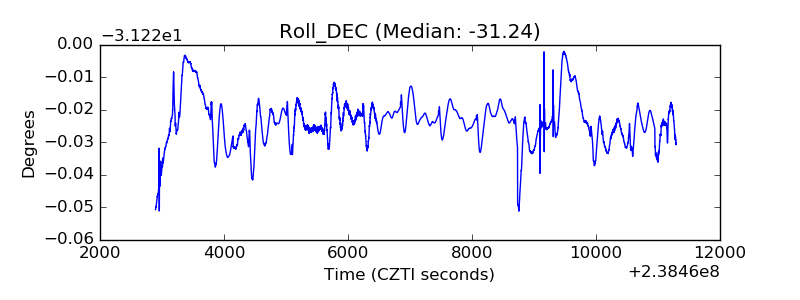 |
| _Roll_RA | 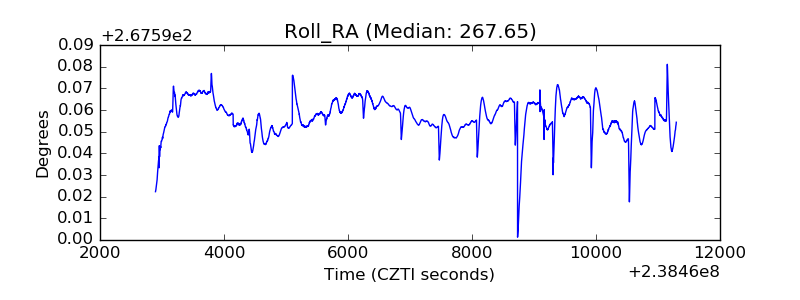 |
| Veto Counter | 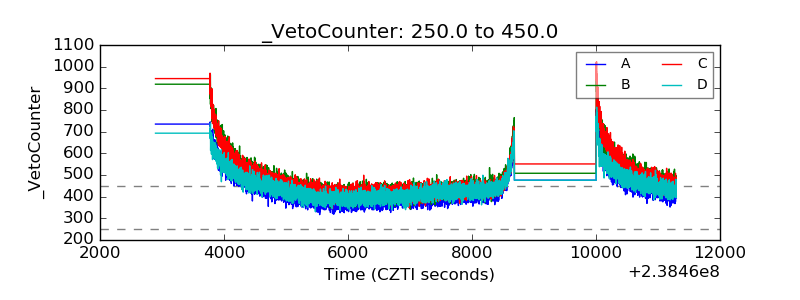 |