| Param | Original file | Final file |
|---|---|---|
| Filename | modeM0/AS1G07_020T01_9000001398_09828cztM0_level2.evt | modeM0/AS1G07_020T01_9000001398_09828cztM0_level2_quad_clean.evt |
| Size (bytes) | 482,906,880 | 78,338,880 |
| Size | 460.5 MB | 74.7 MB |
| Events in quadrant A | 3,054,498 | 484,632 |
| Events in quadrant B | 3,280,840 | 503,977 |
| Events in quadrant C | 3,037,037 | 493,677 |
| Events in quadrant D | 4,820,172 | 445,466 |
| Mode M0 | |||
|---|---|---|---|
| Quadrant | BADHDUFLAG | Total packets | Discarded packets |
| A | 0 | 13158 | 3 |
| B | 0 | 13744 | 2 |
| C | 0 | 13068 | 2 |
| D | 0 | 18505 | 2 |
| Mode SS | |||
|---|---|---|---|
| Quadrant | BADHDUFLAG | Total packets | Discarded packets |
| A | 0 | 130 | 0 |
| B | 0 | 130 | 0 |
| C | 0 | 130 | 0 |
| D | 0 | 130 | 0 |
| Mode M9 | |||
|---|---|---|---|
| Quadrant | BADHDUFLAG | Total packets | Discarded packets |
| A | 0 | 18 | 0 |
| B | 0 | 18 | 0 |
| C | 0 | 18 | 0 |
| D | 0 | 19 | 0 |
| Quadrant | Total seconds | Saturated seconds | Saturation percentage |
|---|---|---|---|
| A | 6365 | 27 | 0.424195% |
| B | 6365 | 51 | 0.801257% |
| C | 6365 | 13 | 0.204242% |
| D | 6365 | 335 | 5.263158% |
Noise dominated data is calculated using 1-second bins in cleaned event files. If a bin has >2000 counts, and if more than 50% of those come from <1% of pixels, then it is considered to be noise-dominated and hence unusable.
| Quadrant | # 1 sec bins | Bins with >0 counts | Bins with >2000 counts | High rate bins dominated by noise | Noise dominated (total time) | Noise dominated (detector-on time) | Marked lightcurve |
|---|---|---|---|---|---|---|---|
| A | 7720 | 6366 | 3 | 3 | 0.04% | 0.05% | 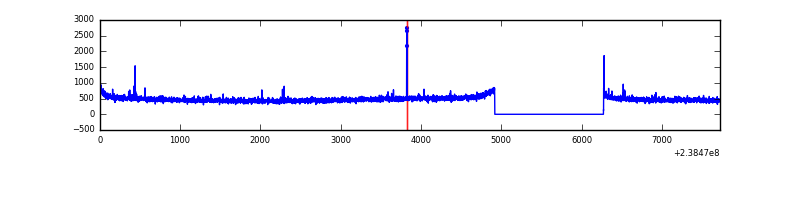 |
| B | 7720 | 6366 | 10 | 10 | 0.13% | 0.16% | 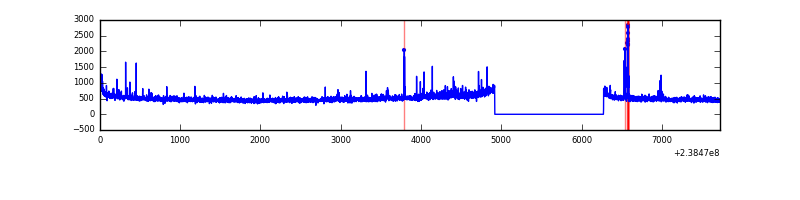 |
| C | 7720 | 6366 | 0 | 0 | 0.00% | 0.00% | 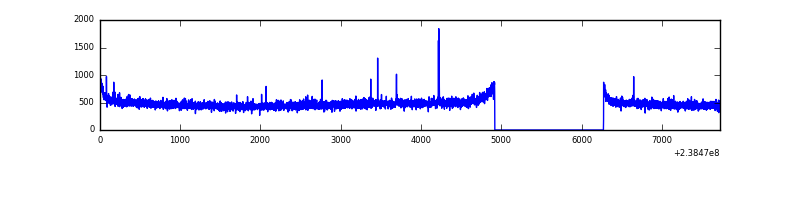 |
| D | 7720 | 6366 | 264 | 264 | 3.42% | 4.15% | 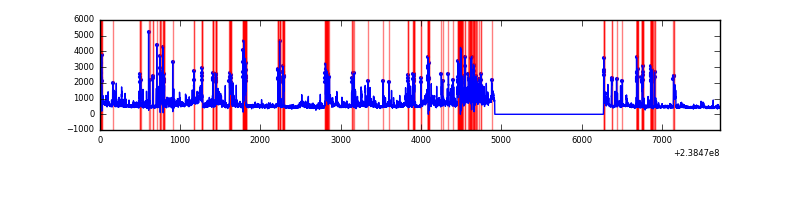 |
Top three noisy pixels from each quadrant. If the there are fewer than three noisy pixels in the level2.evt file, extra rows are filled as -1
| Pixel properties | Quadrant properties | ||||||
|---|---|---|---|---|---|---|---|
| Quadrant | DetID | PixID | Counts | Sigma | Mean | Median | Sigma |
| A | 15 | 174 | 12785 | 76.02 | 784 | 768 | 158.1 |
| A | 14 | 254 | 11283 | 66.52 | 784 | 768 | 158.1 |
| A | 3 | 1 | 7494 | 42.55 | 784 | 768 | 158.1 |
| B | 0 | 214 | 68271 | 447.44 | 802 | 785 | 150.8 |
| B | 0 | 230 | 25906 | 166.56 | 802 | 785 | 150.8 |
| B | 4 | 239 | 22229 | 142.18 | 802 | 785 | 150.8 |
| C | 5 | 128 | 10422 | 54.47 | 773 | 779 | 177.0 |
| C | 13 | 61 | 5909 | 28.98 | 773 | 779 | 177.0 |
| C | 10 | 22 | 4822 | 22.84 | 773 | 779 | 177.0 |
| D | 1 | 52 | 1256723 | 6976.9 | 738 | 721 | 180.0 |
| D | 2 | 152 | 277941 | 1539.91 | 738 | 721 | 180.0 |
| D | 7 | 46 | 273767 | 1516.73 | 738 | 721 | 180.0 |
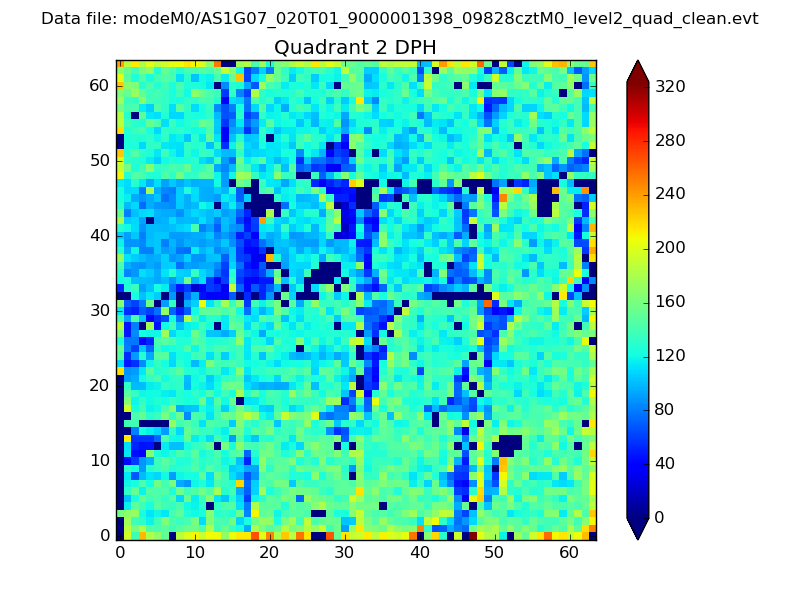
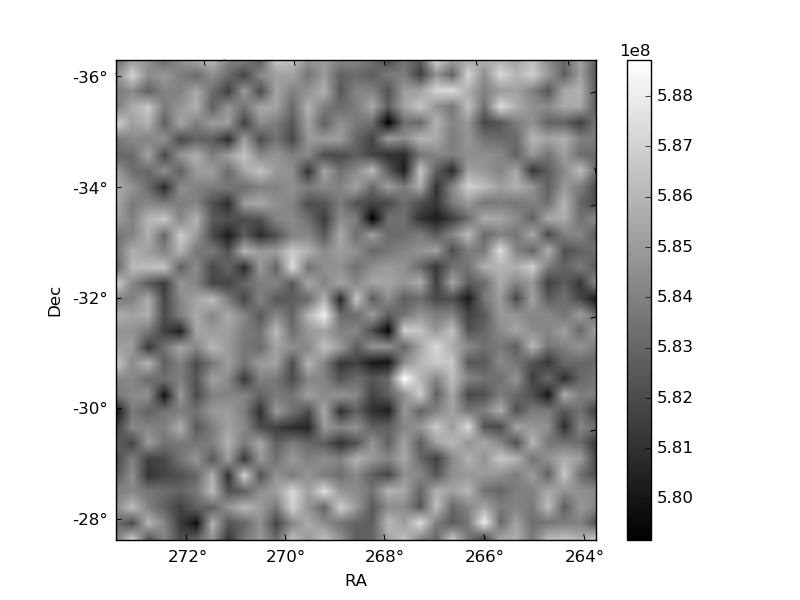
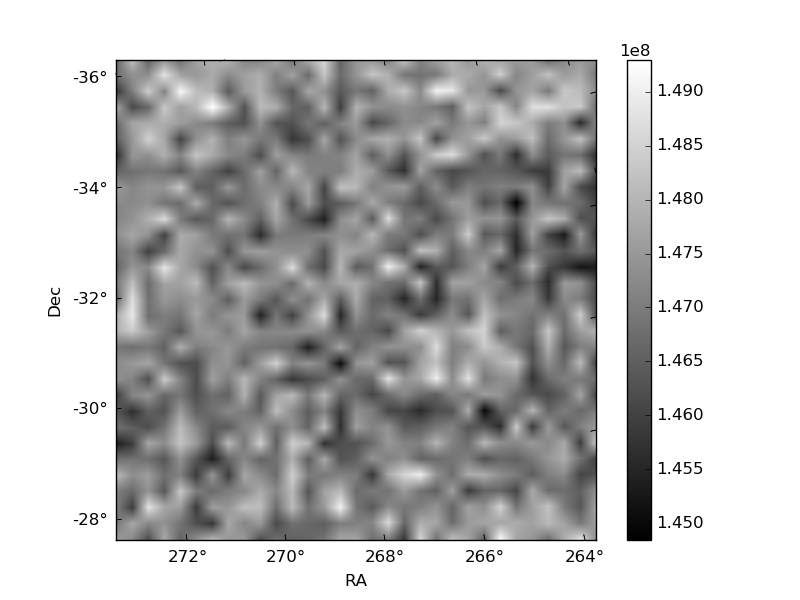
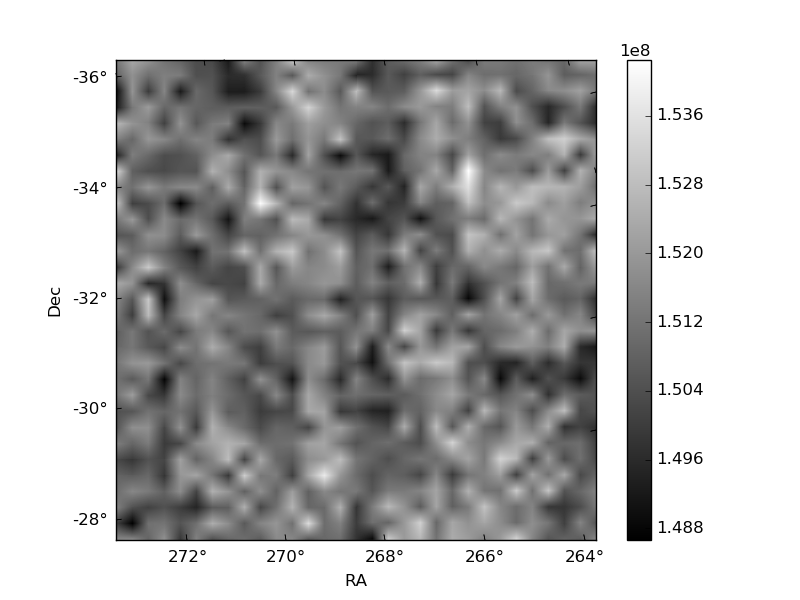
Histogram calculated using DETX and DETY for each event in the final _common_clean file
| Quadrant A | 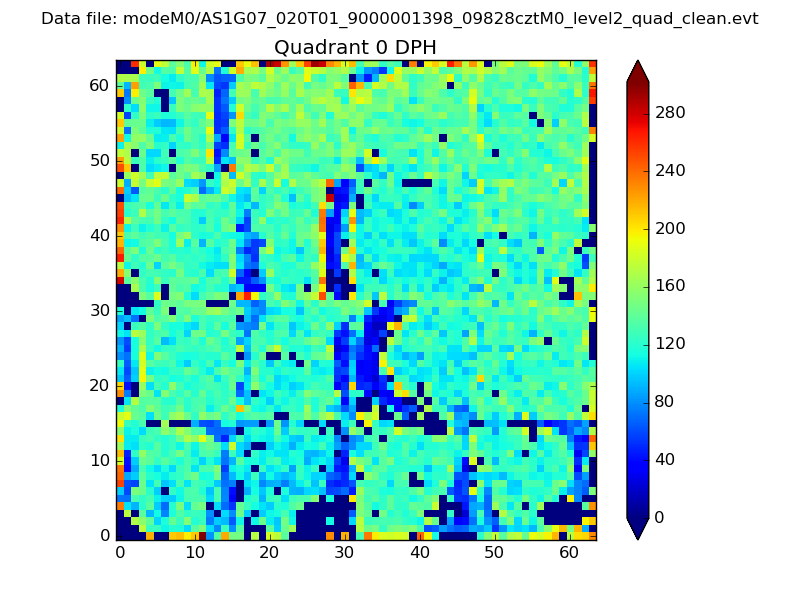 |
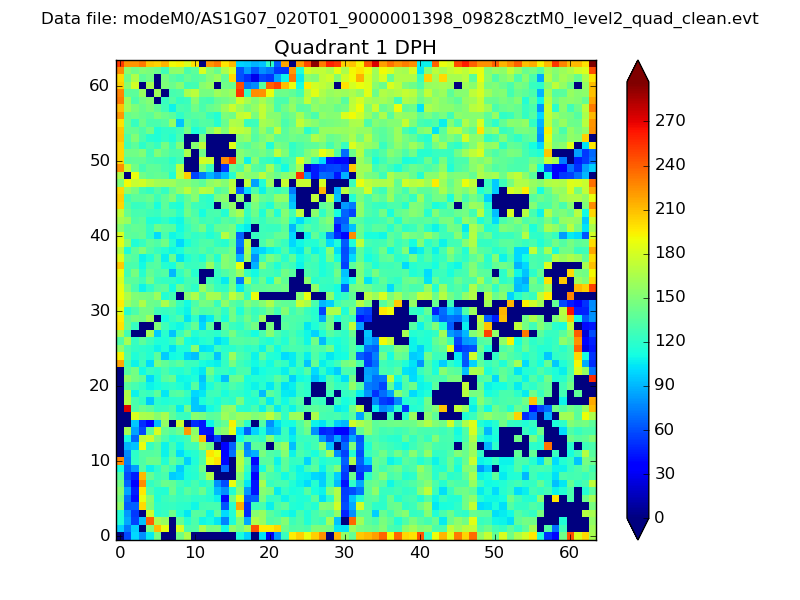 |
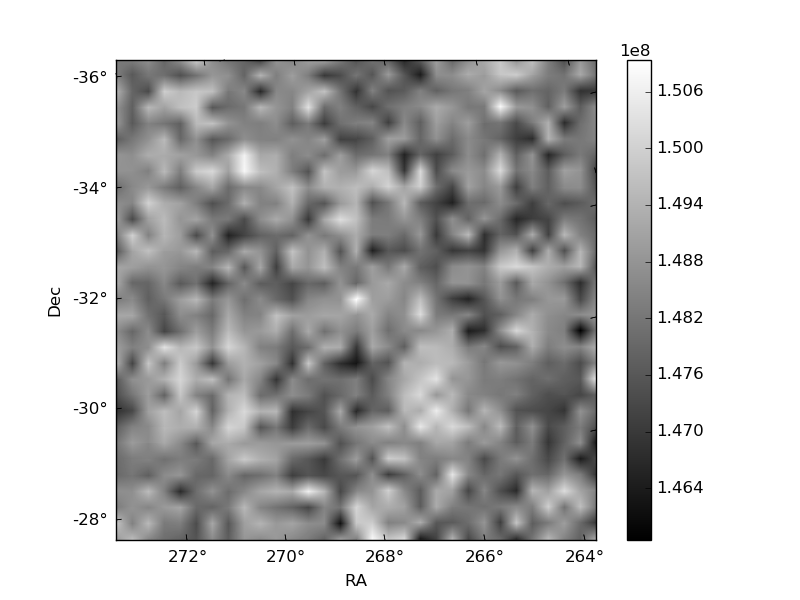
Quadrant B |
|---|---|---|---|
| Quadrant D | 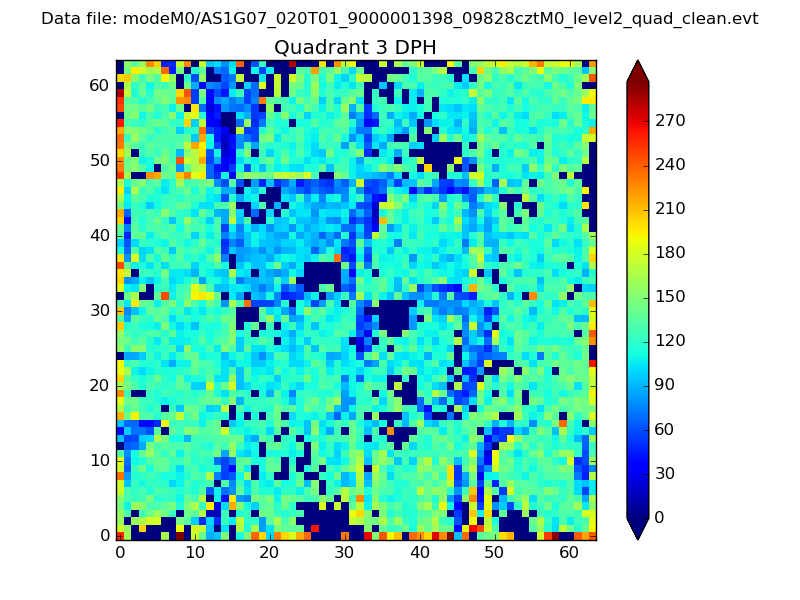 |
 |
Quadrant C |
| Plot type | Count rate plots | Images |
|---|---|---|
| Comparison with Poisson distribution Blue bars denote a histogram of data divided into 1 sec bins. Red curve is a Poisson curve with rate = median count rate of data. |
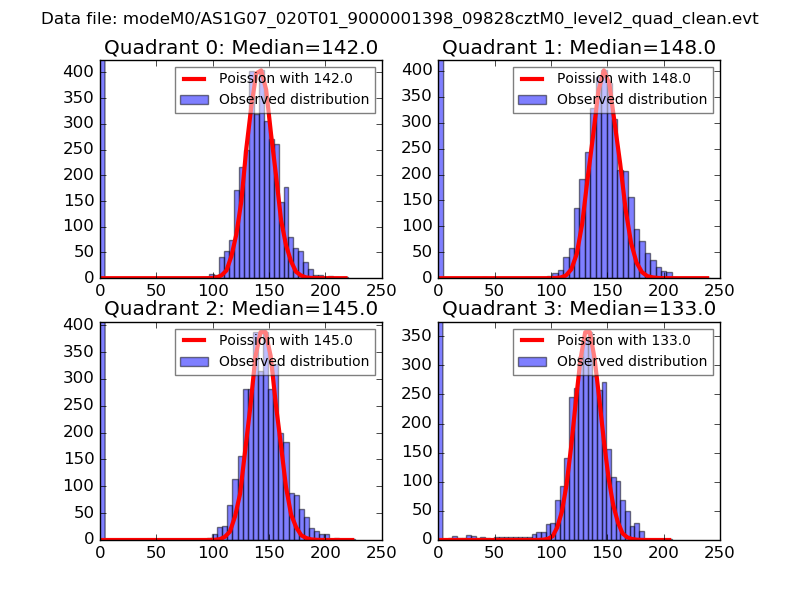 |
 |
| Quadrant-wise count rates Data is divided into 100 sec bins |
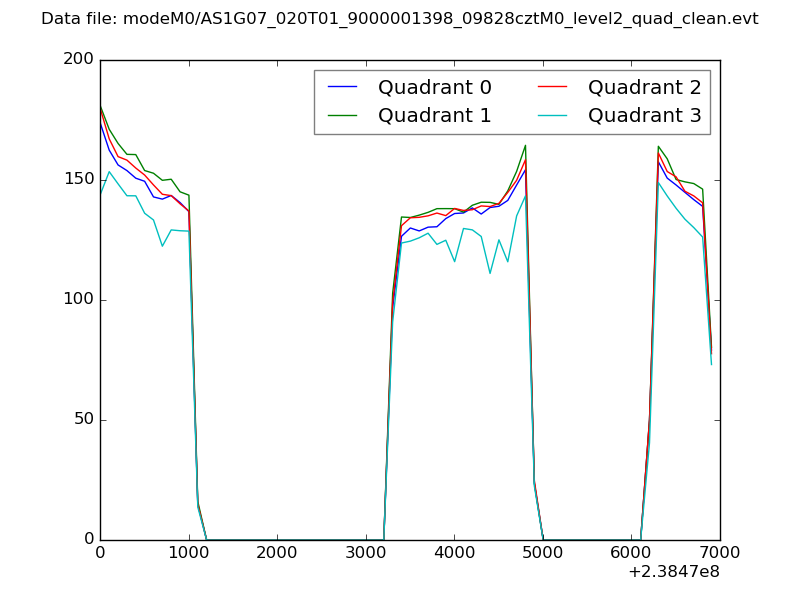 |
|
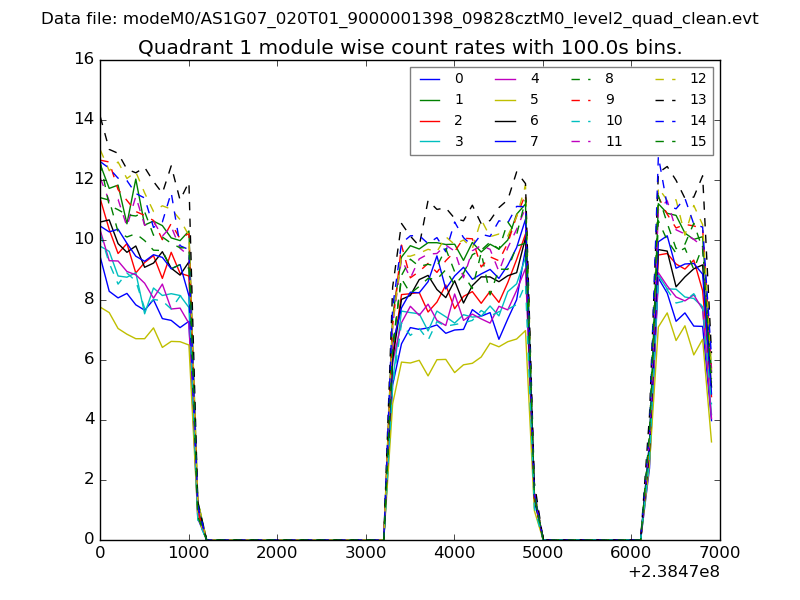
| Module-wise count rates for Quadrant A Data is divided into 100 sec bins |
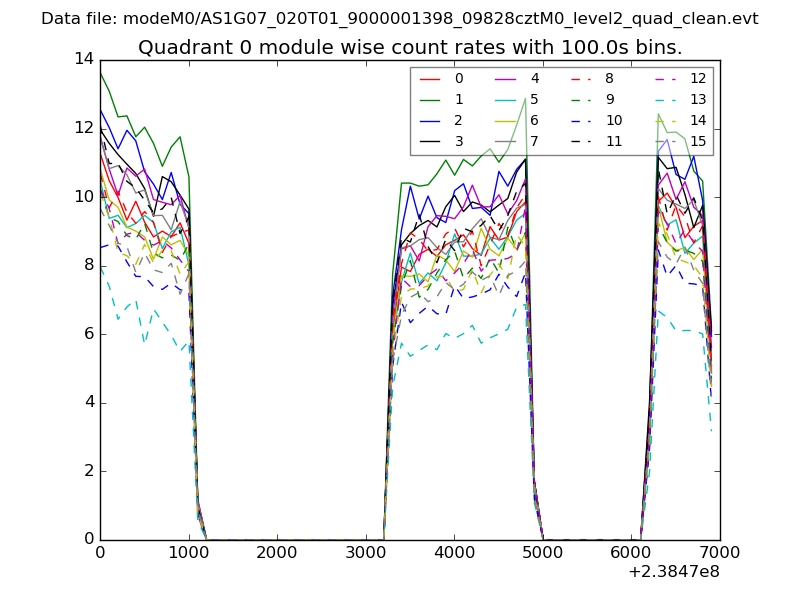 |
 |
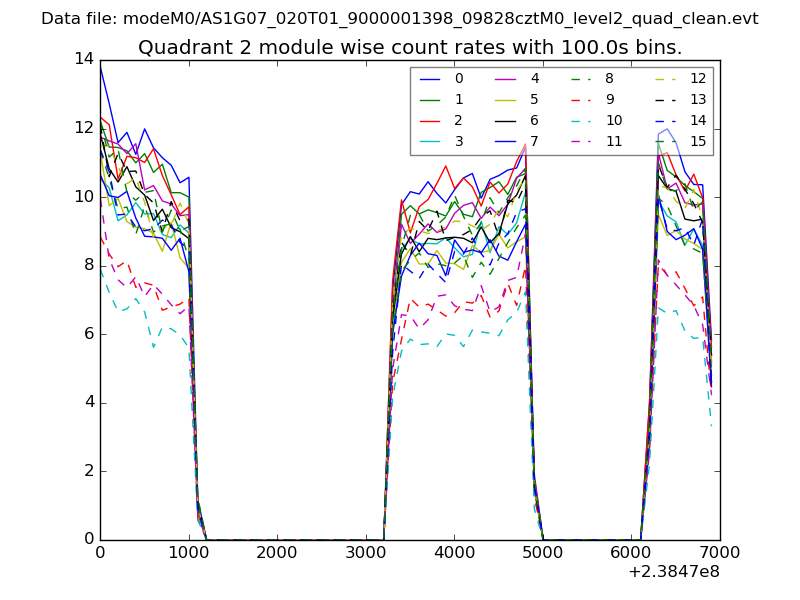
| Module-wise count rates for Quadrant B Data is divided into 100 sec bins |
 |
 |
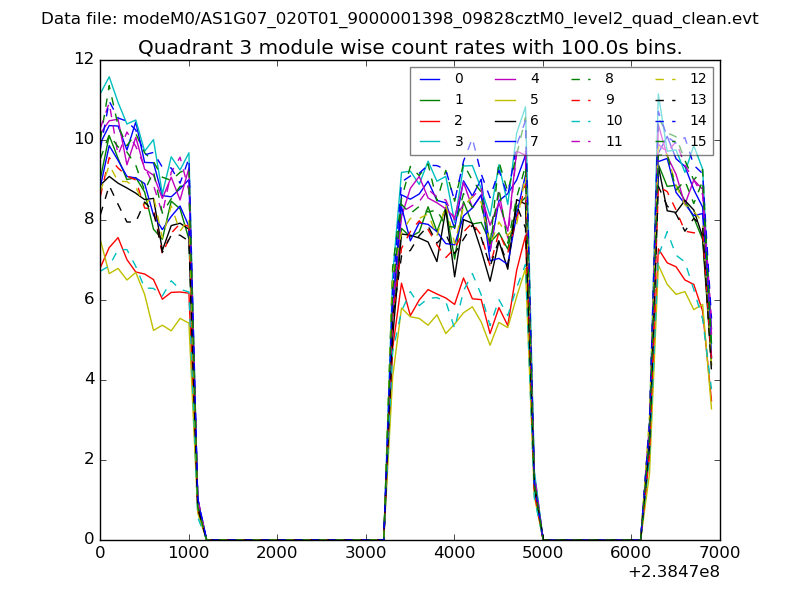
| Module-wise count rates for Quadrant C Data is divided into 100 sec bins |
 |
 |
| Module-wise count rates for Quadrant D Data is divided into 100 sec bins |
 |
 |
| Parameter | Plot |
|---|---|
| CZT HV Monitor | 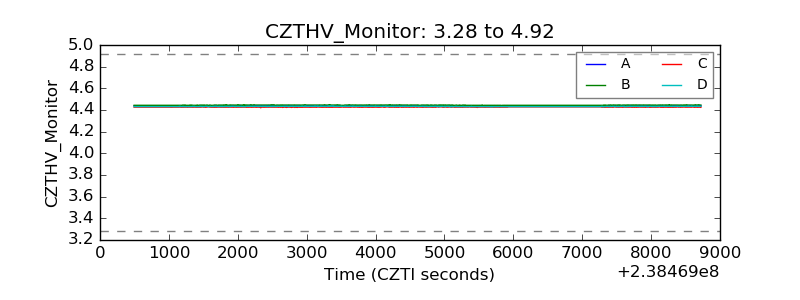 |
| D_VDD | 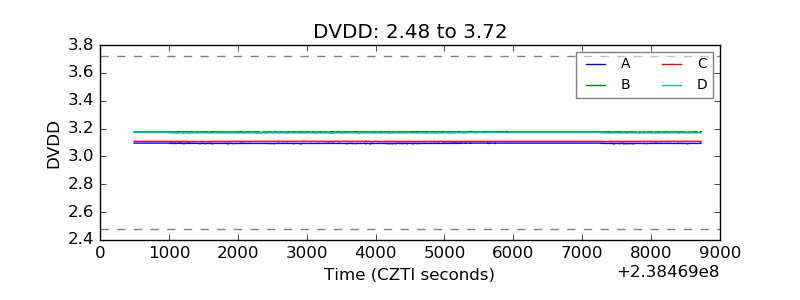 |
| Temperature 1 | 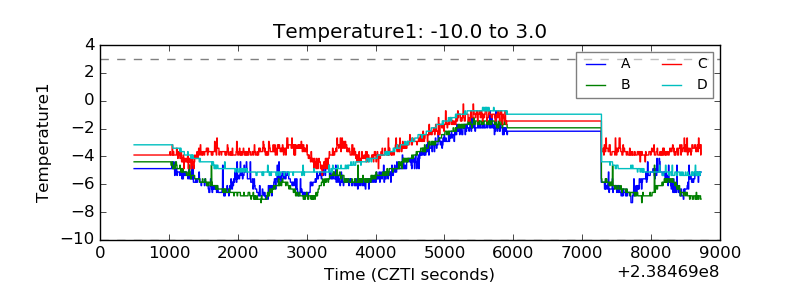 |
| Veto HV Monitor | 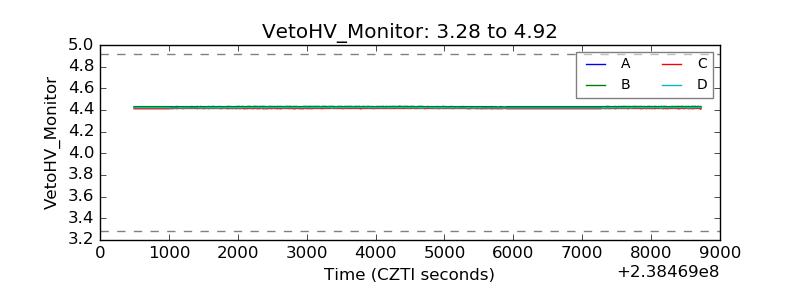 |
| Veto LLD | 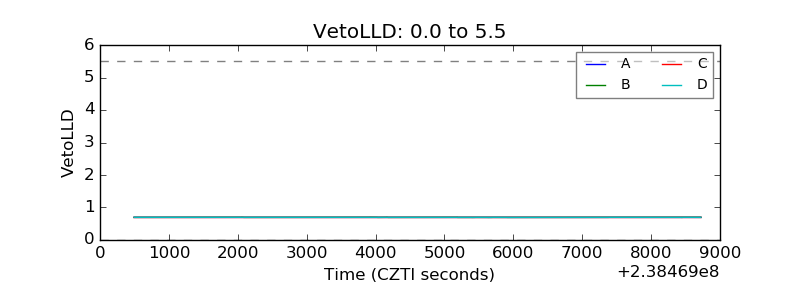 |
| Alpha Counter | 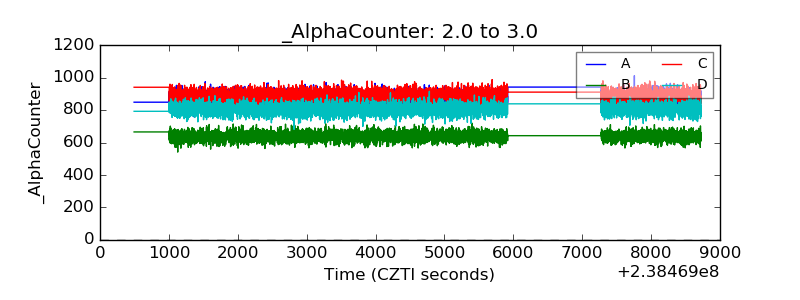 |
| _CPM_Rate | 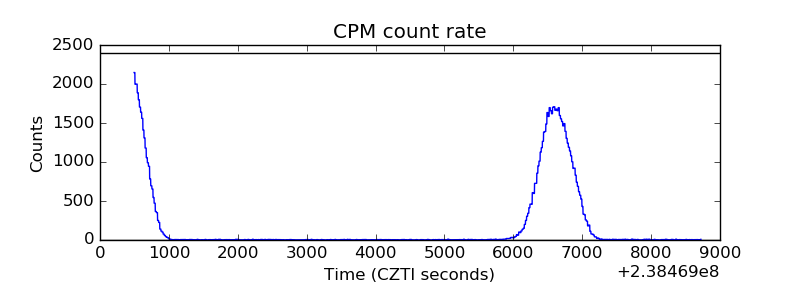 |
| CZT Counter | 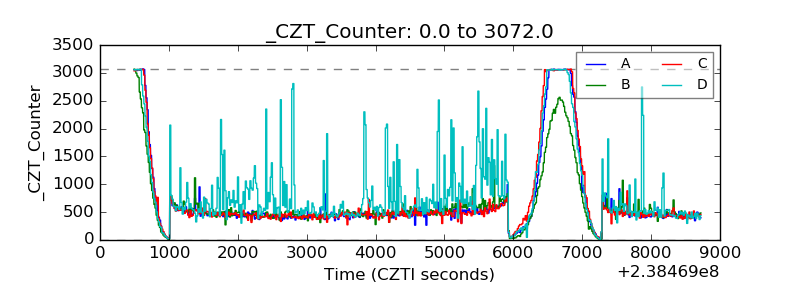 |
| +2.5 Volts monitor |  |
| +5 Volts monitor |  |
| _ROLL_ROT | 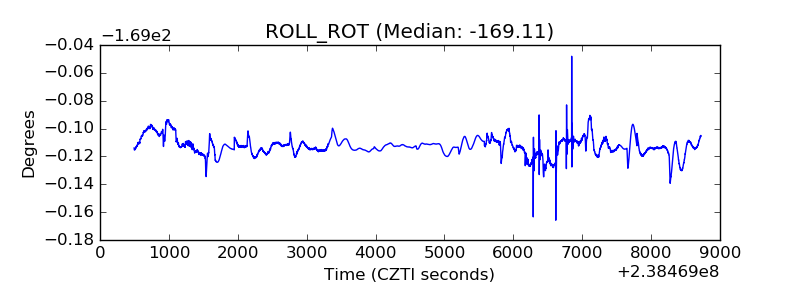 |
| _Roll_DEC |  |
| _Roll_RA | 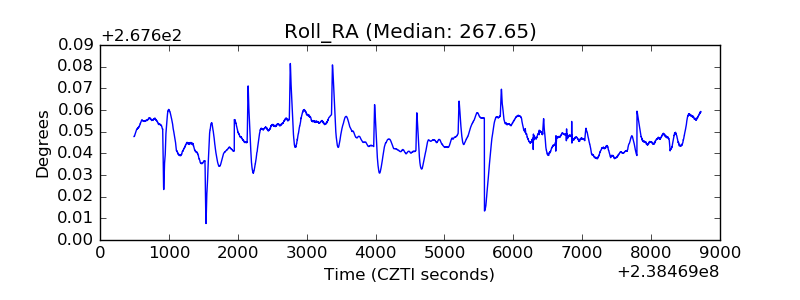 |
| Veto Counter |  |