| Param | Original file | Final file |
|---|---|---|
| Filename | modeM0/AS1G07_020T01_9000001398_09833cztM0_level2.evt | modeM0/AS1G07_020T01_9000001398_09833cztM0_level2_quad_clean.evt |
| Size (bytes) | 587,928,960 | 87,145,920 |
| Size | 560.7 MB | 83.1 MB |
| Events in quadrant A | 4,015,420 | 515,767 |
| Events in quadrant B | 4,260,538 | 522,731 |
| Events in quadrant C | 4,064,017 | 520,183 |
| Events in quadrant D | 4,888,498 | 490,438 |
| Mode M0 | |||
|---|---|---|---|
| Quadrant | BADHDUFLAG | Total packets | Discarded packets |
| A | 0 | 18110 | 331 |
| B | 0 | 18509 | 366 |
| C | 0 | 18219 | 360 |
| D | 0 | 20560 | 364 |
| Mode SS | |||
|---|---|---|---|
| Quadrant | BADHDUFLAG | Total packets | Discarded packets |
| A | 0 | 178 | 6 |
| B | 0 | 178 | 4 |
| C | 0 | 178 | 8 |
| D | 0 | 178 | 6 |
| Mode M9 | |||
|---|---|---|---|
| Quadrant | BADHDUFLAG | Total packets | Discarded packets |
| A | 0 | 2 | 0 |
| B | 0 | 2 | 0 |
| C | 0 | 2 | 0 |
| D | 0 | 2 | 0 |
| Quadrant | Total seconds | Saturated seconds | Saturation percentage |
|---|---|---|---|
| A | 8506 | 411 | 4.831883% |
| B | 8491 | 445 | 5.240843% |
| C | 8492 | 317 | 3.732925% |
| D | 8495 | 483 | 5.685697% |
Noise dominated data is calculated using 1-second bins in cleaned event files. If a bin has >2000 counts, and if more than 50% of those come from <1% of pixels, then it is considered to be noise-dominated and hence unusable.
| Quadrant | # 1 sec bins | Bins with >0 counts | Bins with >2000 counts | High rate bins dominated by noise | Noise dominated (total time) | Noise dominated (detector-on time) | Marked lightcurve |
|---|---|---|---|---|---|---|---|
| A | 8903 | 8584 | 0 | 0 | 0.00% | 0.00% | 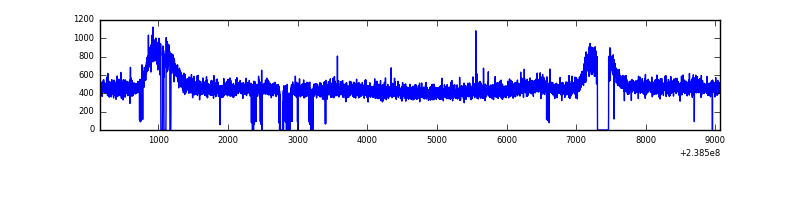 |
| B | 8903 | 8579 | 8 | 8 | 0.09% | 0.09% | 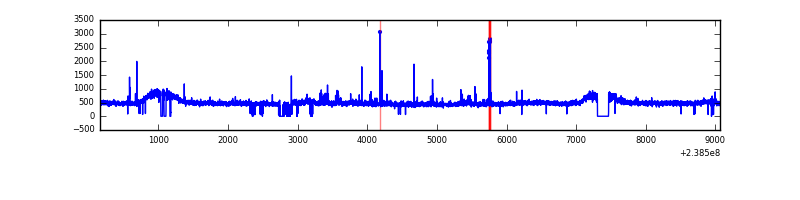 |
| C | 8903 | 8567 | 4 | 4 | 0.04% | 0.05% | 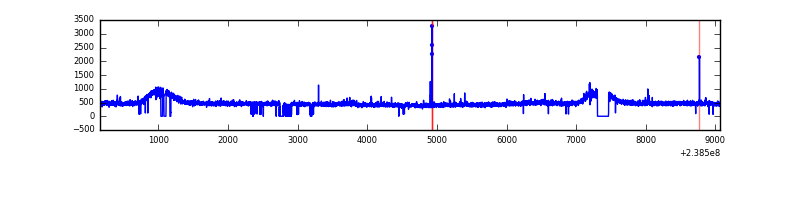 |
| D | 8903 | 8584 | 152 | 152 | 1.71% | 1.77% | 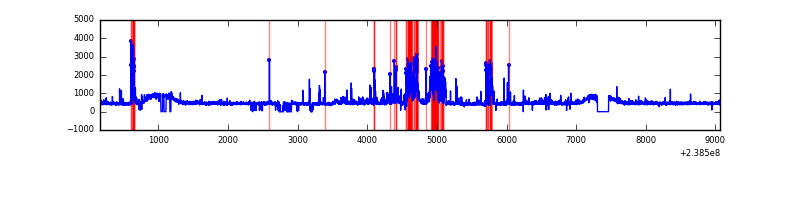 |
Top three noisy pixels from each quadrant. If the there are fewer than three noisy pixels in the level2.evt file, extra rows are filled as -1
| Pixel properties | Quadrant properties | ||||||
|---|---|---|---|---|---|---|---|
| Quadrant | DetID | PixID | Counts | Sigma | Mean | Median | Sigma |
| A | 0 | 226 | 9285 | 38.61 | 1041 | 1014 | 214.2 |
| A | 12 | 194 | 8740 | 36.07 | 1041 | 1014 | 214.2 |
| A | 13 | 253 | 6180 | 24.12 | 1041 | 1014 | 214.2 |
| B | 4 | 173 | 34076 | 162.32 | 1045 | 1013 | 203.7 |
| B | 0 | 230 | 32911 | 156.6 | 1045 | 1013 | 203.7 |
| B | 0 | 187 | 31002 | 147.23 | 1045 | 1013 | 203.7 |
| C | 0 | 207 | 37062 | 151.28 | 1022 | 1025 | 238.2 |
| C | 8 | 128 | 12406 | 47.78 | 1022 | 1025 | 238.2 |
| C | 10 | 22 | 10470 | 39.65 | 1022 | 1025 | 238.2 |
| D | 2 | 136 | 397970 | 1618.35 | 1008 | 979 | 245.3 |
| D | 2 | 152 | 173589 | 703.65 | 1008 | 979 | 245.3 |
| D | 7 | 46 | 102056 | 412.04 | 1008 | 979 | 245.3 |
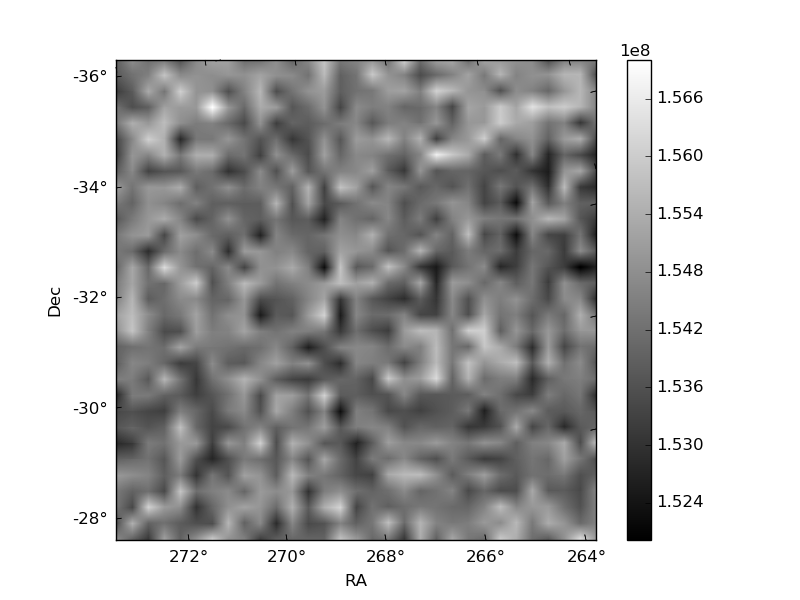
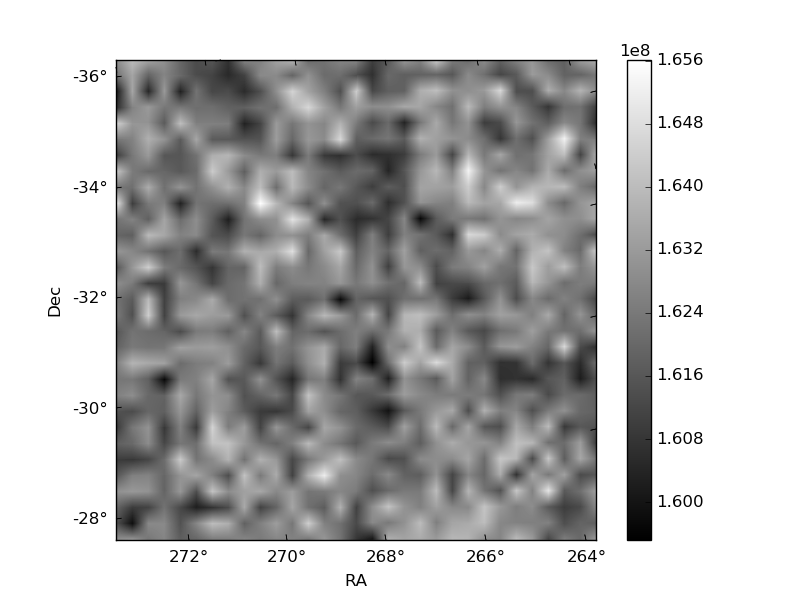
Histogram calculated using DETX and DETY for each event in the final _common_clean file
| Quadrant A | 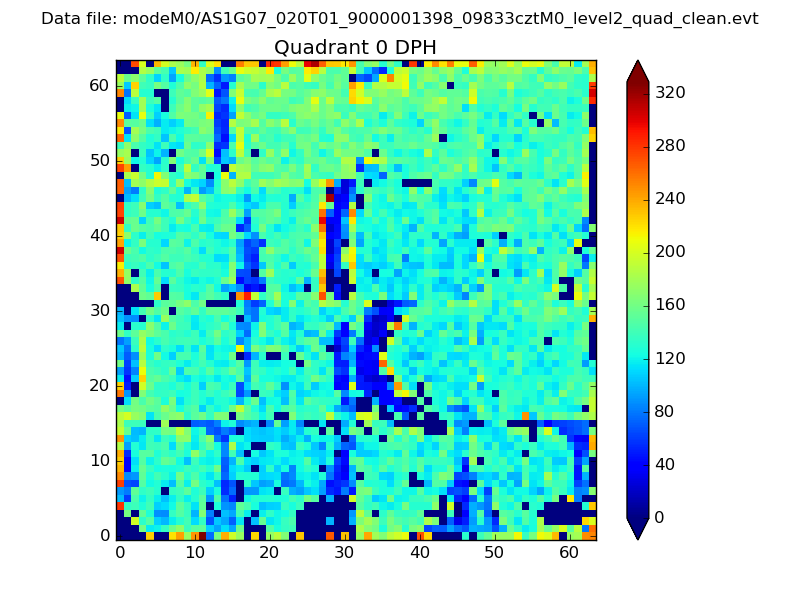 |
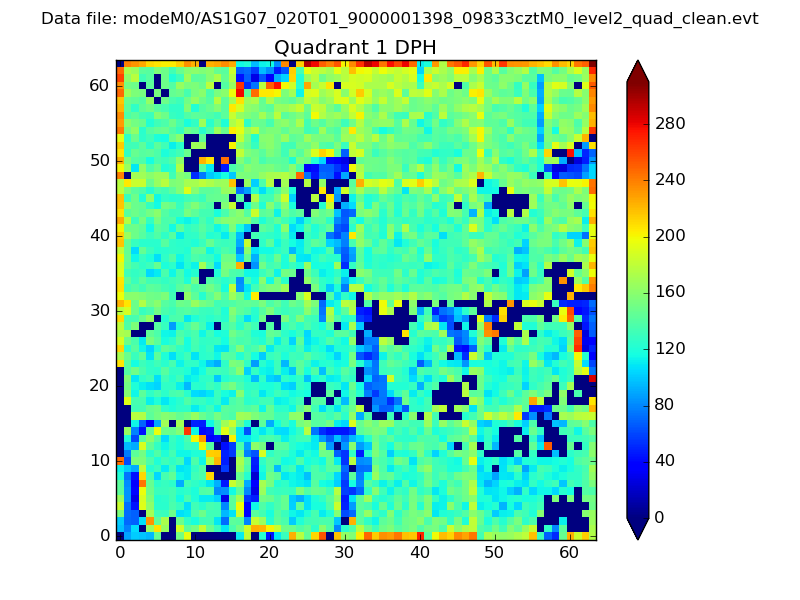 |
Quadrant B |
|---|---|---|---|
| Quadrant D | 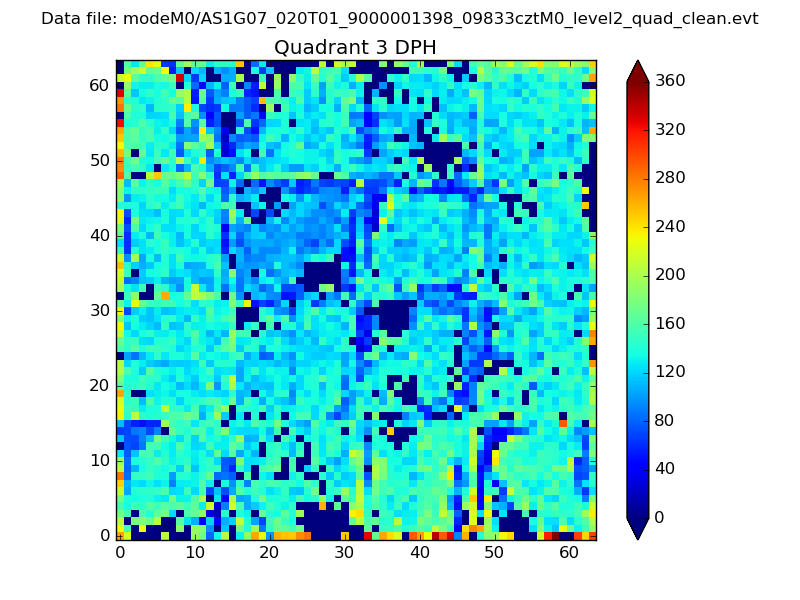 |
 |
Quadrant C |
| Plot type | Count rate plots | Images |
|---|---|---|
| Comparison with Poisson distribution Blue bars denote a histogram of data divided into 1 sec bins. Red curve is a Poisson curve with rate = median count rate of data. |
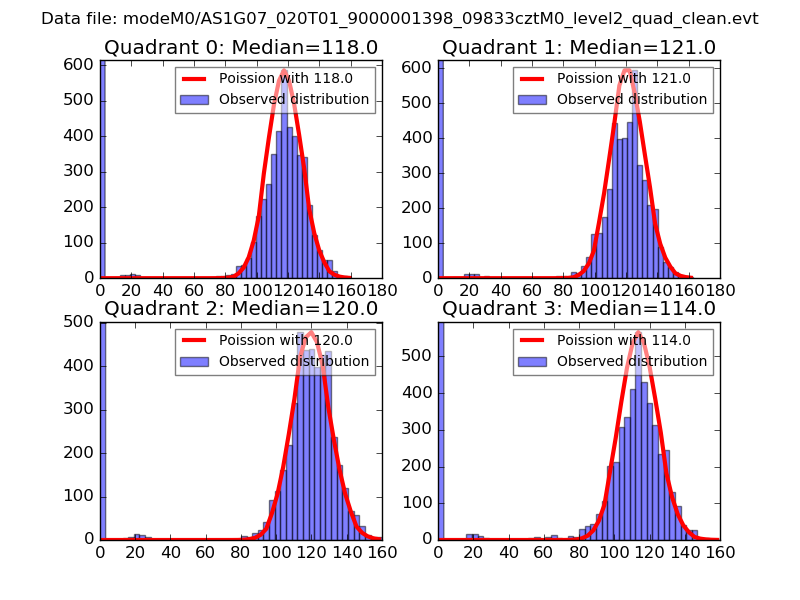 |
 |
| Quadrant-wise count rates Data is divided into 100 sec bins |
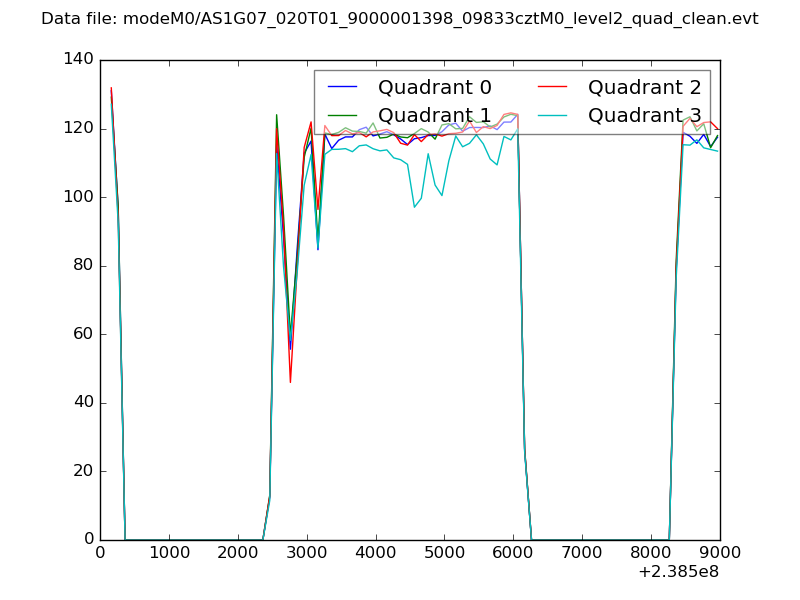 |
|
| Module-wise count rates for Quadrant A Data is divided into 100 sec bins |
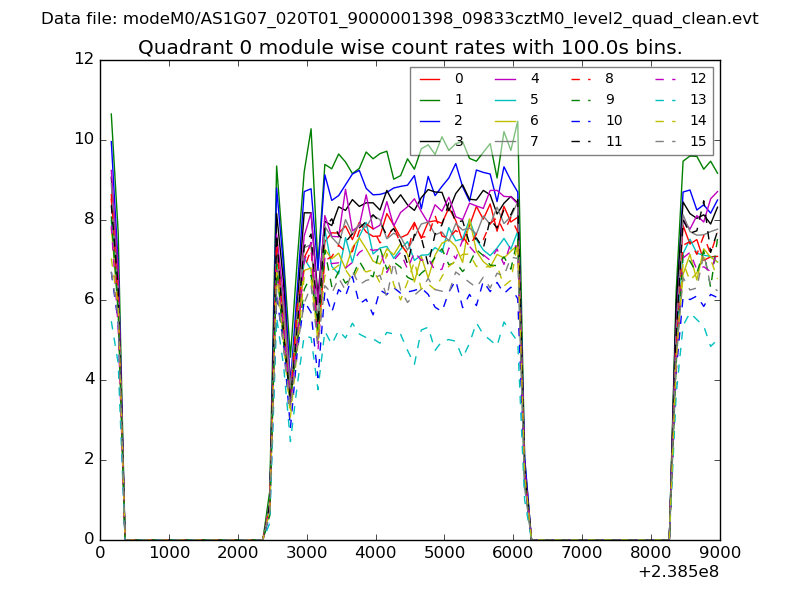 |
 |
| Module-wise count rates for Quadrant B Data is divided into 100 sec bins |
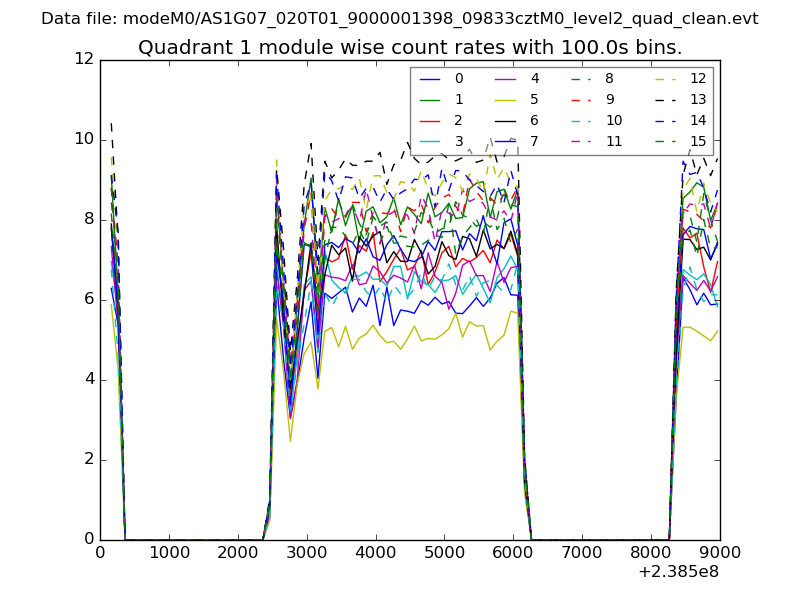 |
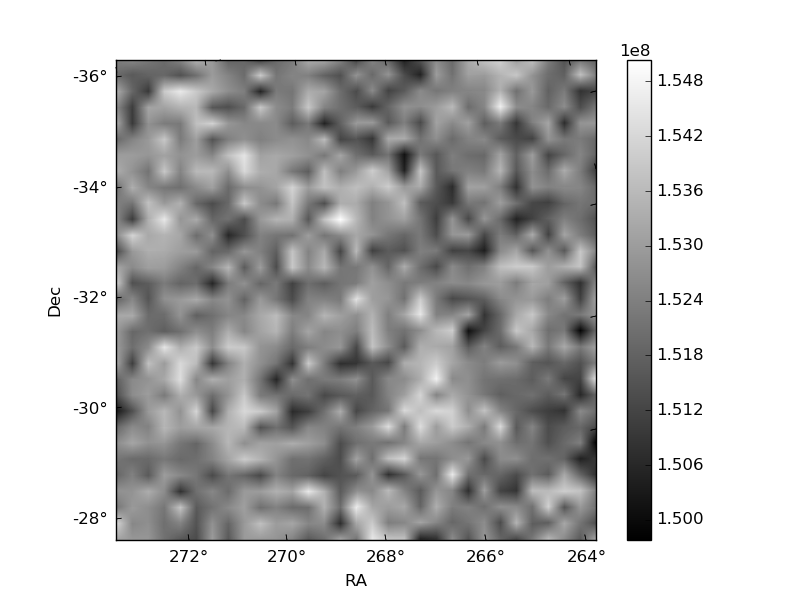 |
| Module-wise count rates for Quadrant C Data is divided into 100 sec bins |
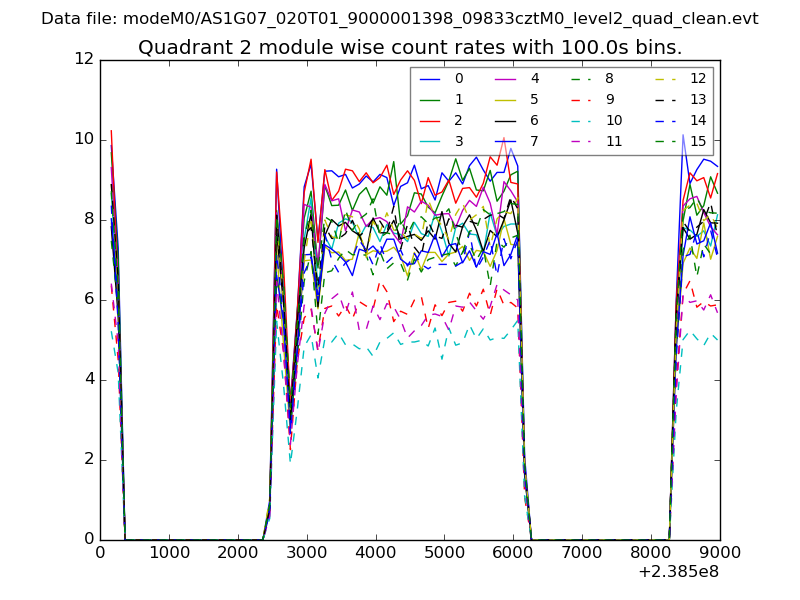 |
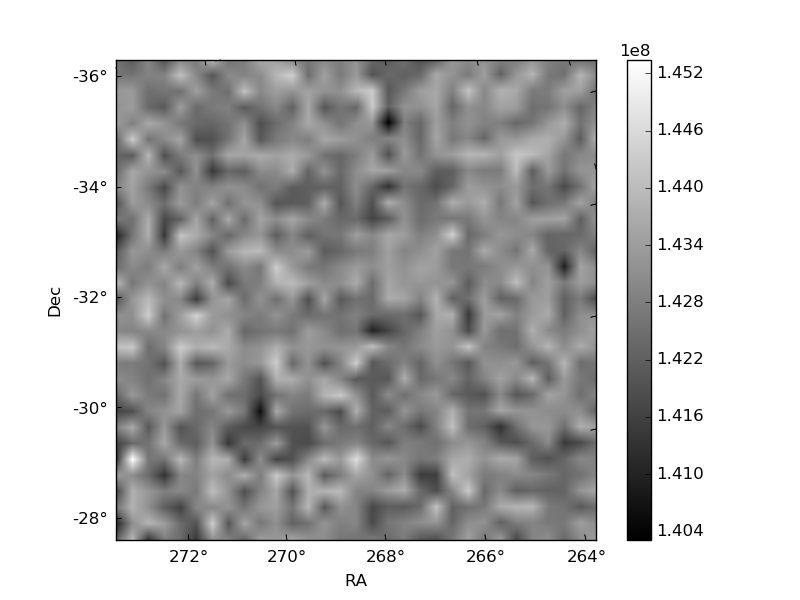 |
| Module-wise count rates for Quadrant D Data is divided into 100 sec bins |
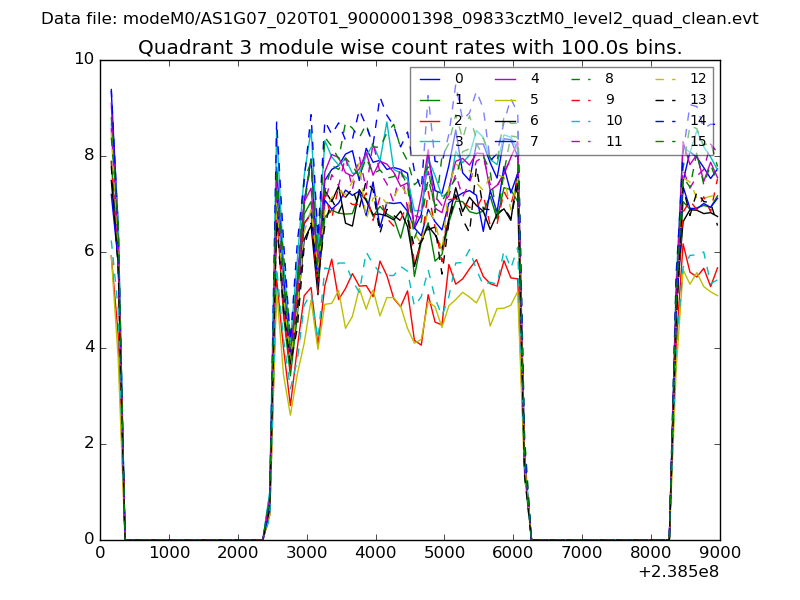 |
 |
| Parameter | Plot |
|---|---|
| CZT HV Monitor | 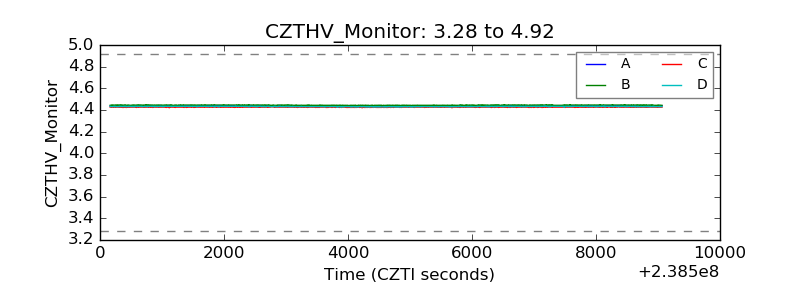 |
| D_VDD |  |
| Temperature 1 | 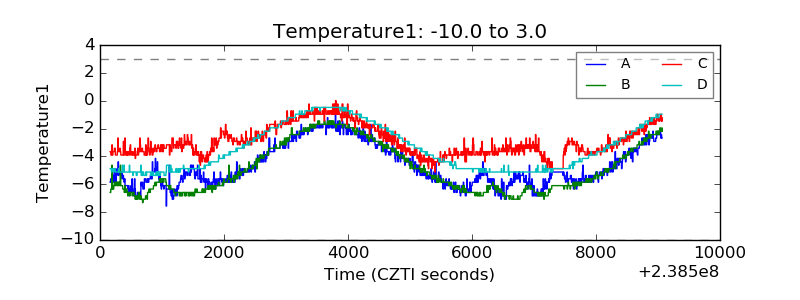 |
| Veto HV Monitor | 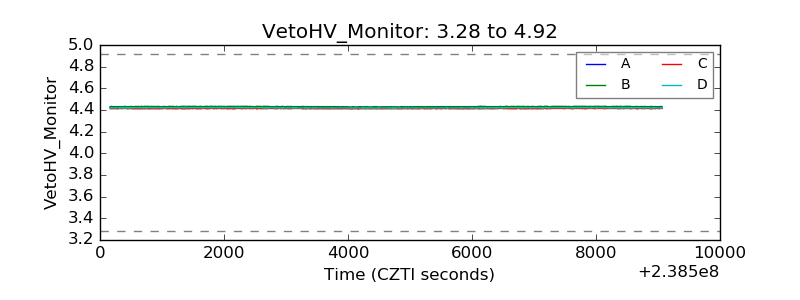 |
| Veto LLD | 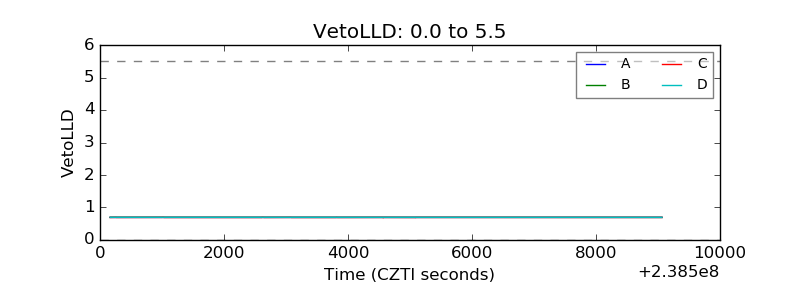 |
| Alpha Counter | 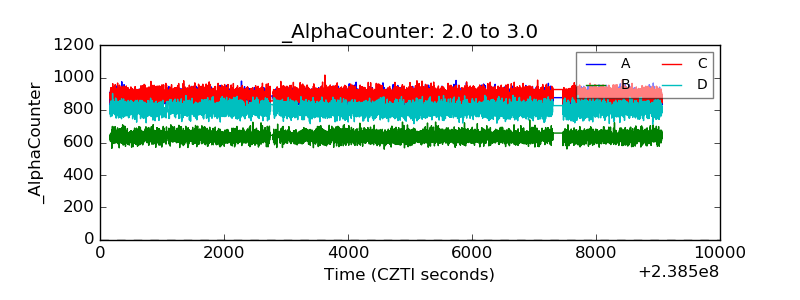 |
| _CPM_Rate | 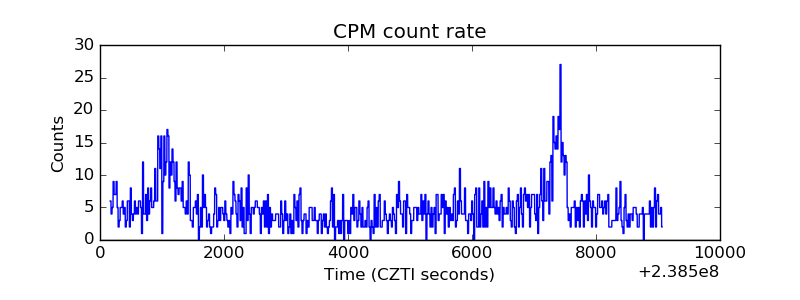 |
| CZT Counter | 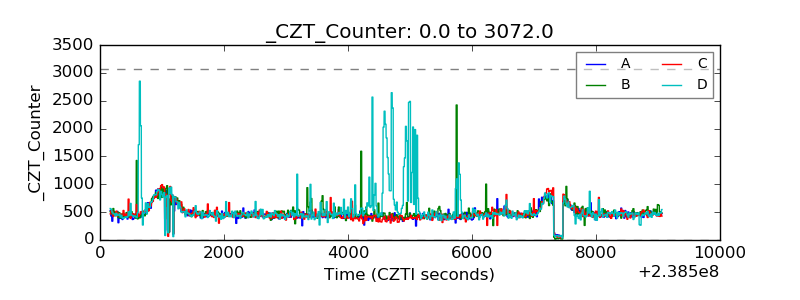 |
| +2.5 Volts monitor |  |
| +5 Volts monitor |  |
| _ROLL_ROT | 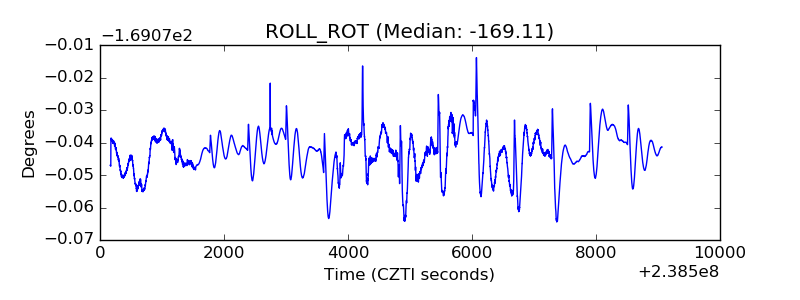 |
| _Roll_DEC |  |
| _Roll_RA |  |
| Veto Counter | 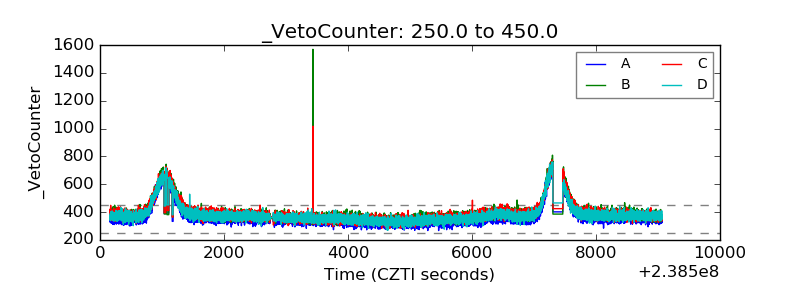 |