| Param | Original file | Final file |
|---|---|---|
| Filename | modeM0/AS1G07_020T01_9000001398_09836cztM0_level2.evt | modeM0/AS1G07_020T01_9000001398_09836cztM0_level2_quad_clean.evt |
| Size (bytes) | 1,324,632,960 | 236,252,160 |
| Size | 1.2 GB | 225.3 MB |
| Events in quadrant A | 8,692,355 | 1,479,516 |
| Events in quadrant B | 9,518,942 | 1,493,089 |
| Events in quadrant C | 8,799,001 | 1,481,011 |
| Events in quadrant D | 11,822,084 | 1,393,465 |
| Mode M0 | |||
|---|---|---|---|
| Quadrant | BADHDUFLAG | Total packets | Discarded packets |
| A | 0 | 38949 | 25 |
| B | 0 | 40849 | 37 |
| C | 0 | 39592 | 27 |
| D | 0 | 48284 | 49 |
| Mode SS | |||
|---|---|---|---|
| Quadrant | BADHDUFLAG | Total packets | Discarded packets |
| A | 0 | 390 | 0 |
| B | 0 | 390 | 0 |
| C | 0 | 390 | 0 |
| D | 0 | 390 | 2 |
| Mode M9 | |||
|---|---|---|---|
| Quadrant | BADHDUFLAG | Total packets | Discarded packets |
| A | 0 | 20 | 0 |
| B | 0 | 20 | 0 |
| C | 0 | 20 | 0 |
| D | 0 | 19 | 0 |
| Quadrant | Total seconds | Saturated seconds | Saturation percentage |
|---|---|---|---|
| A | 18987 | 321 | 1.690630% |
| B | 18982 | 372 | 1.959751% |
| C | 18987 | 241 | 1.269290% |
| D | 18984 | 837 | 4.408976% |
Noise dominated data is calculated using 1-second bins in cleaned event files. If a bin has >2000 counts, and if more than 50% of those come from <1% of pixels, then it is considered to be noise-dominated and hence unusable.
| Quadrant | # 1 sec bins | Bins with >0 counts | Bins with >2000 counts | High rate bins dominated by noise | Noise dominated (total time) | Noise dominated (detector-on time) | Marked lightcurve |
|---|---|---|---|---|---|---|---|
| A | 21107 | 19001 | 0 | 0 | 0.00% | 0.00% | 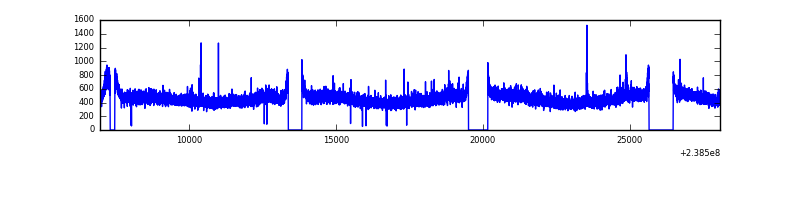 |
| B | 21107 | 19001 | 34 | 34 | 0.16% | 0.18% | 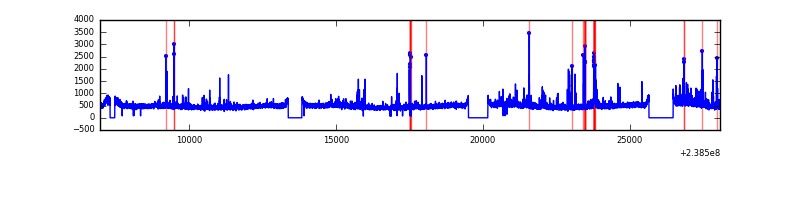 |
| C | 21107 | 19001 | 31 | 31 | 0.15% | 0.16% | 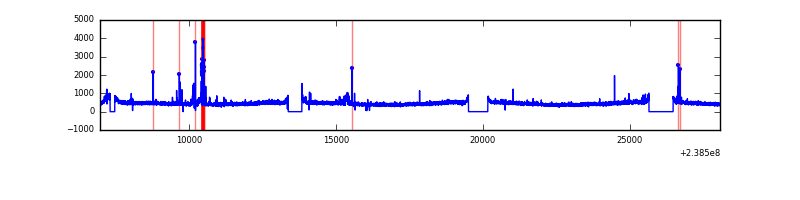 |
| D | 21107 | 19001 | 582 | 582 | 2.76% | 3.06% | 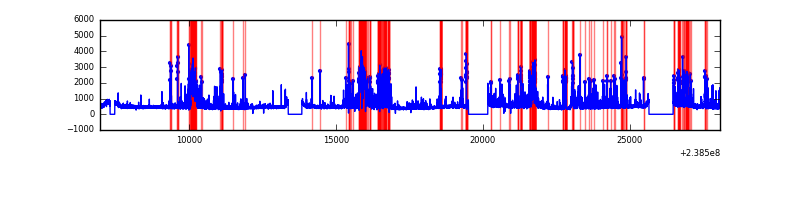 |
Top three noisy pixels from each quadrant. If the there are fewer than three noisy pixels in the level2.evt file, extra rows are filled as -1
| Pixel properties | Quadrant properties | ||||||
|---|---|---|---|---|---|---|---|
| Quadrant | DetID | PixID | Counts | Sigma | Mean | Median | Sigma |
| A | 8 | 15 | 31872 | 65.49 | 2237 | 2184 | 453.3 |
| A | 0 | 226 | 20701 | 40.85 | 2237 | 2184 | 453.3 |
| A | 15 | 174 | 19268 | 37.69 | 2237 | 2184 | 453.3 |
| B | 0 | 214 | 180626 | 415.41 | 2248 | 2191 | 429.5 |
| B | 4 | 239 | 126790 | 290.08 | 2248 | 2191 | 429.5 |
| B | 0 | 85 | 119329 | 272.71 | 2248 | 2191 | 429.5 |
| C | 10 | 22 | 276880 | 546.32 | 2173 | 2184 | 502.8 |
| C | 14 | 234 | 25822 | 47.01 | 2173 | 2184 | 502.8 |
| C | 13 | 61 | 16412 | 28.3 | 2173 | 2184 | 502.8 |
| D | 2 | 136 | 1479934 | 2833.57 | 2138 | 2083 | 521.6 |
| D | 1 | 52 | 906492 | 1734.07 | 2138 | 2083 | 521.6 |
| D | 2 | 152 | 484663 | 925.28 | 2138 | 2083 | 521.6 |
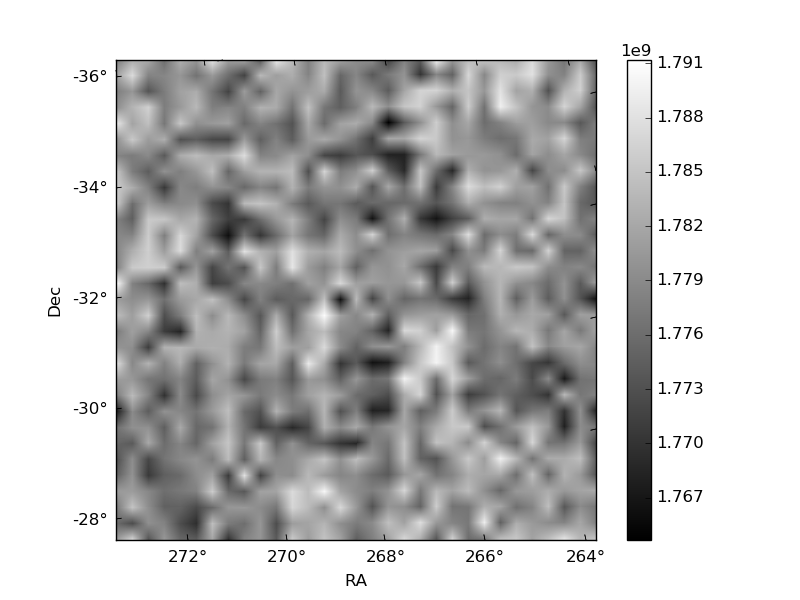
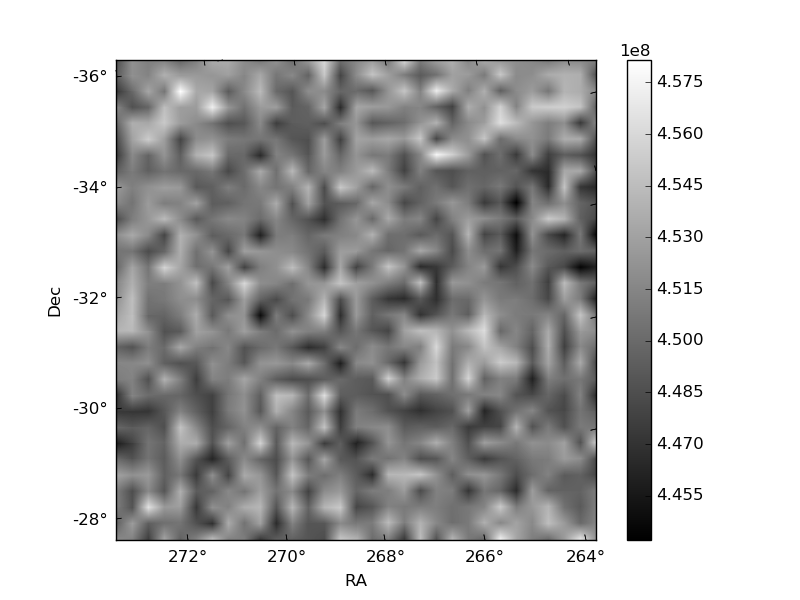
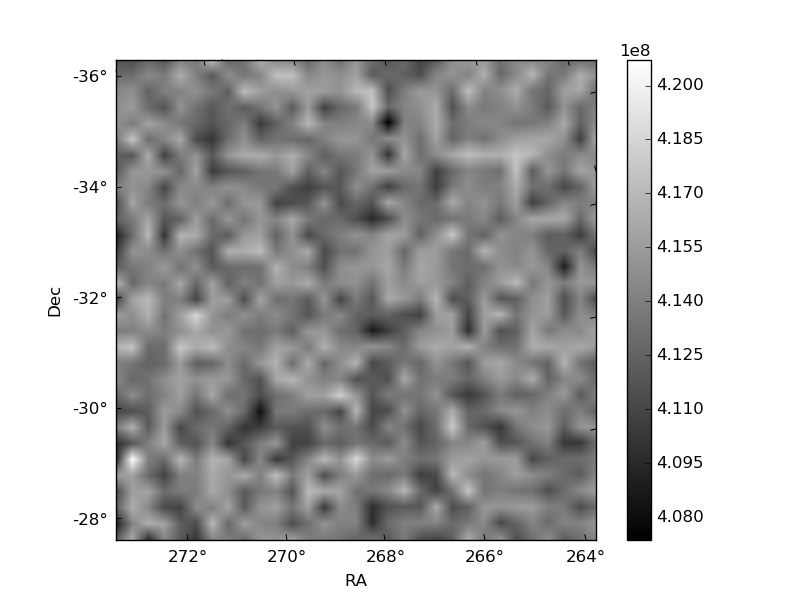
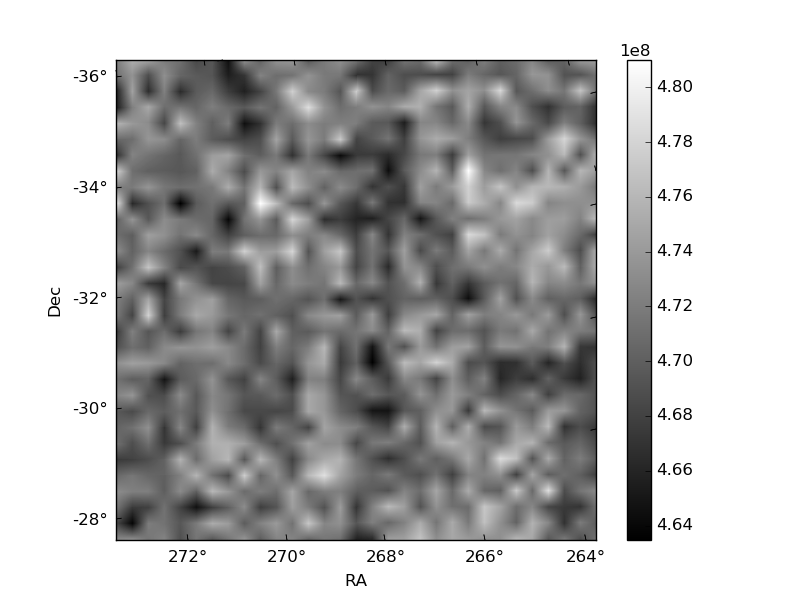
Histogram calculated using DETX and DETY for each event in the final _common_clean file
| Quadrant A | 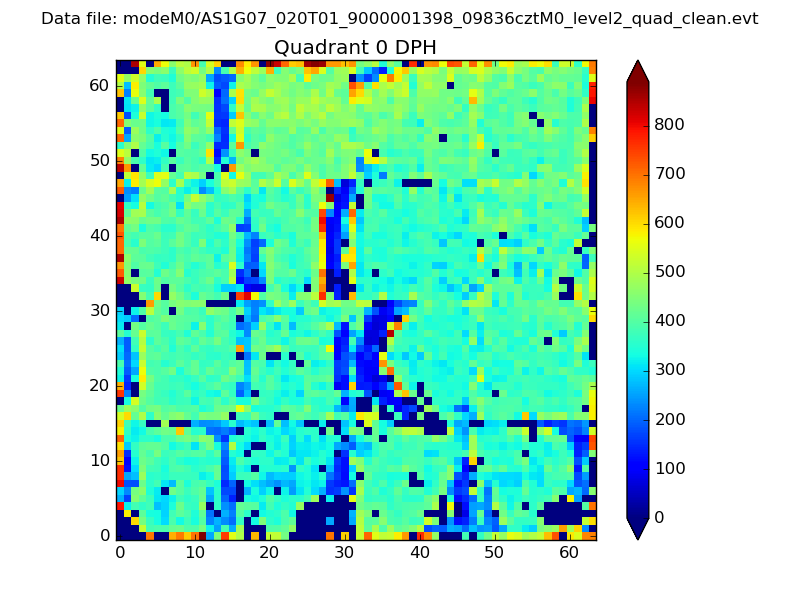 |
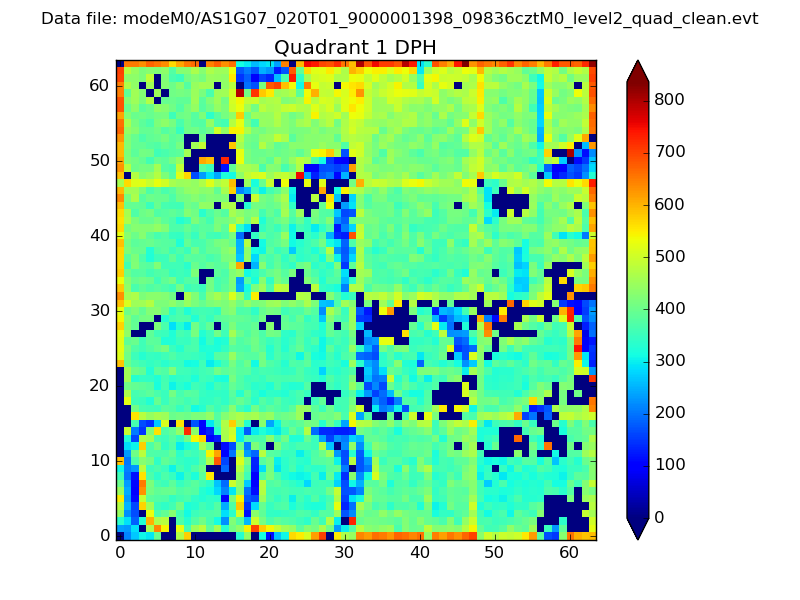 |
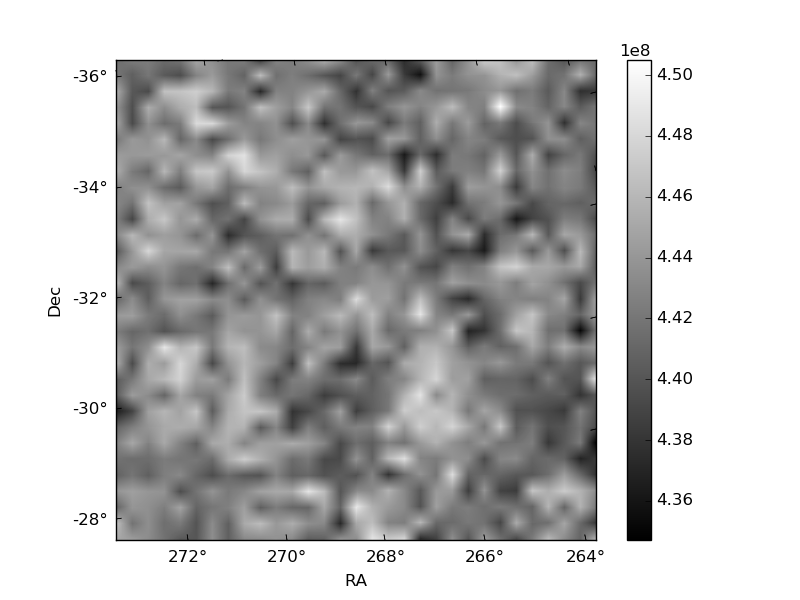
Quadrant B |
|---|---|---|---|
| Quadrant D | 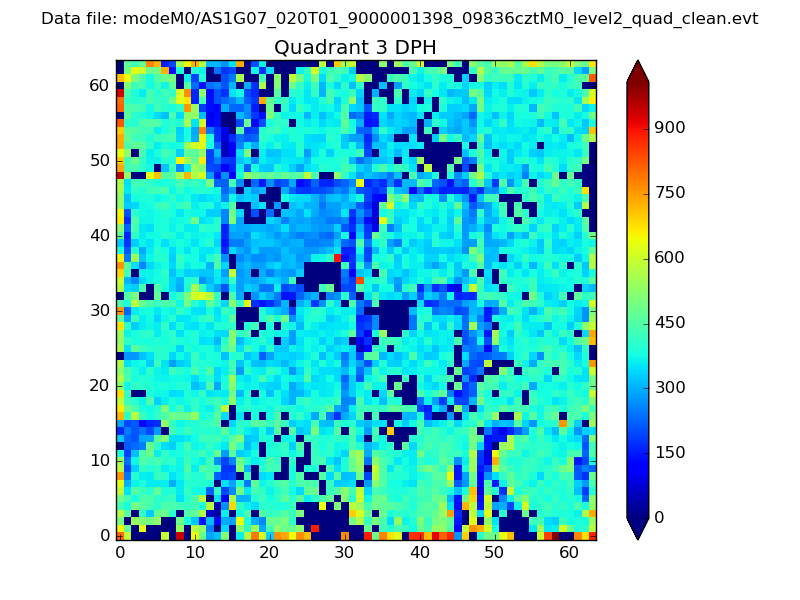 |
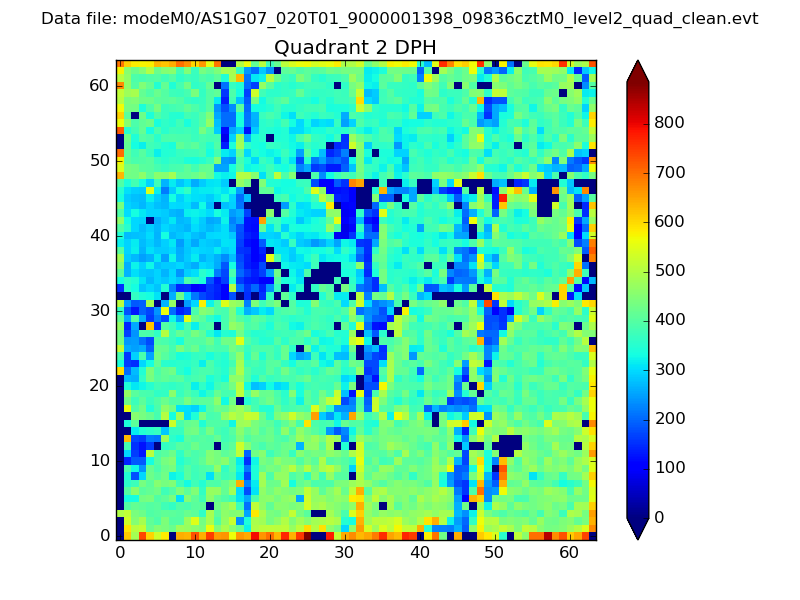 |
Quadrant C |
| Plot type | Count rate plots | Images |
|---|---|---|
| Comparison with Poisson distribution Blue bars denote a histogram of data divided into 1 sec bins. Red curve is a Poisson curve with rate = median count rate of data. |
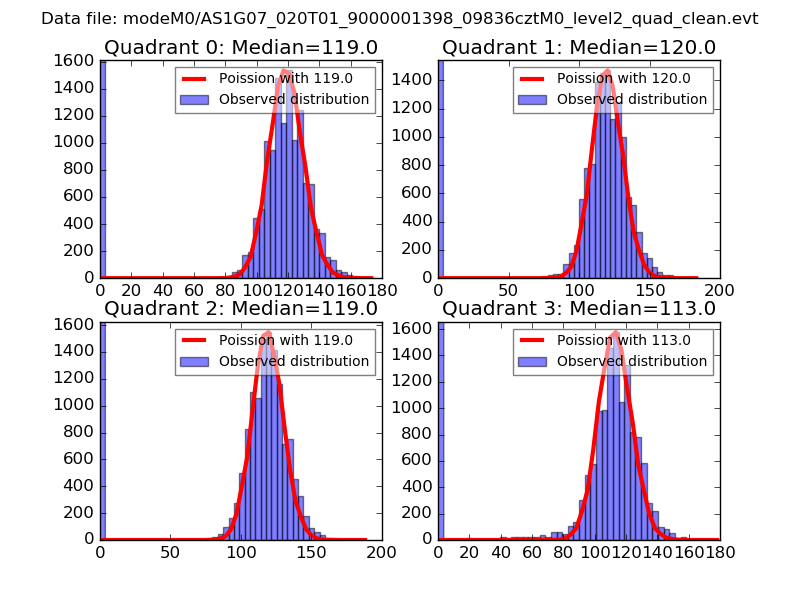 |
 |
| Quadrant-wise count rates Data is divided into 100 sec bins |
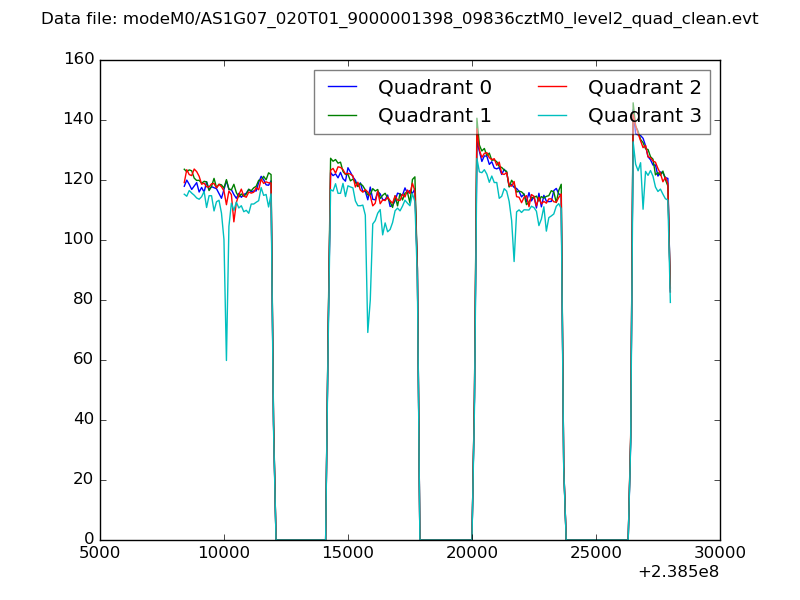 |
|
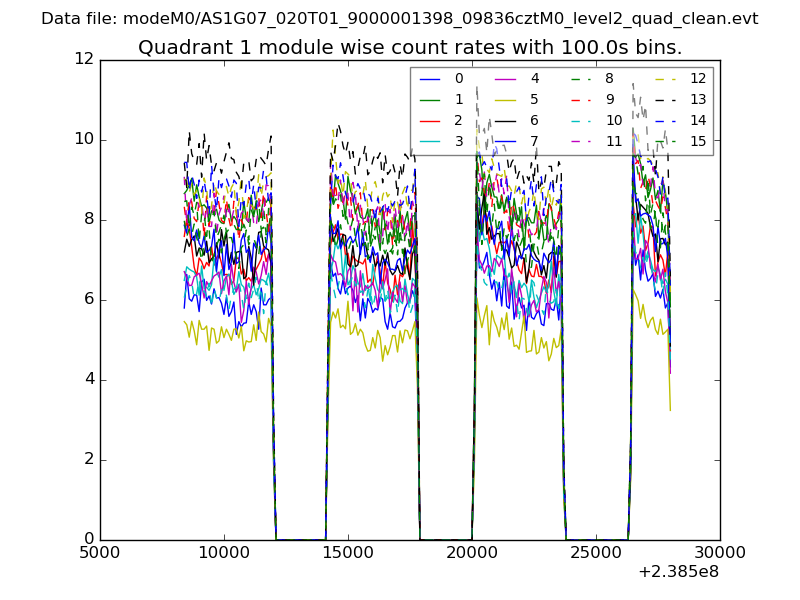
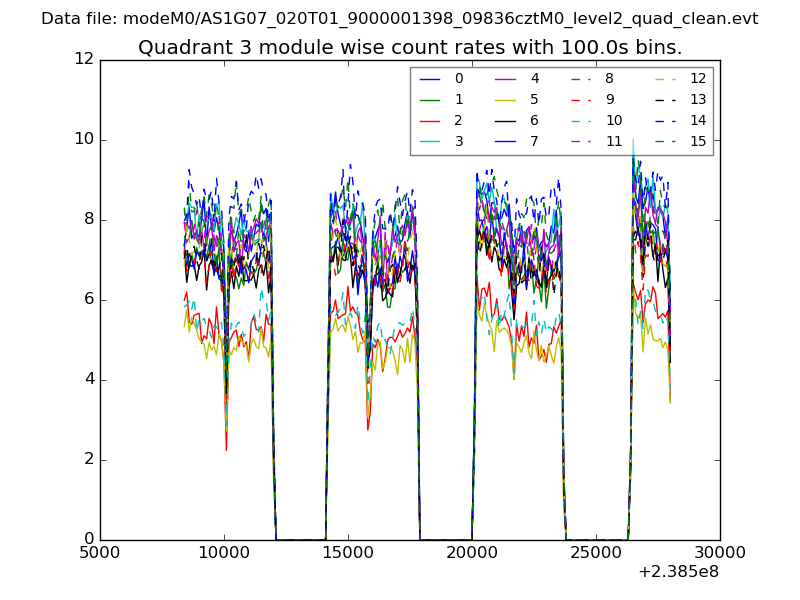
| Module-wise count rates for Quadrant A Data is divided into 100 sec bins |
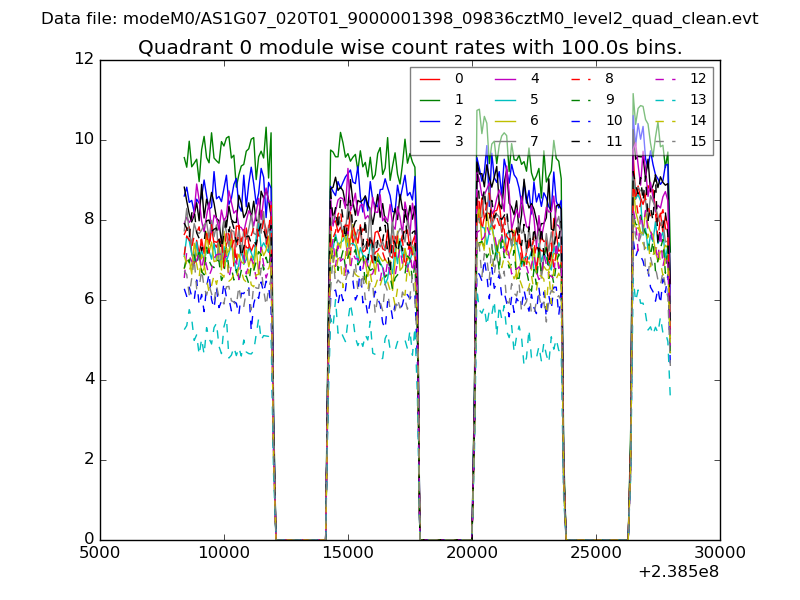 |
 |
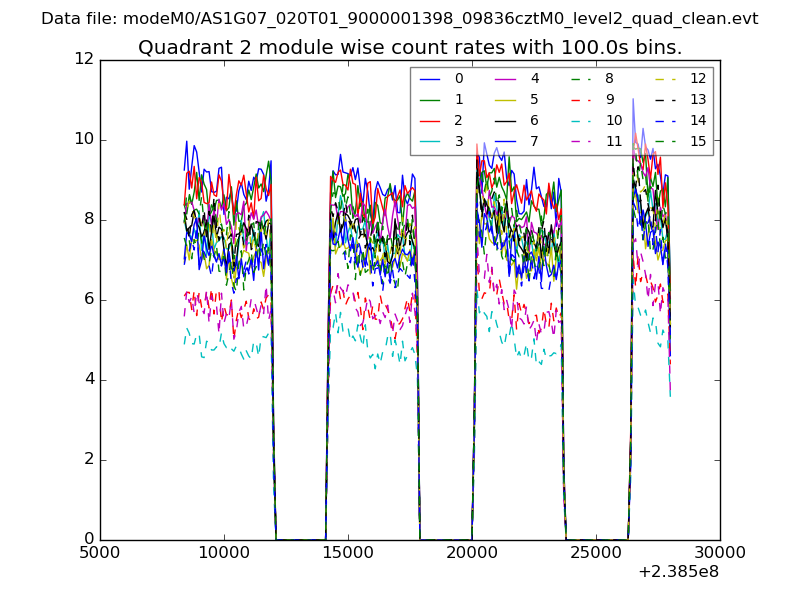
| Module-wise count rates for Quadrant B Data is divided into 100 sec bins |
 |
 |
| Module-wise count rates for Quadrant C Data is divided into 100 sec bins |
 |
 |
| Module-wise count rates for Quadrant D Data is divided into 100 sec bins |
 |
 |
| Parameter | Plot |
|---|---|
| CZT HV Monitor | 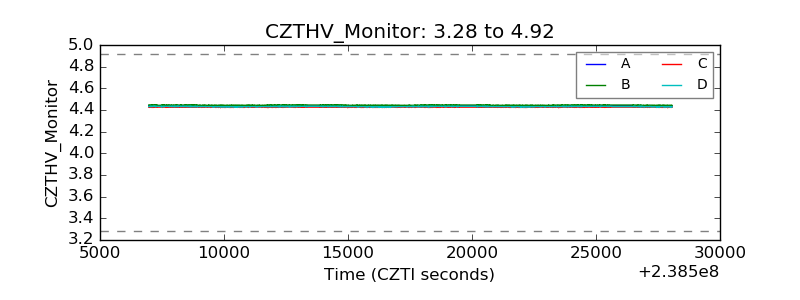 |
| D_VDD | 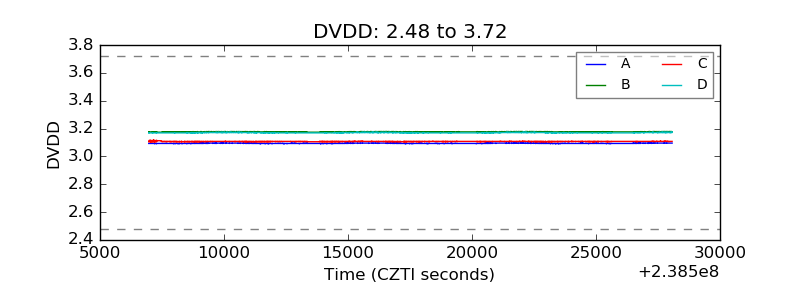 |
| Temperature 1 | 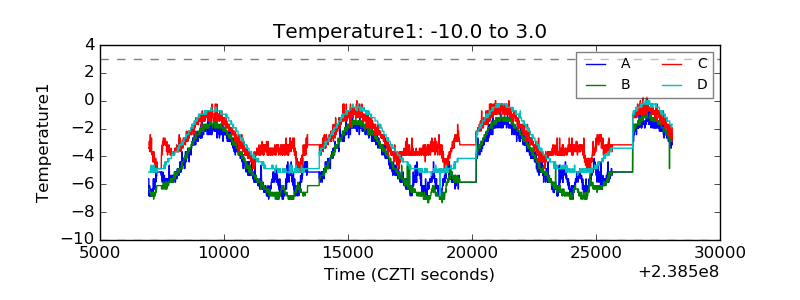 |
| Veto HV Monitor | 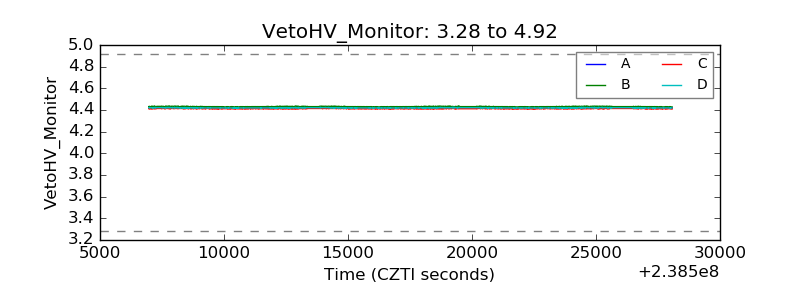 |
| Veto LLD |  |
| Alpha Counter | 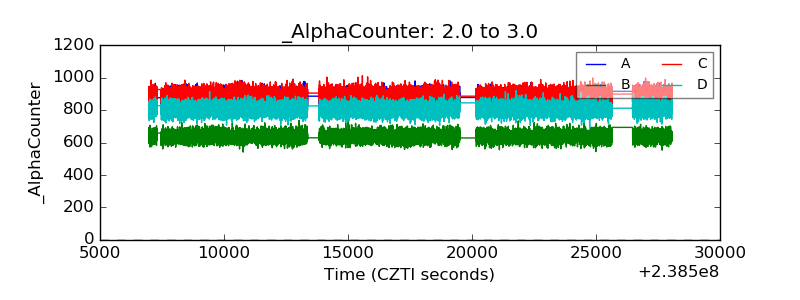 |
| _CPM_Rate | 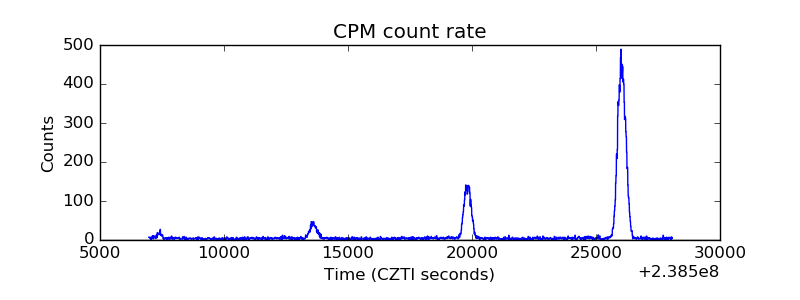 |
| CZT Counter | 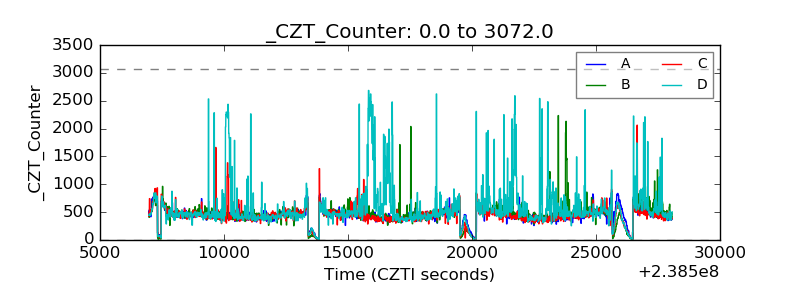 |
| +2.5 Volts monitor | 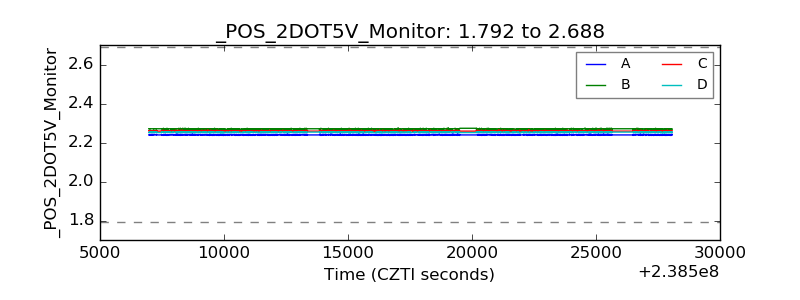 |
| +5 Volts monitor |  |
| _ROLL_ROT | 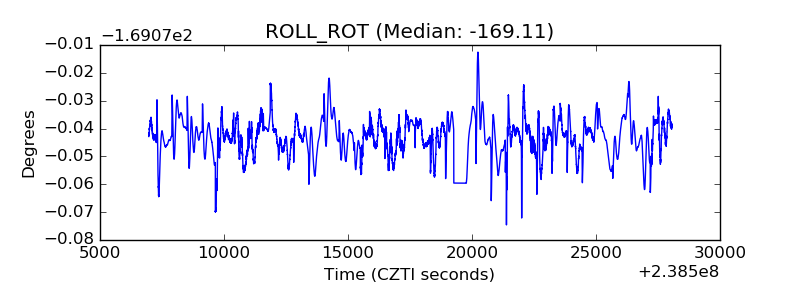 |
| _Roll_DEC | 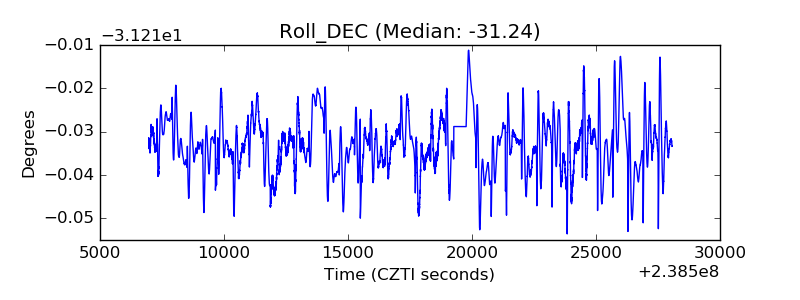 |
| _Roll_RA | 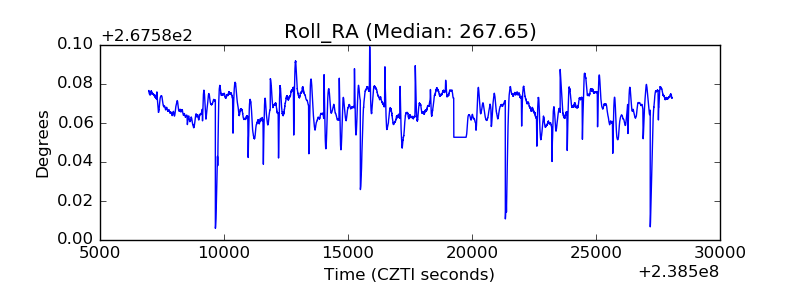 |
| Veto Counter | 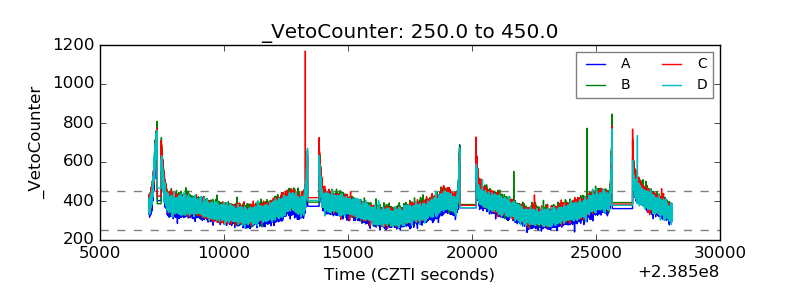 |