| Param | Original file | Final file |
|---|---|---|
| Filename | modeM0/AS1G07_020T01_9000001398_09837cztM0_level2.evt | modeM0/AS1G07_020T01_9000001398_09837cztM0_level2_quad_clean.evt |
| Size (bytes) | 464,889,600 | 83,545,920 |
| Size | 443.4 MB | 79.7 MB |
| Events in quadrant A | 2,967,142 | 529,525 |
| Events in quadrant B | 3,534,154 | 529,649 |
| Events in quadrant C | 2,923,712 | 527,030 |
| Events in quadrant D | 4,215,000 | 492,646 |
| Mode M0 | |||
|---|---|---|---|
| Quadrant | BADHDUFLAG | Total packets | Discarded packets |
| A | 0 | 13262 | 2 |
| B | 0 | 14754 | 1 |
| C | 0 | 13255 | 1 |
| D | 0 | 16973 | 1 |
| Mode SS | |||
|---|---|---|---|
| Quadrant | BADHDUFLAG | Total packets | Discarded packets |
| A | 0 | 132 | 0 |
| B | 0 | 132 | 0 |
| C | 0 | 132 | 0 |
| D | 0 | 132 | 0 |
| Mode M9 | |||
|---|---|---|---|
| Quadrant | BADHDUFLAG | Total packets | Discarded packets |
| A | 0 | 10 | 0 |
| B | 0 | 10 | 0 |
| C | 0 | 10 | 0 |
| D | 0 | 10 | 0 |
| Quadrant | Total seconds | Saturated seconds | Saturation percentage |
|---|---|---|---|
| A | 6465 | 40 | 0.618716% |
| B | 6465 | 79 | 1.221964% |
| C | 6465 | 34 | 0.525909% |
| D | 6465 | 204 | 3.155452% |
Noise dominated data is calculated using 1-second bins in cleaned event files. If a bin has >2000 counts, and if more than 50% of those come from <1% of pixels, then it is considered to be noise-dominated and hence unusable.
| Quadrant | # 1 sec bins | Bins with >0 counts | Bins with >2000 counts | High rate bins dominated by noise | Noise dominated (total time) | Noise dominated (detector-on time) | Marked lightcurve |
|---|---|---|---|---|---|---|---|
| A | 7455 | 6466 | 0 | 0 | 0.00% | 0.00% | 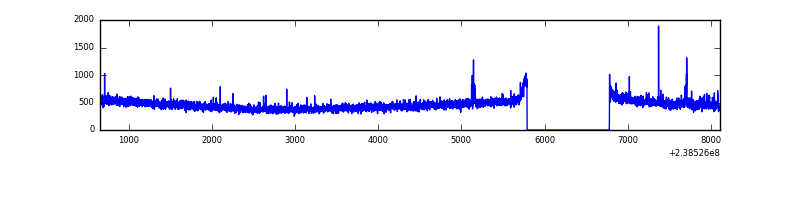 |
| B | 7455 | 6466 | 34 | 34 | 0.46% | 0.53% | 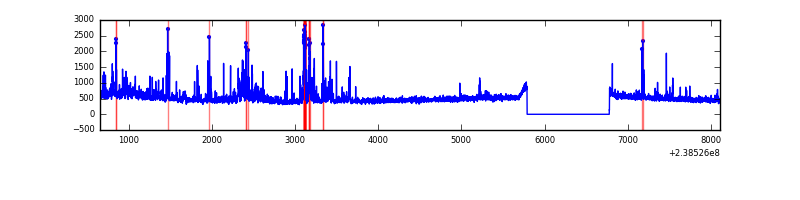 |
| C | 7455 | 6466 | 4 | 4 | 0.05% | 0.06% | 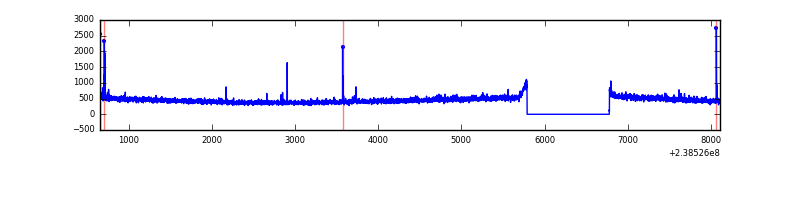 |
| D | 7455 | 6466 | 157 | 157 | 2.11% | 2.43% | 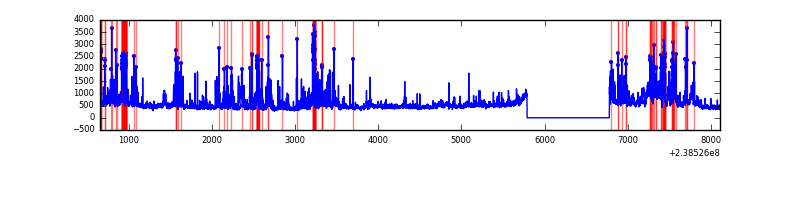 |
Top three noisy pixels from each quadrant. If the there are fewer than three noisy pixels in the level2.evt file, extra rows are filled as -1
| Pixel properties | Quadrant properties | ||||||
|---|---|---|---|---|---|---|---|
| Quadrant | DetID | PixID | Counts | Sigma | Mean | Median | Sigma |
| A | 4 | 2 | 25211 | 158.01 | 763 | 747 | 154.8 |
| A | 0 | 226 | 7135 | 41.26 | 763 | 747 | 154.8 |
| A | 12 | 194 | 6424 | 36.67 | 763 | 747 | 154.8 |
| B | 0 | 85 | 323996 | 2185.96 | 765 | 747 | 147.9 |
| B | 0 | 214 | 98659 | 662.13 | 765 | 747 | 147.9 |
| B | 4 | 239 | 67685 | 452.67 | 765 | 747 | 147.9 |
| C | 4 | 254 | 21123 | 119.87 | 733 | 736 | 170.1 |
| C | 14 | 234 | 20193 | 114.4 | 733 | 736 | 170.1 |
| C | 0 | 207 | 15893 | 89.12 | 733 | 736 | 170.1 |
| D | 1 | 52 | 573719 | 3041.27 | 724 | 705 | 188.4 |
| D | 2 | 136 | 361074 | 1912.66 | 724 | 705 | 188.4 |
| D | 12 | 233 | 266293 | 1409.61 | 724 | 705 | 188.4 |
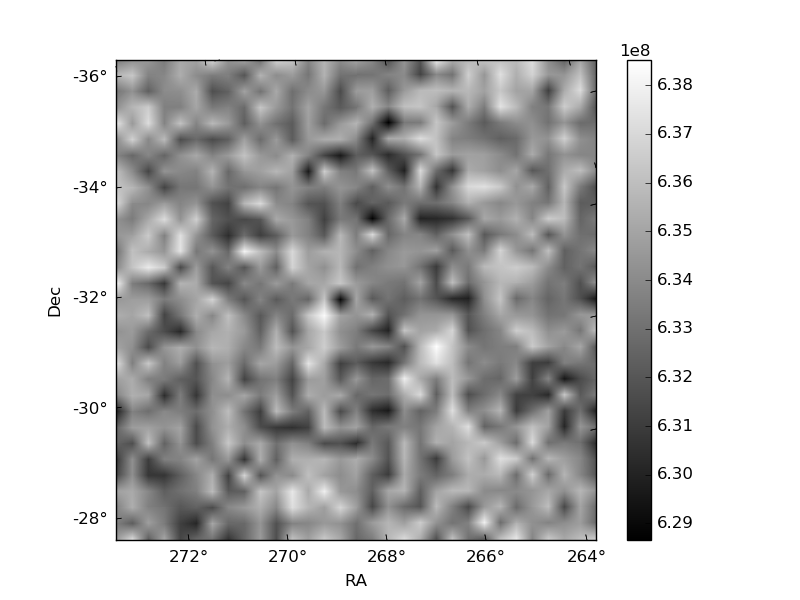
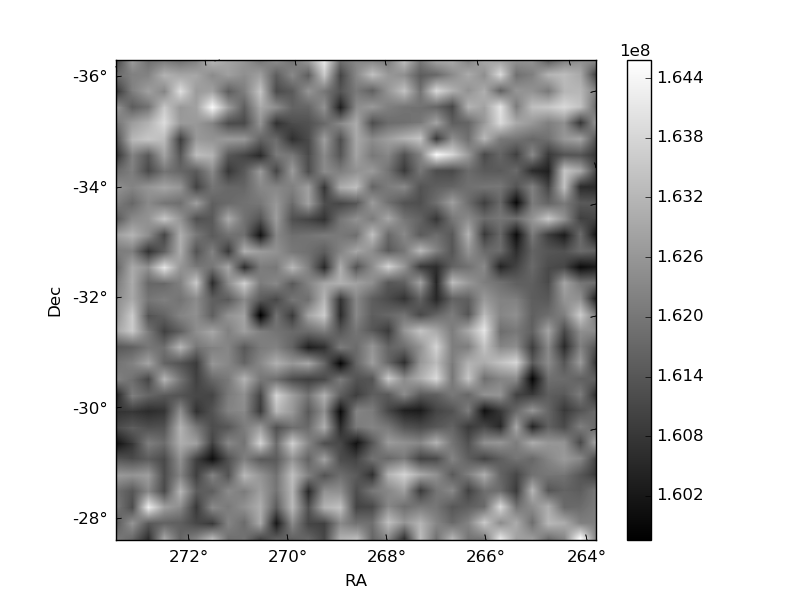
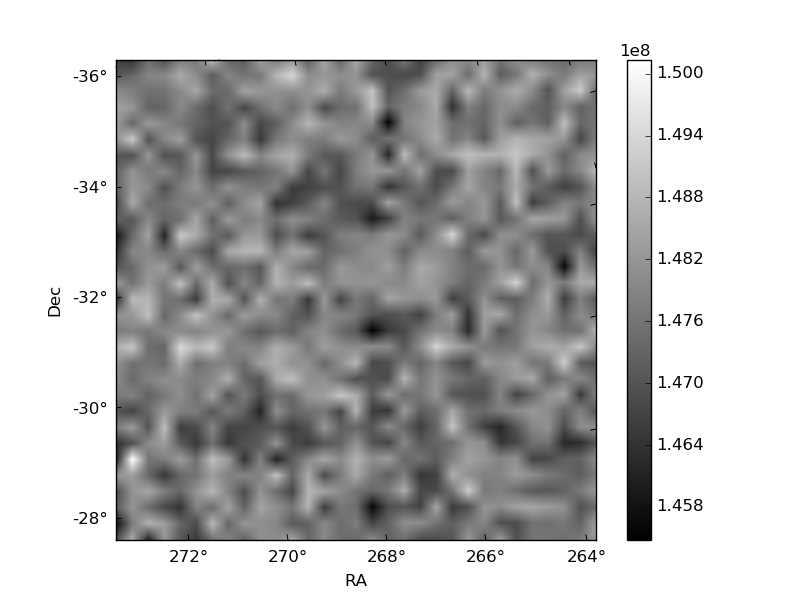
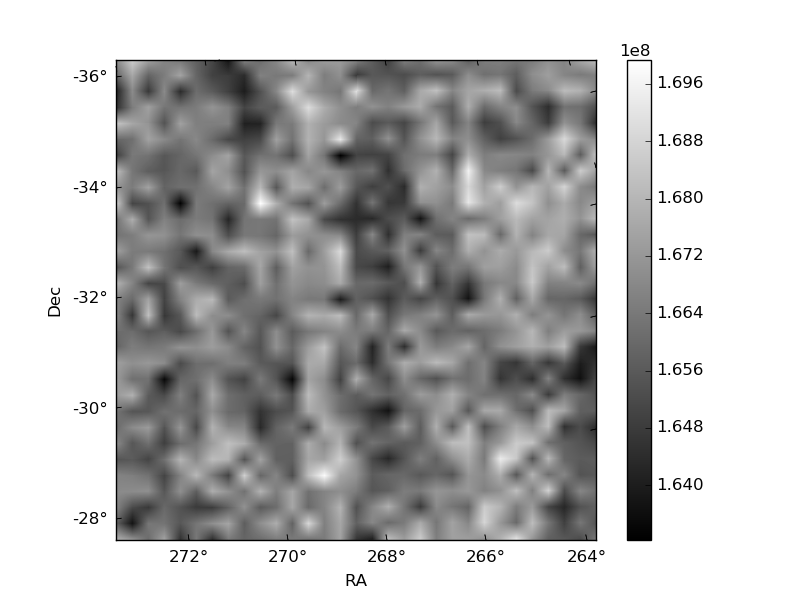
Histogram calculated using DETX and DETY for each event in the final _common_clean file
| Quadrant A | 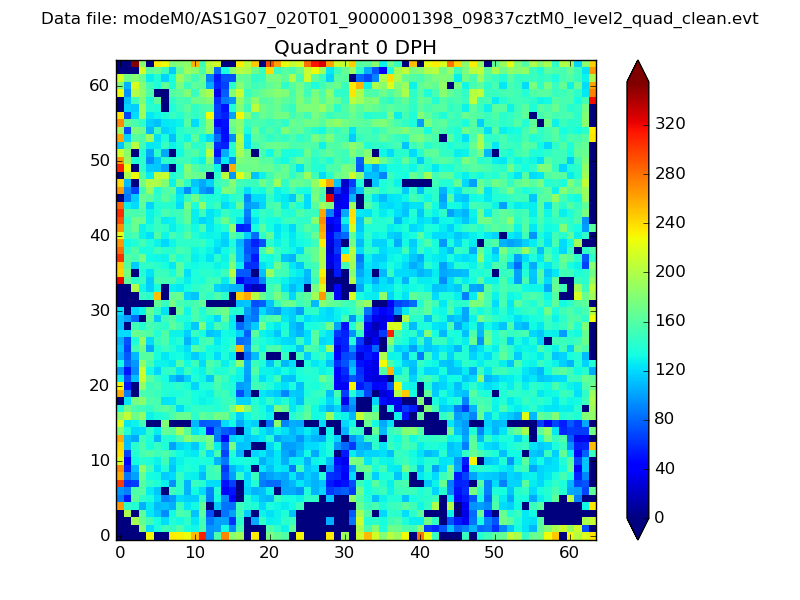 |
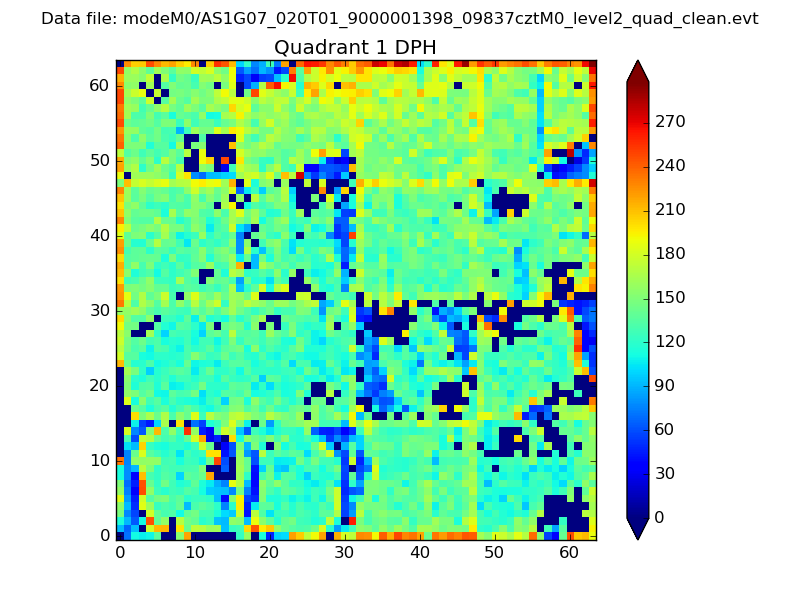 |
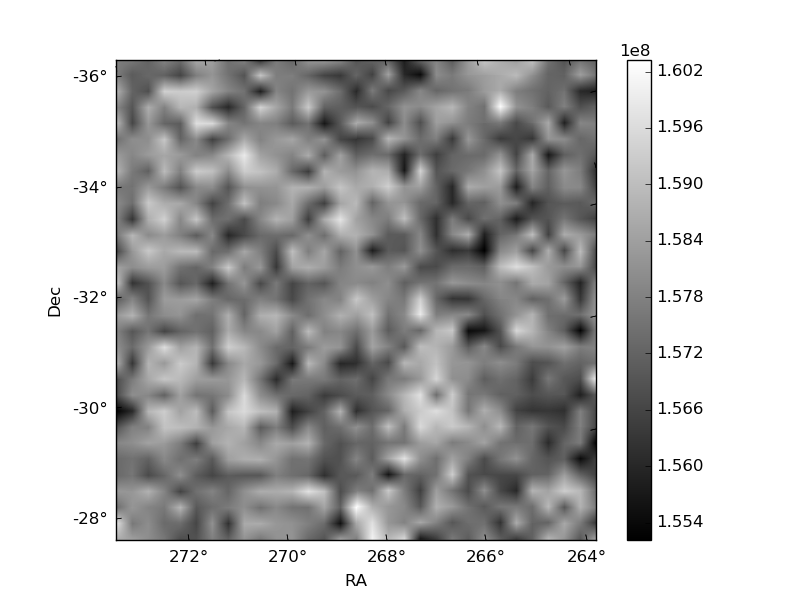
Quadrant B |
|---|---|---|---|
| Quadrant D | 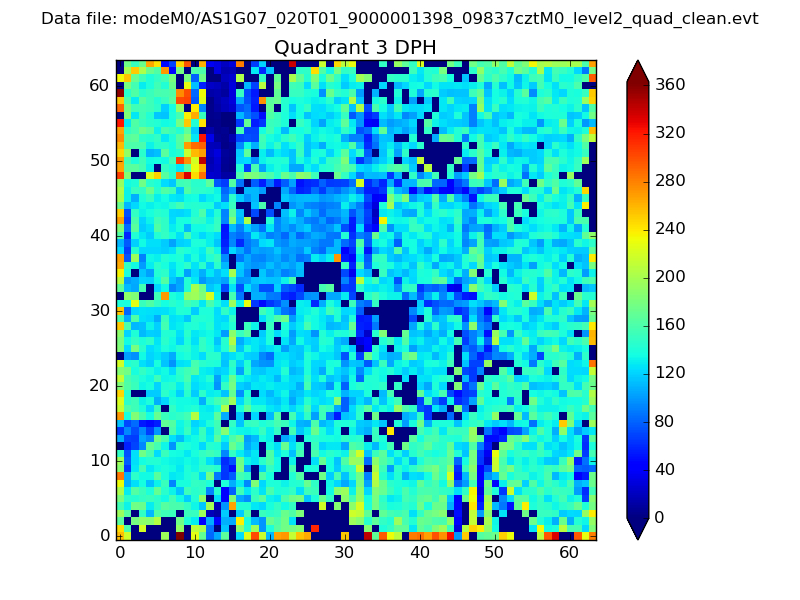 |
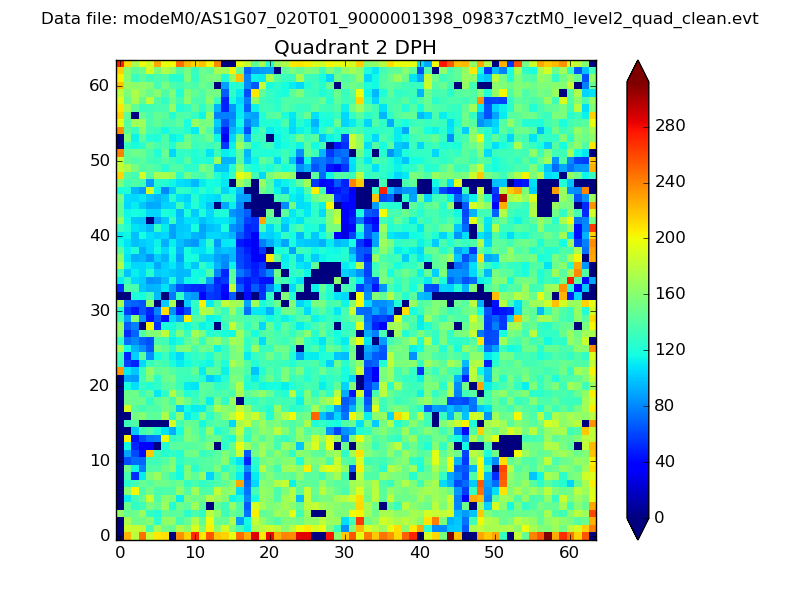 |
Quadrant C |
| Plot type | Count rate plots | Images |
|---|---|---|
| Comparison with Poisson distribution Blue bars denote a histogram of data divided into 1 sec bins. Red curve is a Poisson curve with rate = median count rate of data. |
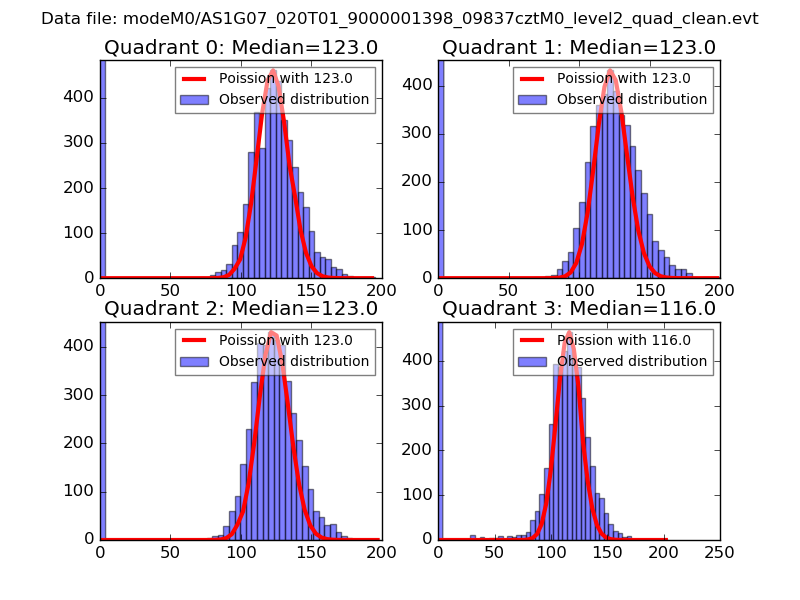 |
 |
| Quadrant-wise count rates Data is divided into 100 sec bins |
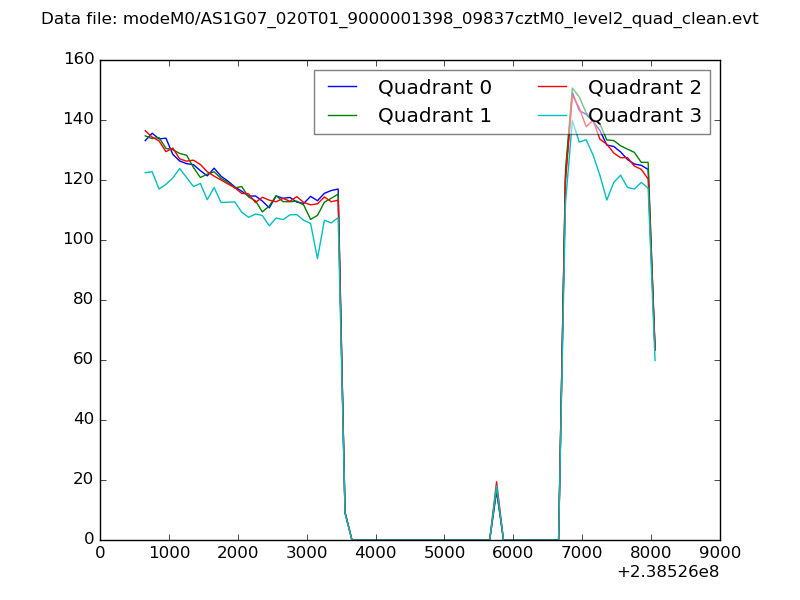 |
|
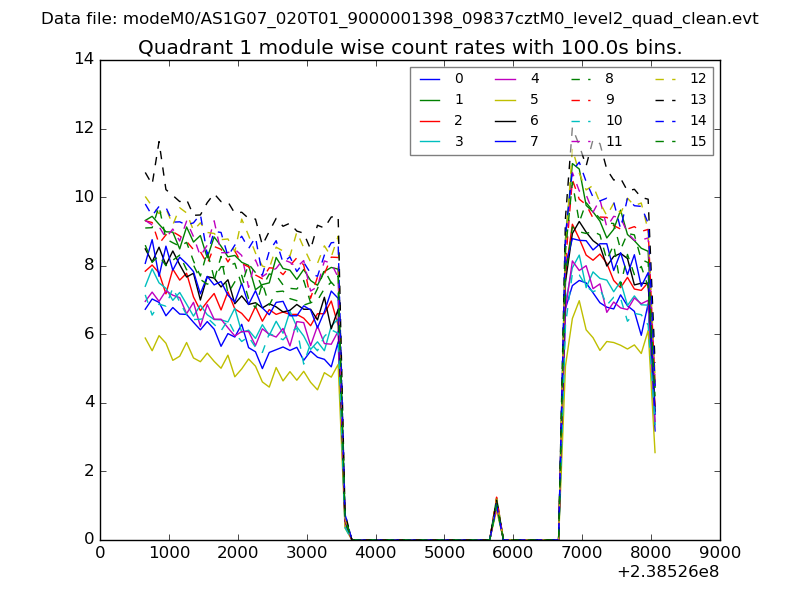
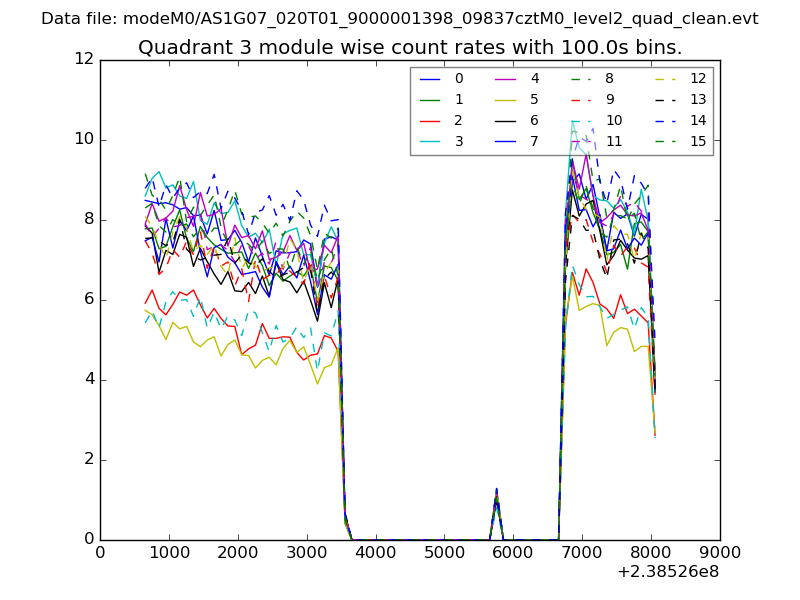
| Module-wise count rates for Quadrant A Data is divided into 100 sec bins |
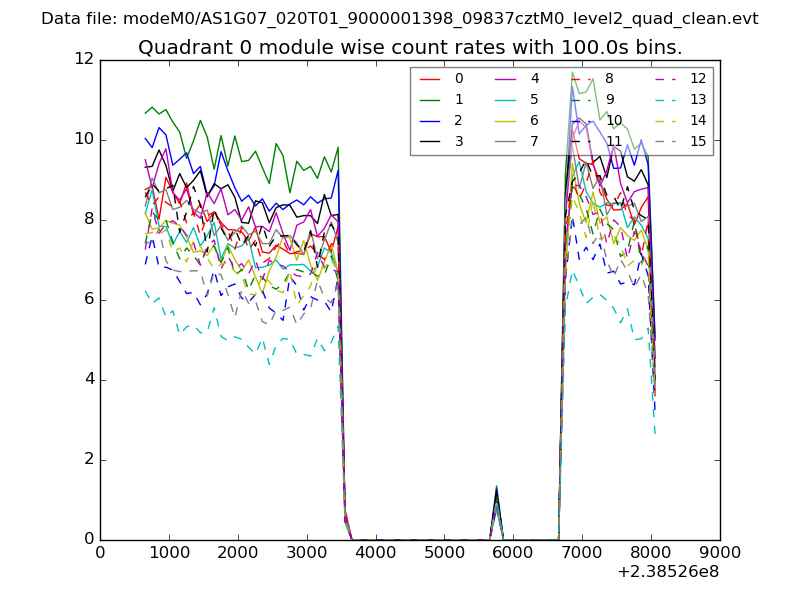 |
 |
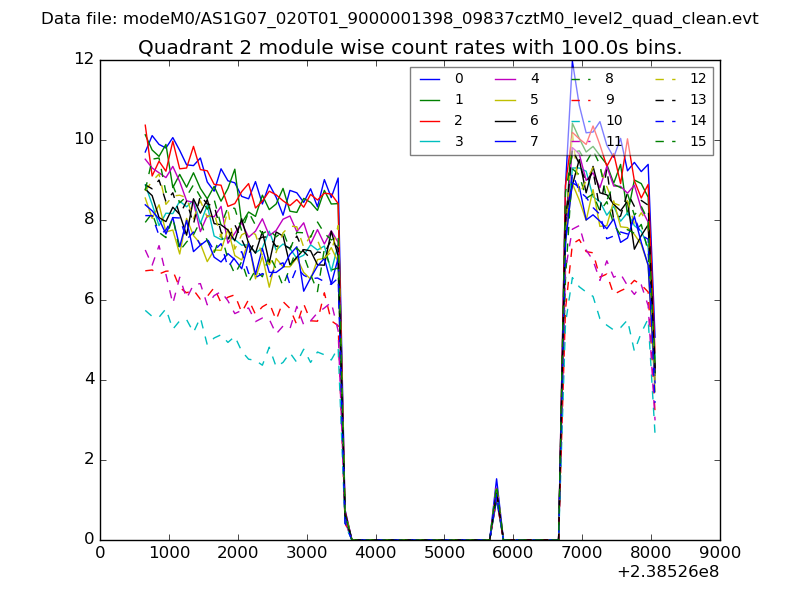
| Module-wise count rates for Quadrant B Data is divided into 100 sec bins |
 |
 |
| Module-wise count rates for Quadrant C Data is divided into 100 sec bins |
 |
 |
| Module-wise count rates for Quadrant D Data is divided into 100 sec bins |
 |
 |
| Parameter | Plot |
|---|---|
| CZT HV Monitor | 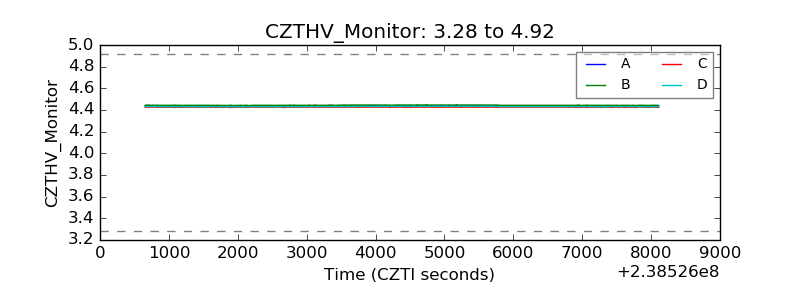 |
| D_VDD | 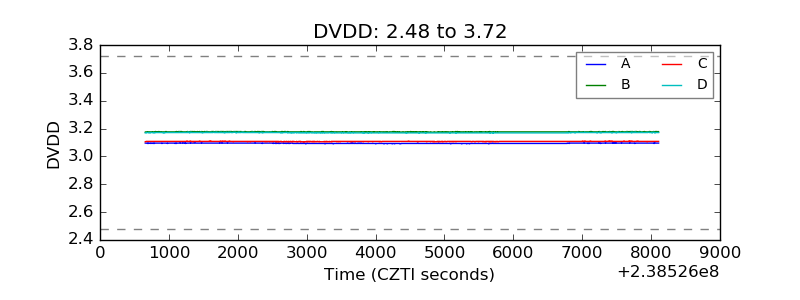 |
| Temperature 1 | 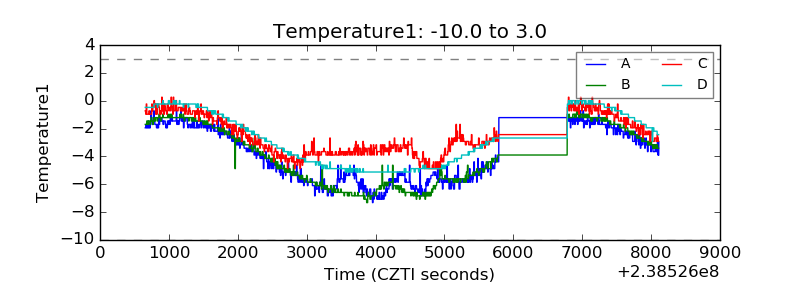 |
| Veto HV Monitor |  |
| Veto LLD | 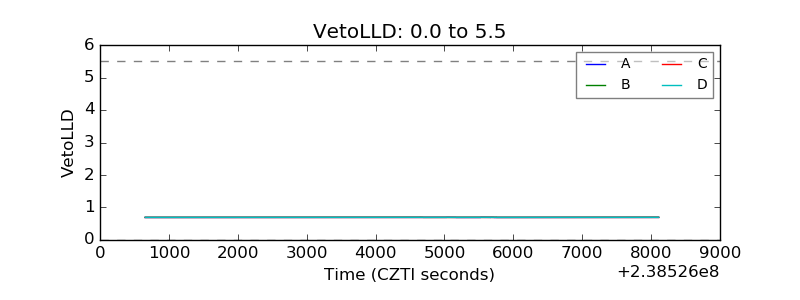 |
| Alpha Counter | 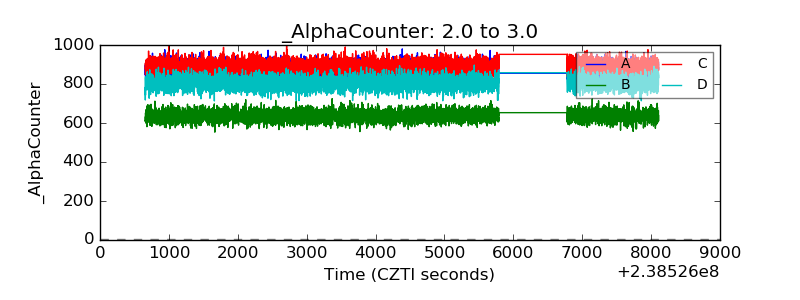 |
| _CPM_Rate | 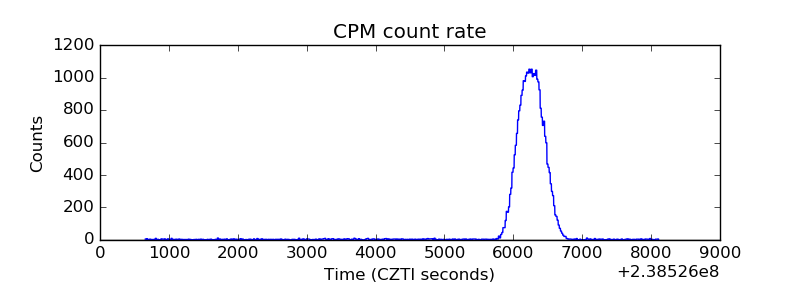 |
| CZT Counter |  |
| +2.5 Volts monitor |  |
| +5 Volts monitor |  |
| _ROLL_ROT | 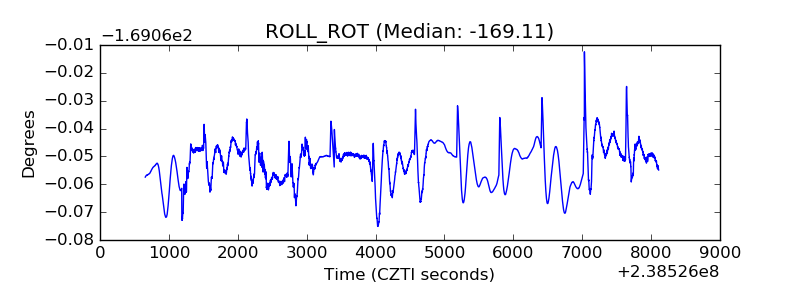 |
| _Roll_DEC | 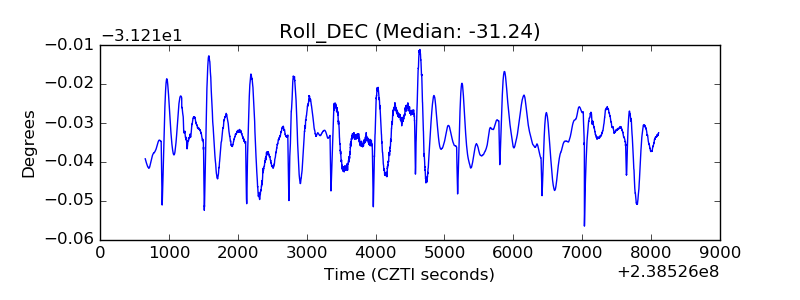 |
| _Roll_RA | 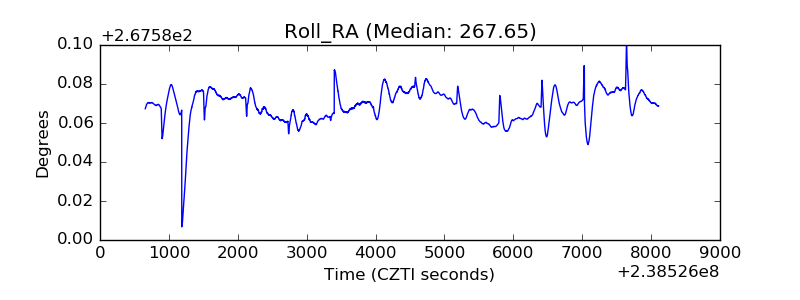 |
| Veto Counter | 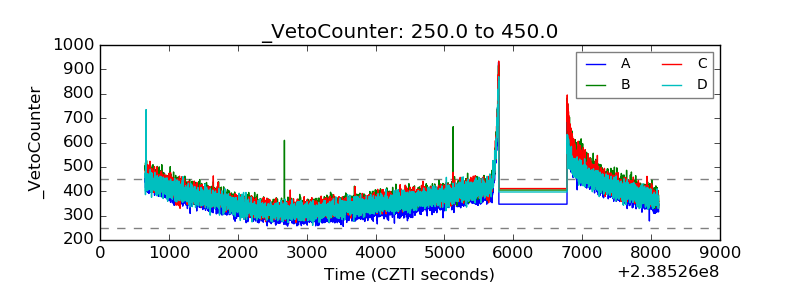 |