| Param | Original file | Final file |
|---|---|---|
| Filename | modeM0/AS1G07_020T01_9000001398_09839cztM0_level2.evt | modeM0/AS1G07_020T01_9000001398_09839cztM0_level2_quad_clean.evt |
| Size (bytes) | 450,290,880 | 86,238,720 |
| Size | 429.4 MB | 82.2 MB |
| Events in quadrant A | 2,959,214 | 551,087 |
| Events in quadrant B | 3,198,841 | 556,819 |
| Events in quadrant C | 2,961,230 | 547,123 |
| Events in quadrant D | 4,084,997 | 512,044 |
| Mode M0 | |||
|---|---|---|---|
| Quadrant | BADHDUFLAG | Total packets | Discarded packets |
| A | 0 | 13277 | 119 |
| B | 0 | 13806 | 137 |
| C | 0 | 13298 | 118 |
| D | 0 | 16977 | 221 |
| Mode SS | |||
|---|---|---|---|
| Quadrant | BADHDUFLAG | Total packets | Discarded packets |
| A | 0 | 132 | 2 |
| B | 0 | 132 | 0 |
| C | 0 | 132 | 0 |
| D | 0 | 132 | 4 |
| Mode M9 | |||
|---|---|---|---|
| Quadrant | BADHDUFLAG | Total packets | Discarded packets |
| A | 0 | 13 | 0 |
| B | 0 | 13 | 0 |
| C | 0 | 13 | 0 |
| D | 0 | 14 | 0 |
| Quadrant | Total seconds | Saturated seconds | Saturation percentage |
|---|---|---|---|
| A | 6370 | 21 | 0.329670% |
| B | 6361 | 48 | 0.754598% |
| C | 6367 | 25 | 0.392650% |
| D | 6357 | 163 | 2.564103% |
Noise dominated data is calculated using 1-second bins in cleaned event files. If a bin has >2000 counts, and if more than 50% of those come from <1% of pixels, then it is considered to be noise-dominated and hence unusable.
| Quadrant | # 1 sec bins | Bins with >0 counts | Bins with >2000 counts | High rate bins dominated by noise | Noise dominated (total time) | Noise dominated (detector-on time) | Marked lightcurve |
|---|---|---|---|---|---|---|---|
| A | 7570 | 6423 | 0 | 0 | 0.00% | 0.00% | 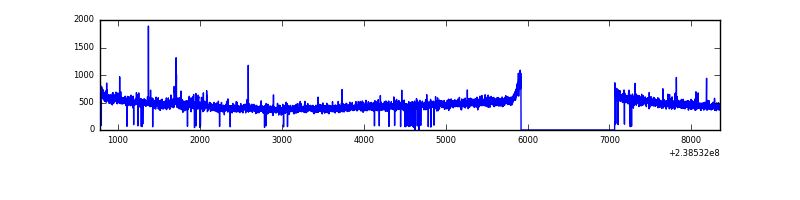 |
| B | 7570 | 6419 | 13 | 13 | 0.17% | 0.20% | 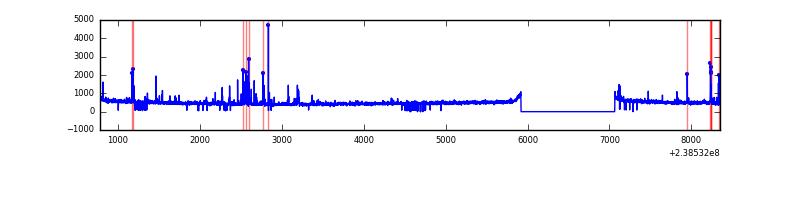 |
| C | 7570 | 6422 | 8 | 8 | 0.11% | 0.12% | 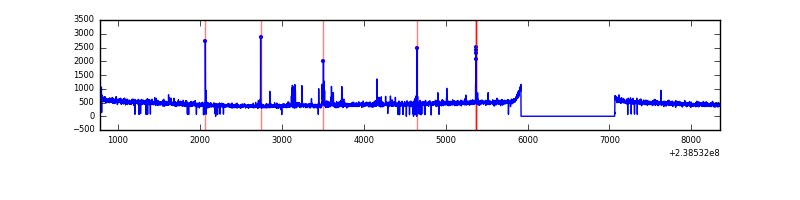 |
| D | 7570 | 6422 | 125 | 125 | 1.65% | 1.95% | 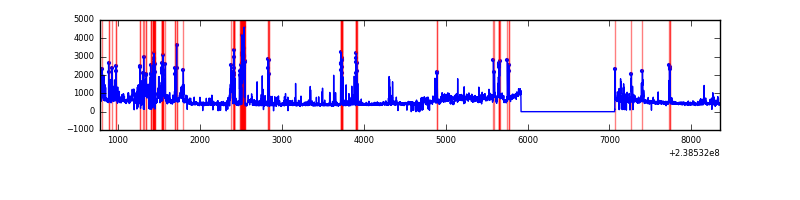 |
Top three noisy pixels from each quadrant. If the there are fewer than three noisy pixels in the level2.evt file, extra rows are filled as -1
| Pixel properties | Quadrant properties | ||||||
|---|---|---|---|---|---|---|---|
| Quadrant | DetID | PixID | Counts | Sigma | Mean | Median | Sigma |
| A | 4 | 2 | 25297 | 158.71 | 760 | 745 | 154.7 |
| A | 0 | 226 | 7163 | 41.48 | 760 | 745 | 154.7 |
| A | 12 | 194 | 6345 | 36.2 | 760 | 745 | 154.7 |
| B | 4 | 239 | 131199 | 893.57 | 763 | 746 | 146.0 |
| B | 0 | 229 | 21785 | 144.11 | 763 | 746 | 146.0 |
| B | 0 | 219 | 19965 | 131.65 | 763 | 746 | 146.0 |
| C | 0 | 207 | 63299 | 367.8 | 731 | 734 | 170.1 |
| C | 4 | 254 | 22043 | 125.27 | 731 | 734 | 170.1 |
| C | 14 | 234 | 13642 | 75.88 | 731 | 734 | 170.1 |
| D | 2 | 16 | 304784 | 1606.01 | 718 | 699 | 189.3 |
| D | 1 | 52 | 299209 | 1576.57 | 718 | 699 | 189.3 |
| D | 2 | 136 | 287696 | 1515.76 | 718 | 699 | 189.3 |
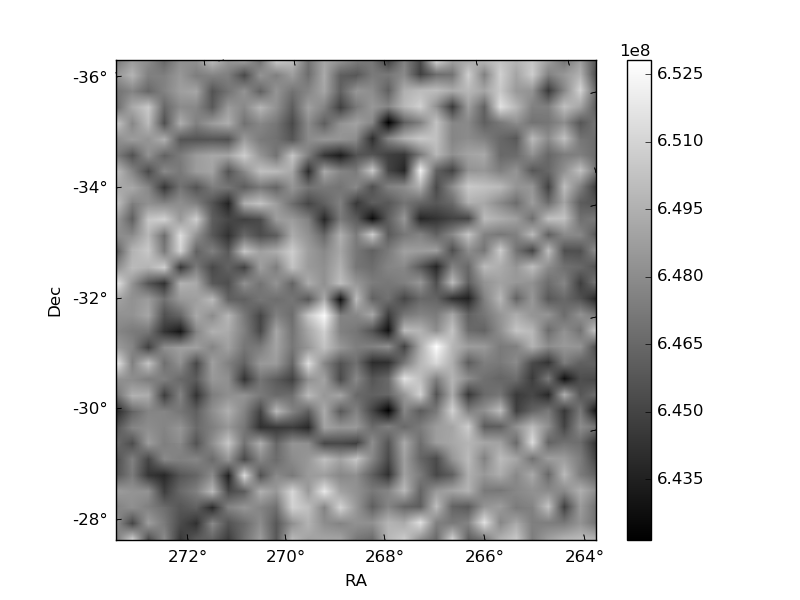
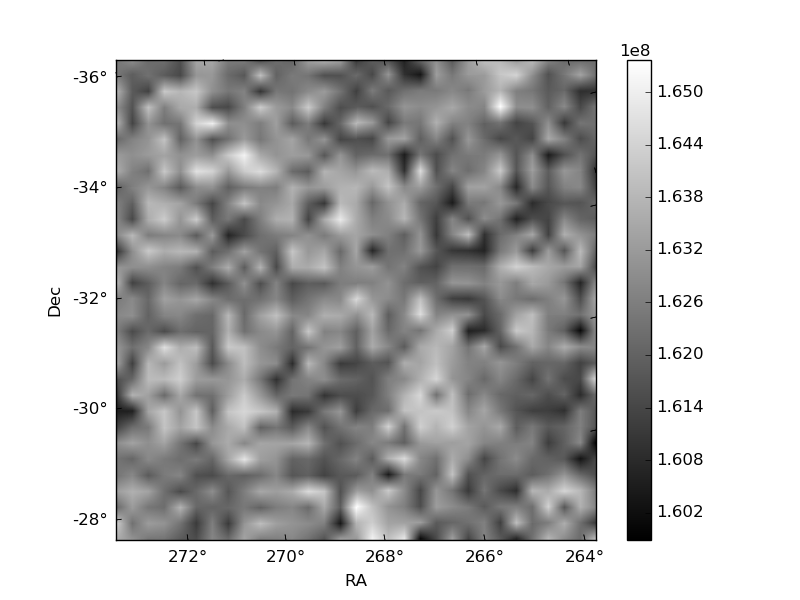
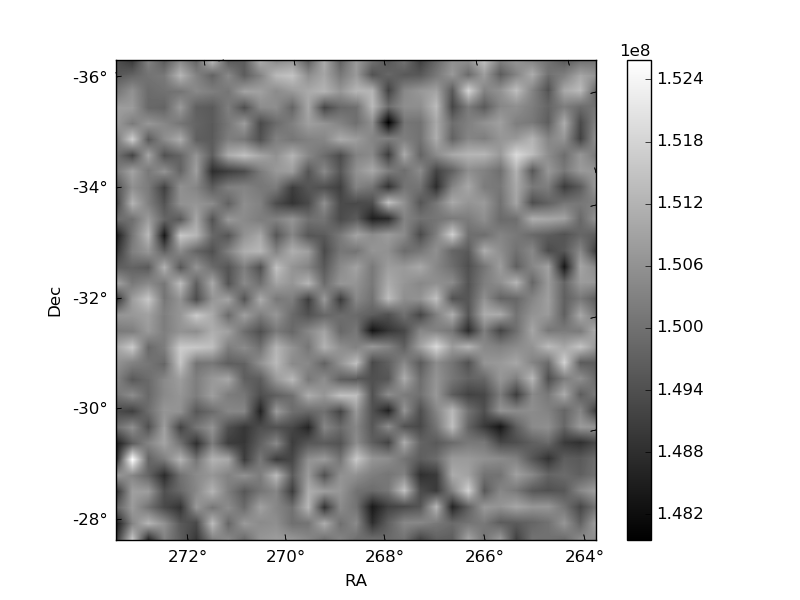
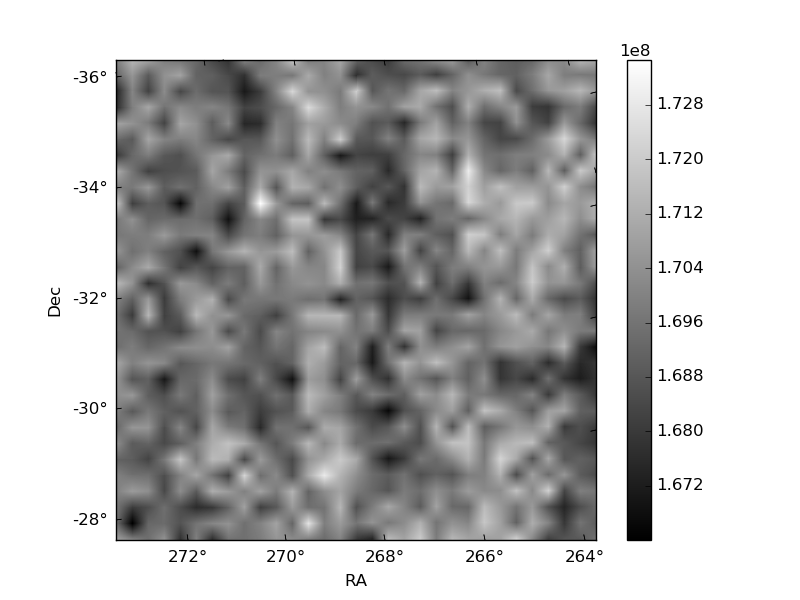
Histogram calculated using DETX and DETY for each event in the final _common_clean file
| Quadrant A | 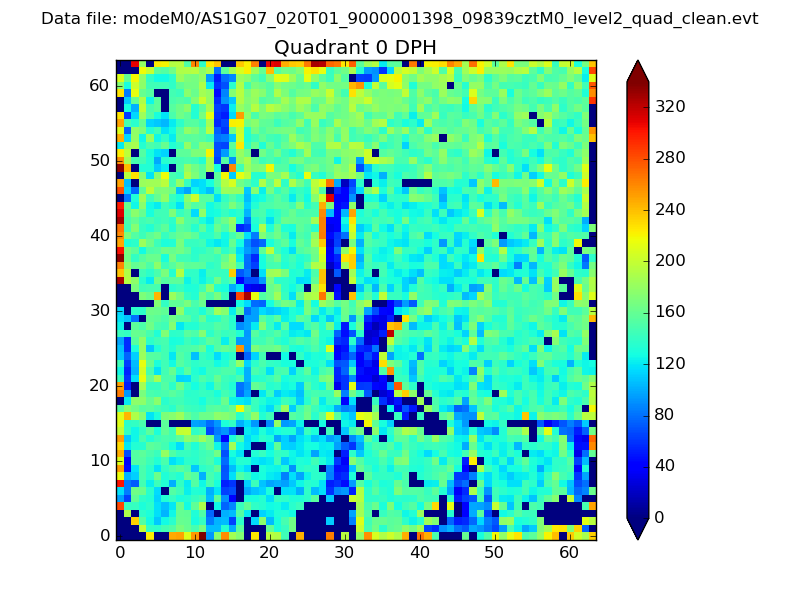 |
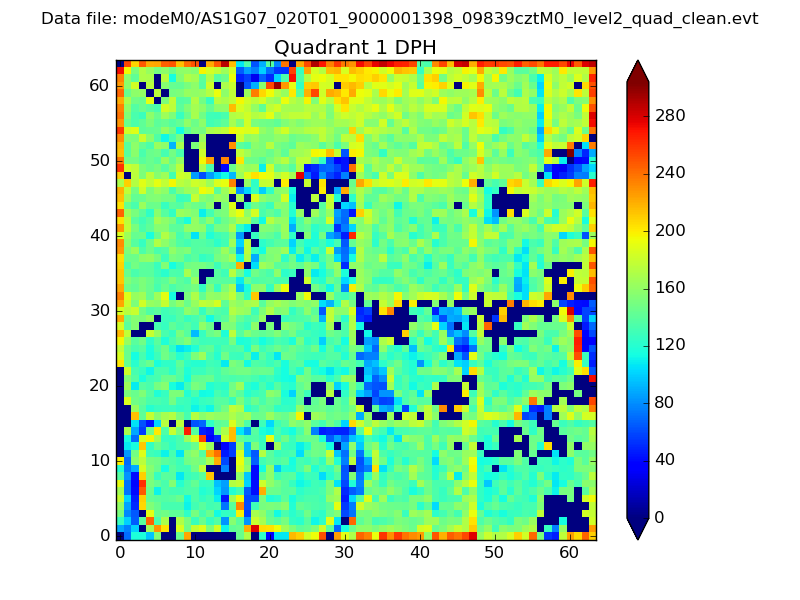 |
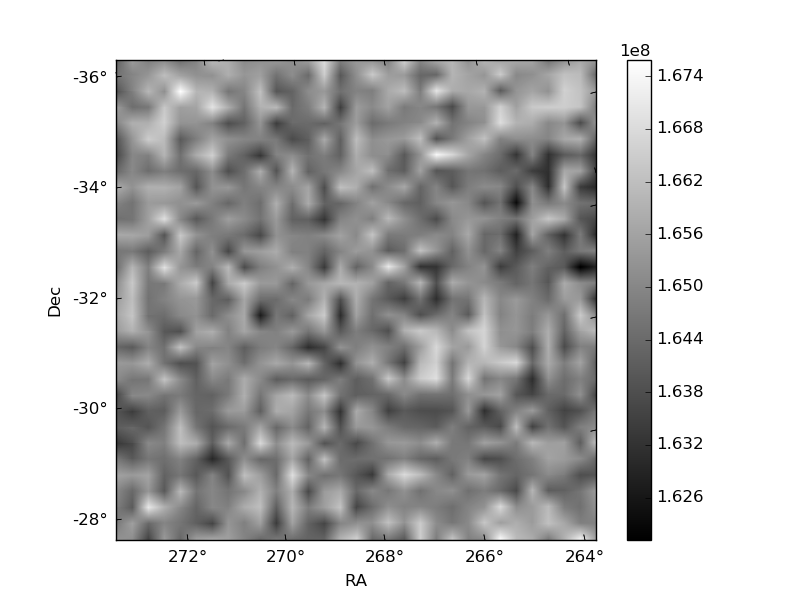
Quadrant B |
|---|---|---|---|
| Quadrant D | 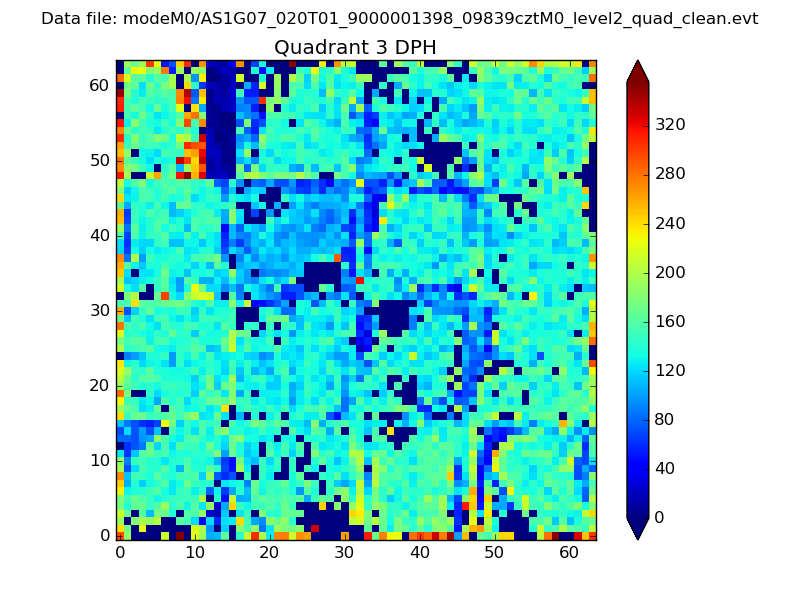 |
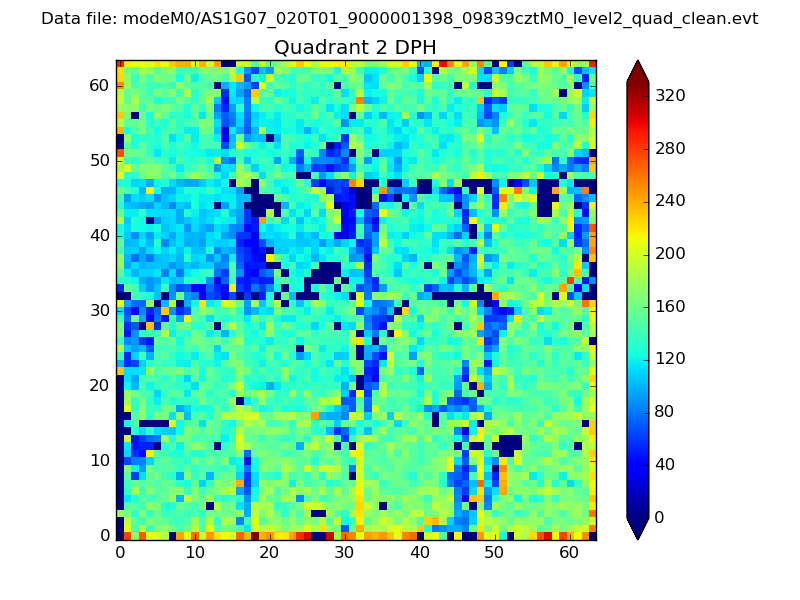 |
Quadrant C |
| Plot type | Count rate plots | Images |
|---|---|---|
| Comparison with Poisson distribution Blue bars denote a histogram of data divided into 1 sec bins. Red curve is a Poisson curve with rate = median count rate of data. |
 |
 |
| Quadrant-wise count rates Data is divided into 100 sec bins |
 |
|
| Module-wise count rates for Quadrant A Data is divided into 100 sec bins |
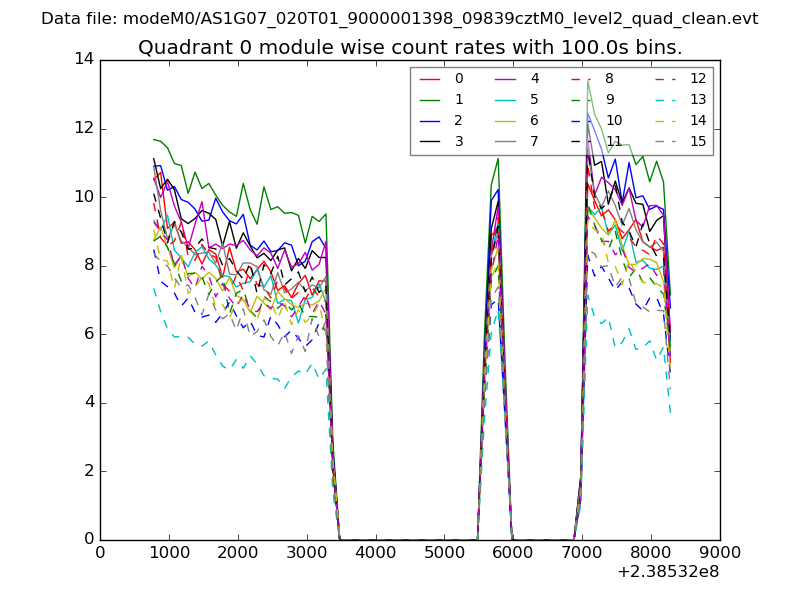 |
 |
| Module-wise count rates for Quadrant B Data is divided into 100 sec bins |
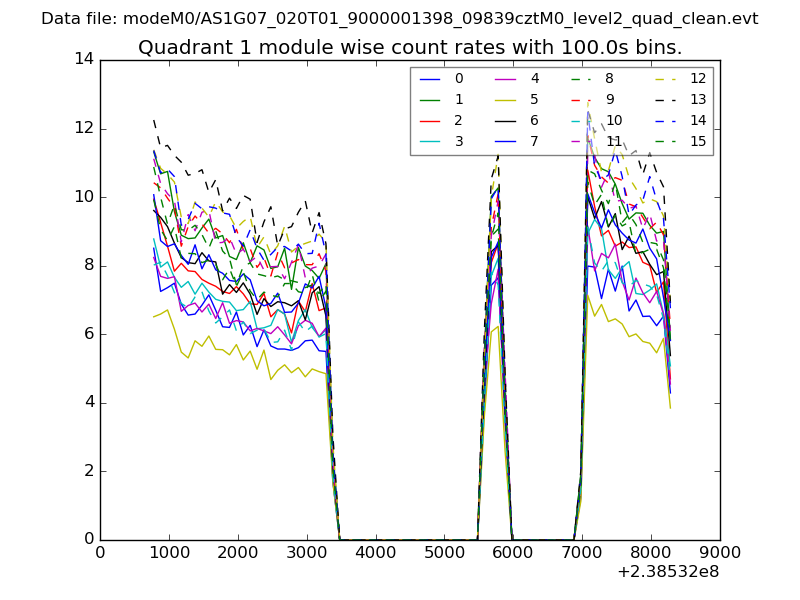 |
 |
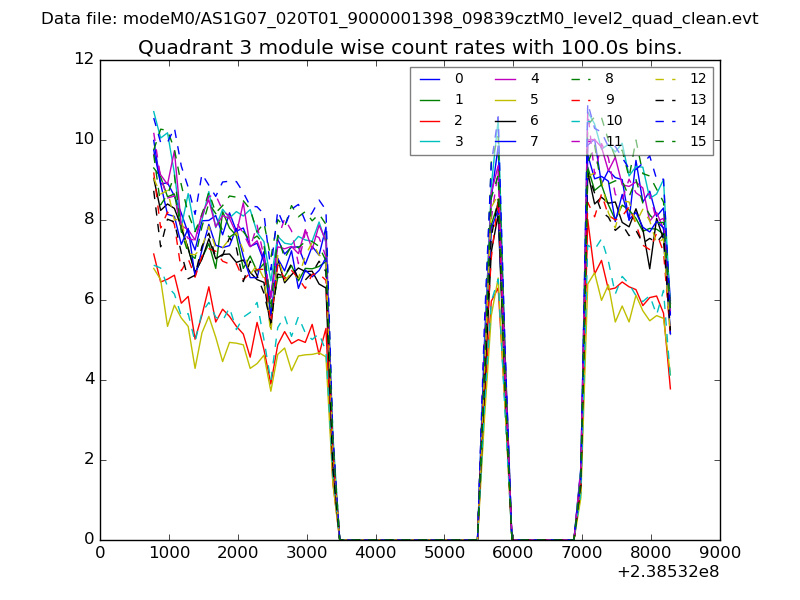
| Module-wise count rates for Quadrant C Data is divided into 100 sec bins |
 |
 |
| Module-wise count rates for Quadrant D Data is divided into 100 sec bins |
 |
 |
| Parameter | Plot |
|---|---|
| CZT HV Monitor |  |
| D_VDD | 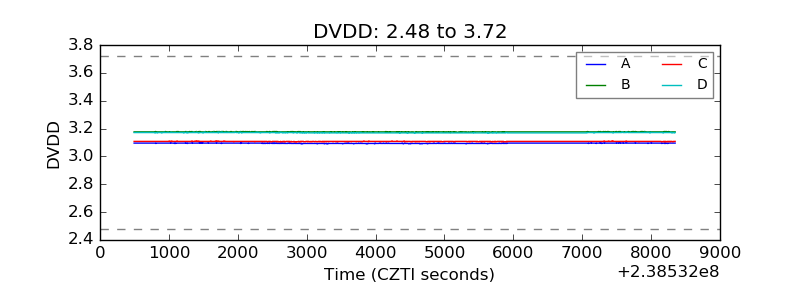 |
| Temperature 1 | 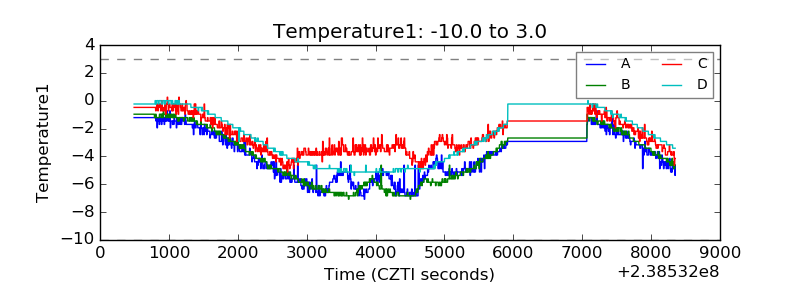 |
| Veto HV Monitor | 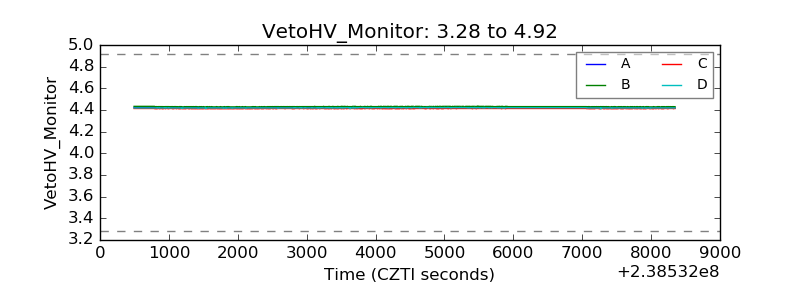 |
| Veto LLD | 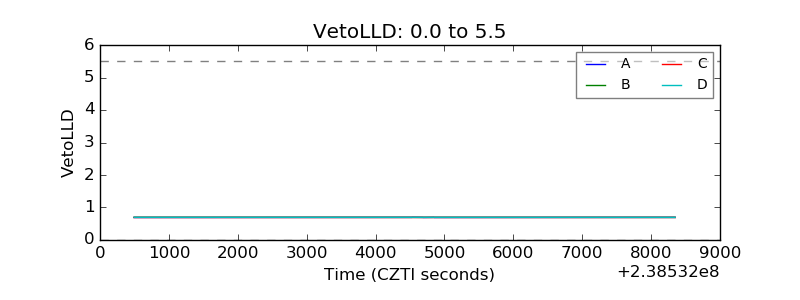 |
| Alpha Counter |  |
| _CPM_Rate | 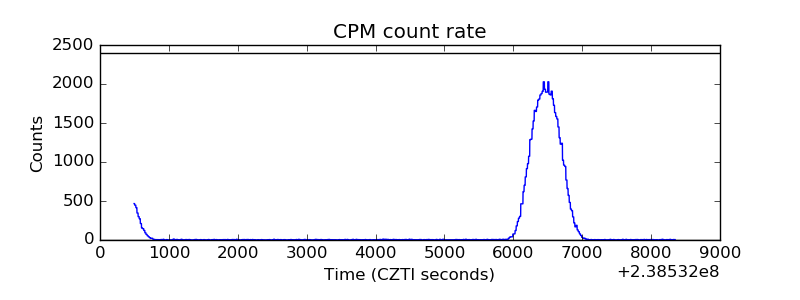 |
| CZT Counter | 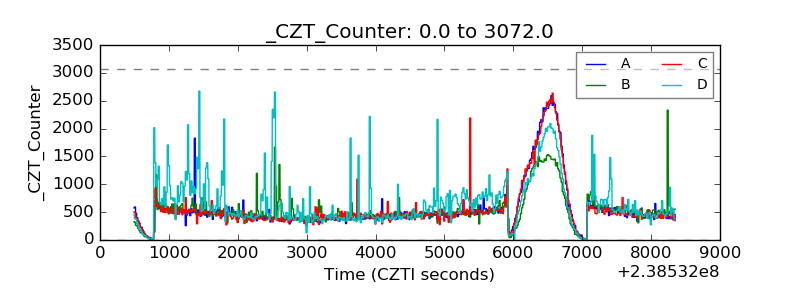 |
| +2.5 Volts monitor |  |
| +5 Volts monitor |  |
| _ROLL_ROT | 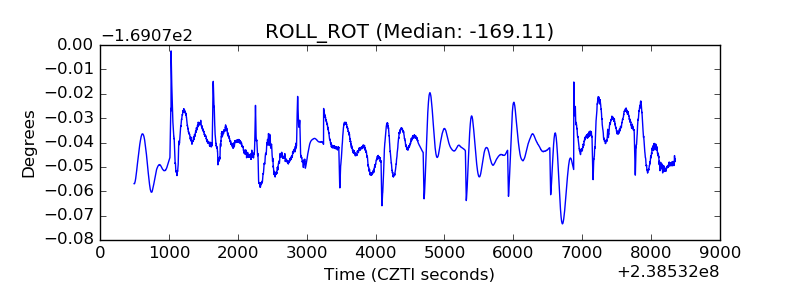 |
| _Roll_DEC | 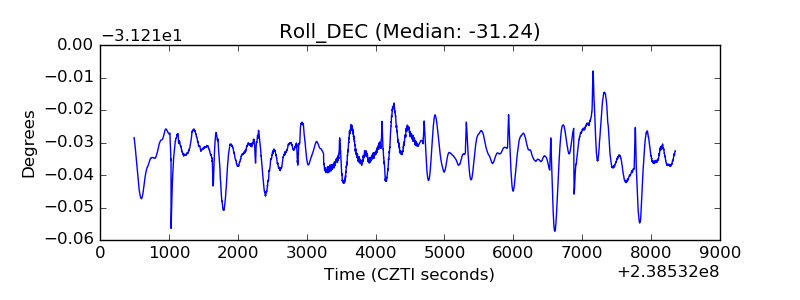 |
| _Roll_RA | 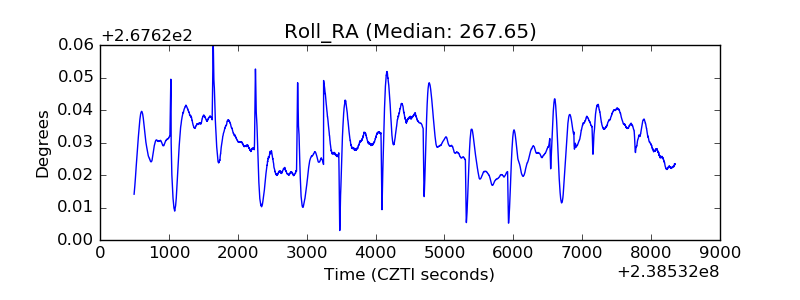 |
| Veto Counter | 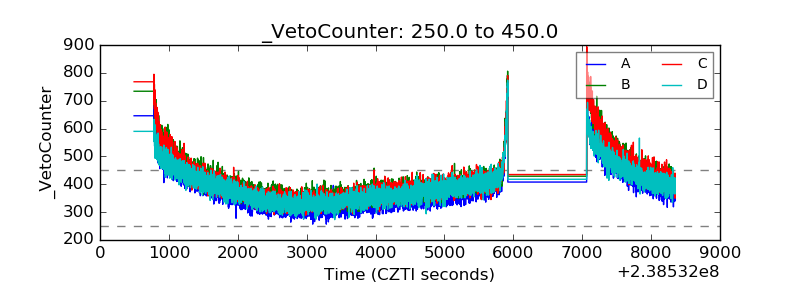 |