| Param | Original file | Final file |
|---|---|---|
| Filename | modeM0/AS1G07_020T01_9000001398_09840cztM0_level2.evt | modeM0/AS1G07_020T01_9000001398_09840cztM0_level2_quad_clean.evt |
| Size (bytes) | 407,456,640 | 83,816,640 |
| Size | 388.6 MB | 79.9 MB |
| Events in quadrant A | 2,844,498 | 538,881 |
| Events in quadrant B | 3,116,031 | 547,046 |
| Events in quadrant C | 2,759,469 | 537,621 |
| Events in quadrant D | 3,217,629 | 502,028 |
| Mode M0 | |||
|---|---|---|---|
| Quadrant | BADHDUFLAG | Total packets | Discarded packets |
| A | 0 | 13189 | 742 |
| B | 0 | 13961 | 879 |
| C | 0 | 12990 | 772 |
| D | 0 | 14613 | 1062 |
| Mode SS | |||
|---|---|---|---|
| Quadrant | BADHDUFLAG | Total packets | Discarded packets |
| A | 0 | 127 | 11 |
| B | 0 | 127 | 15 |
| C | 0 | 128 | 4 |
| D | 0 | 128 | 6 |
| Mode M9 | |||
|---|---|---|---|
| Quadrant | BADHDUFLAG | Total packets | Discarded packets |
| A | 0 | 21 | 1 |
| B | 0 | 21 | 0 |
| C | 0 | 21 | 0 |
| D | 0 | 22 | 1 |
| Quadrant | Total seconds | Saturated seconds | Saturation percentage |
|---|---|---|---|
| A | 5948 | 54 | 0.907868% |
| B | 5889 | 83 | 1.409407% |
| C | 5922 | 19 | 0.320838% |
| D | 5860 | 74 | 1.262799% |
Noise dominated data is calculated using 1-second bins in cleaned event files. If a bin has >2000 counts, and if more than 50% of those come from <1% of pixels, then it is considered to be noise-dominated and hence unusable.
| Quadrant | # 1 sec bins | Bins with >0 counts | Bins with >2000 counts | High rate bins dominated by noise | Noise dominated (total time) | Noise dominated (detector-on time) | Marked lightcurve |
|---|---|---|---|---|---|---|---|
| A | 7559 | 6207 | 16 | 16 | 0.21% | 0.26% | 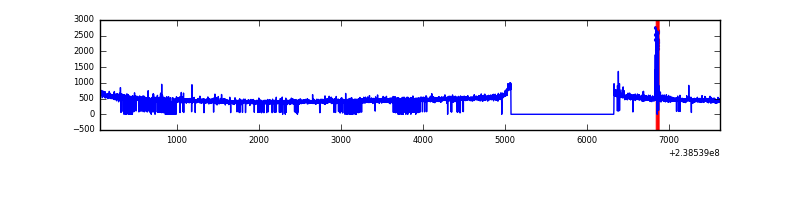 |
| B | 7559 | 6183 | 20 | 20 | 0.26% | 0.32% | 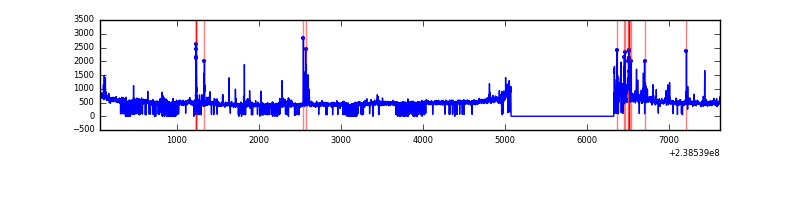 |
| C | 7559 | 6227 | 1 | 1 | 0.01% | 0.02% | 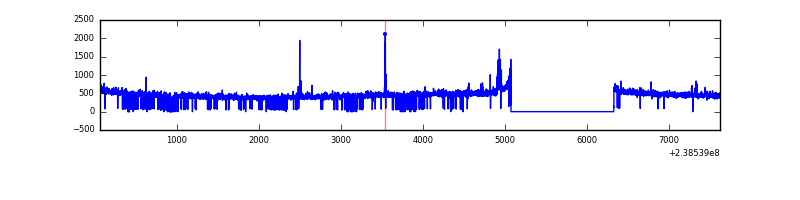 |
| D | 7559 | 6184 | 78 | 78 | 1.03% | 1.26% | 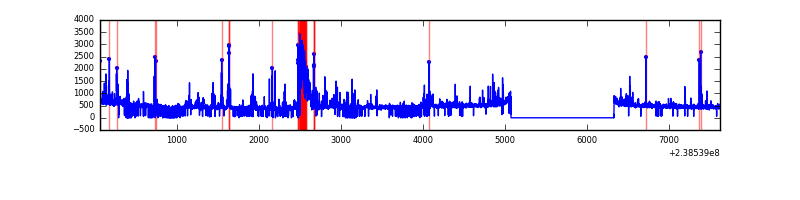 |
Top three noisy pixels from each quadrant. If the there are fewer than three noisy pixels in the level2.evt file, extra rows are filled as -1
| Pixel properties | Quadrant properties | ||||||
|---|---|---|---|---|---|---|---|
| Quadrant | DetID | PixID | Counts | Sigma | Mean | Median | Sigma |
| A | 4 | 2 | 60508 | 407.17 | 720 | 705 | 146.9 |
| A | 14 | 111 | 9069 | 56.95 | 720 | 705 | 146.9 |
| A | 0 | 226 | 6821 | 41.64 | 720 | 705 | 146.9 |
| B | 4 | 81 | 145856 | 1054.56 | 723 | 707 | 137.6 |
| B | 4 | 239 | 53578 | 384.13 | 723 | 707 | 137.6 |
| B | 0 | 229 | 34912 | 248.51 | 723 | 707 | 137.6 |
| C | 14 | 234 | 34990 | 213.4 | 695 | 699 | 160.7 |
| C | 12 | 4 | 7034 | 39.42 | 695 | 699 | 160.7 |
| C | 13 | 61 | 5235 | 28.23 | 695 | 699 | 160.7 |
| D | 12 | 233 | 294915 | 1697.91 | 675 | 656 | 173.3 |
| D | 1 | 52 | 124998 | 717.47 | 675 | 656 | 173.3 |
| D | 7 | 71 | 54453 | 310.42 | 675 | 656 | 173.3 |
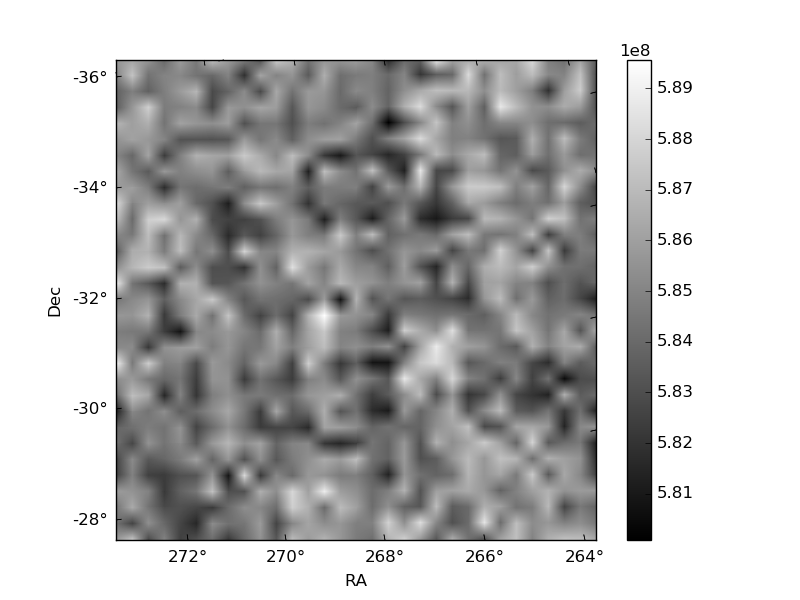
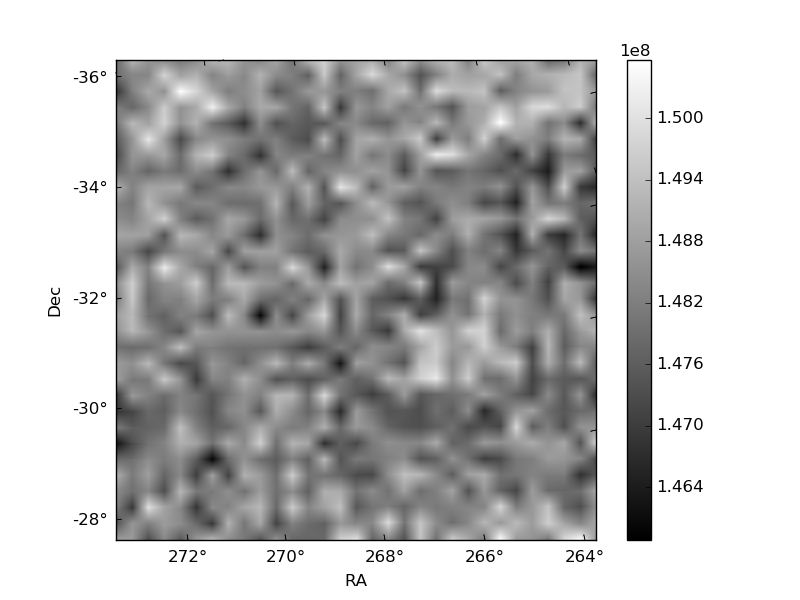
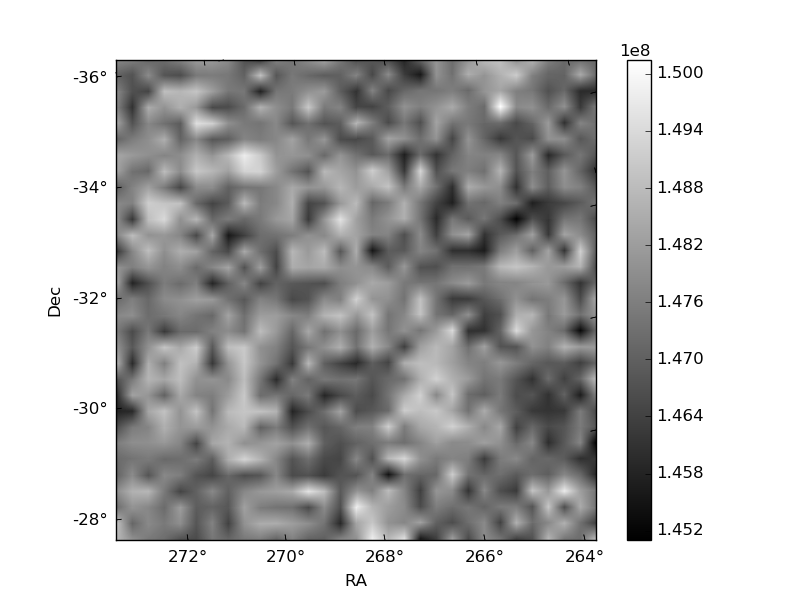
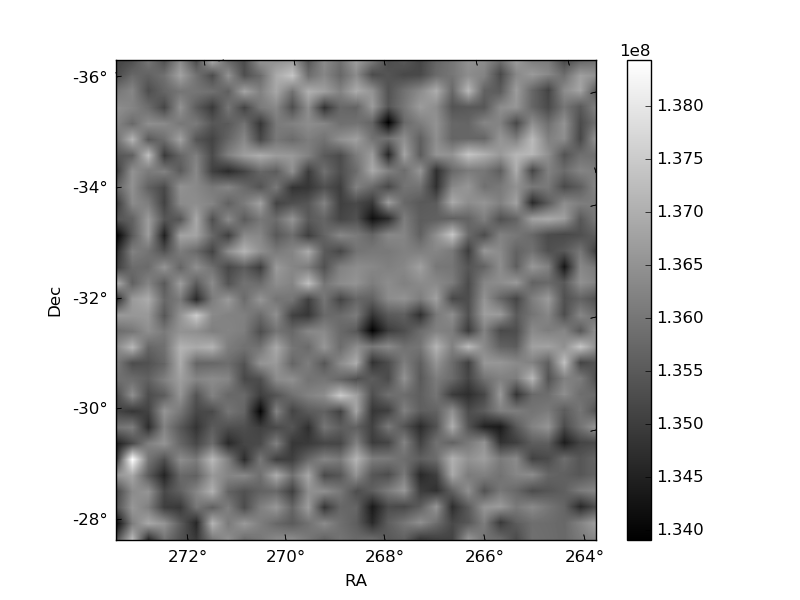
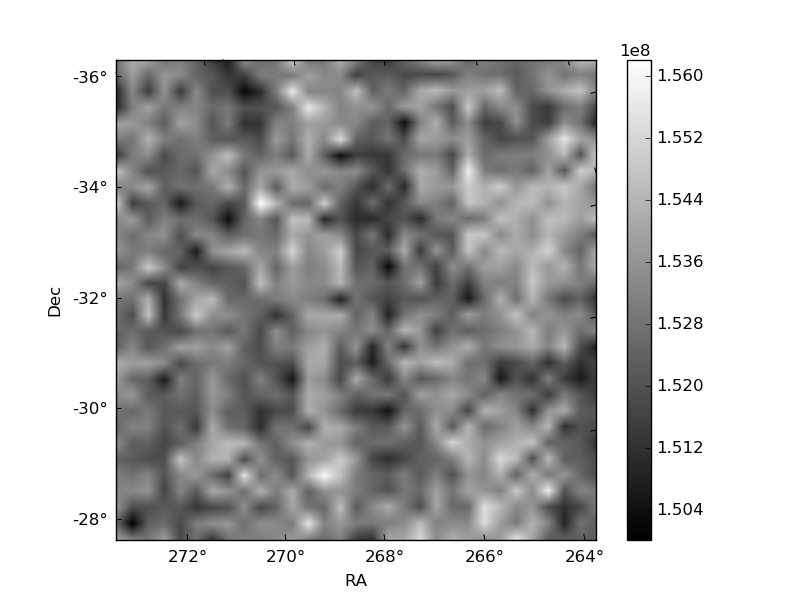
Histogram calculated using DETX and DETY for each event in the final _common_clean file
| Quadrant A | 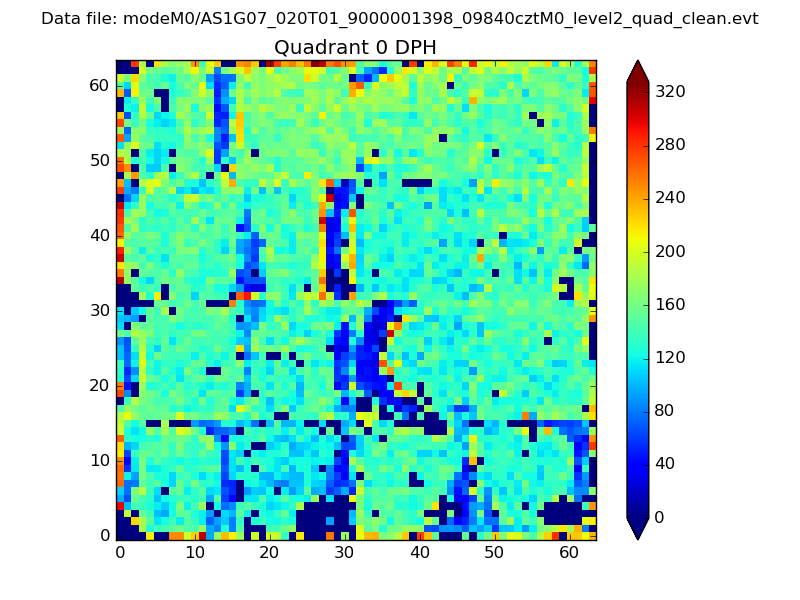 |
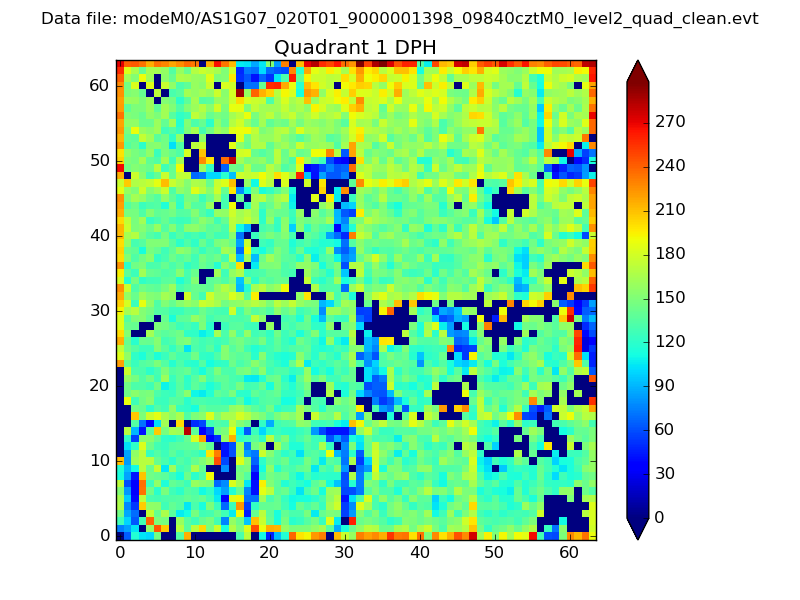 |
Quadrant B |
|---|---|---|---|
| Quadrant D | 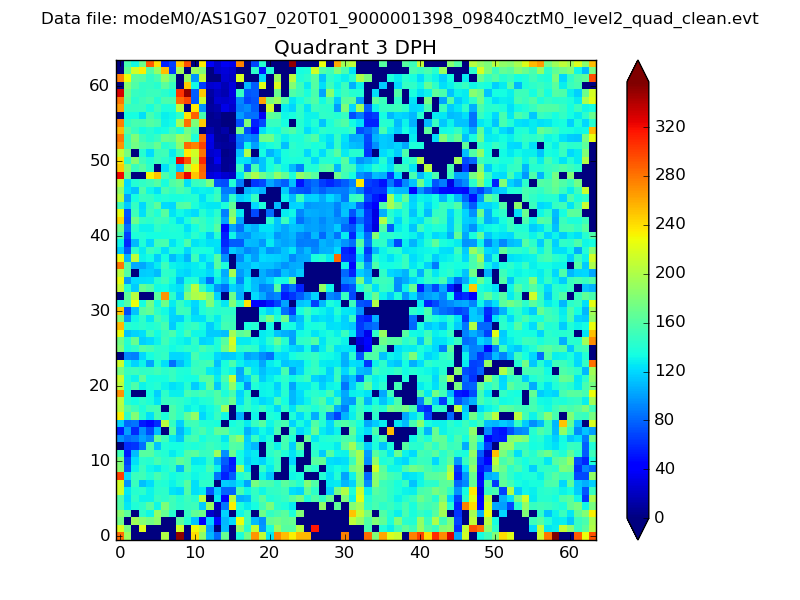 |
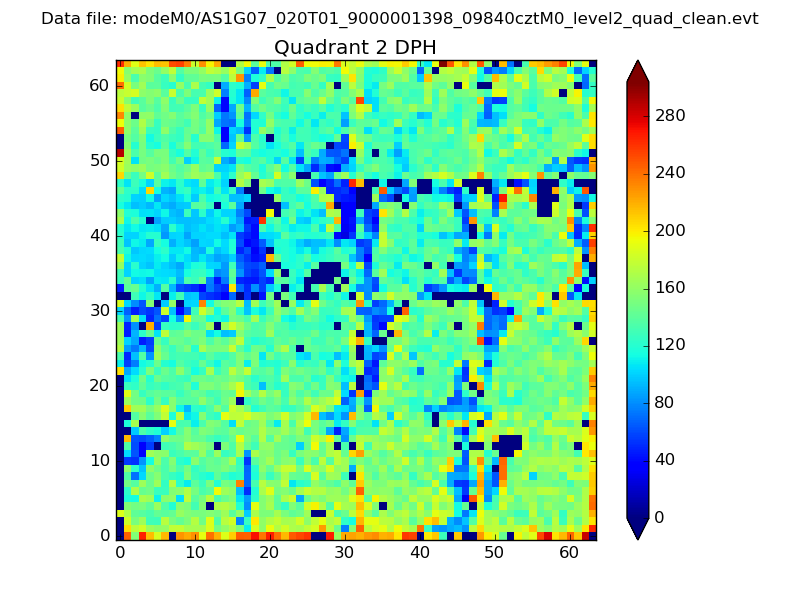 |
Quadrant C |
| Plot type | Count rate plots | Images |
|---|---|---|
| Comparison with Poisson distribution Blue bars denote a histogram of data divided into 1 sec bins. Red curve is a Poisson curve with rate = median count rate of data. |
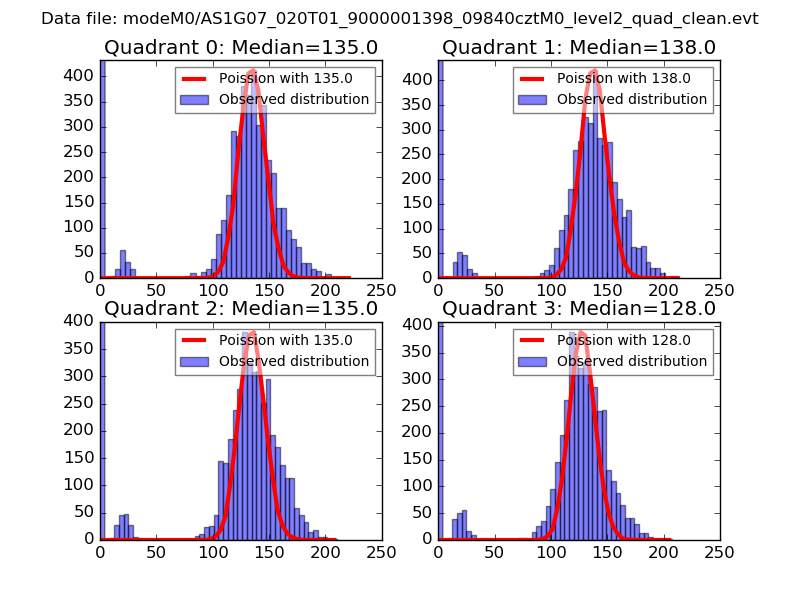 |
 |
| Quadrant-wise count rates Data is divided into 100 sec bins |
 |
|
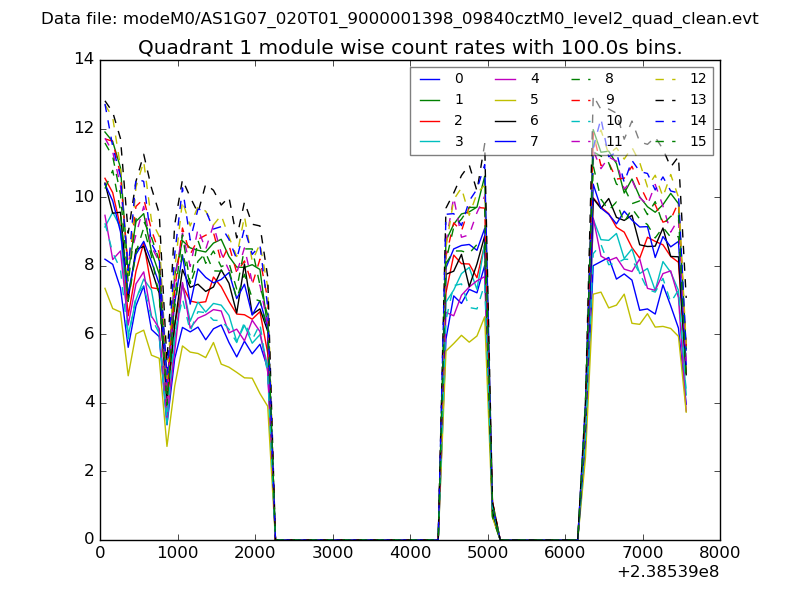
| Module-wise count rates for Quadrant A Data is divided into 100 sec bins |
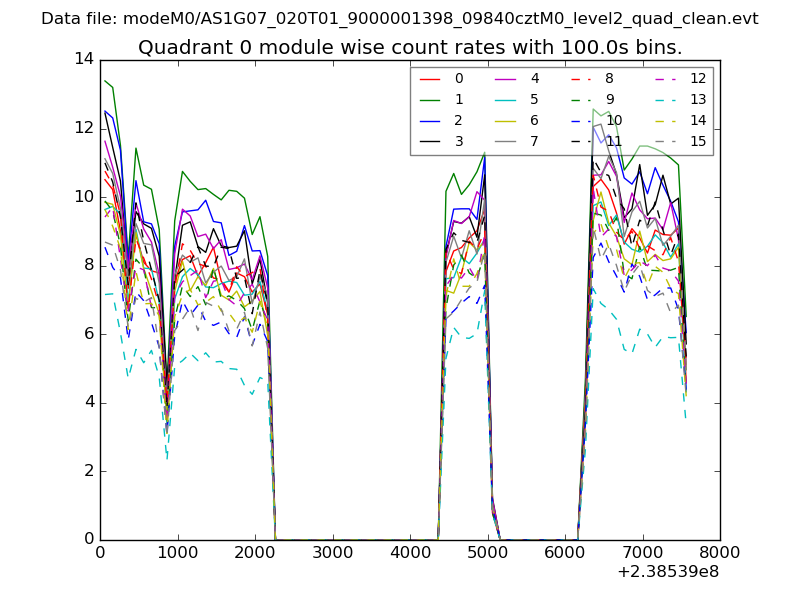 |
 |
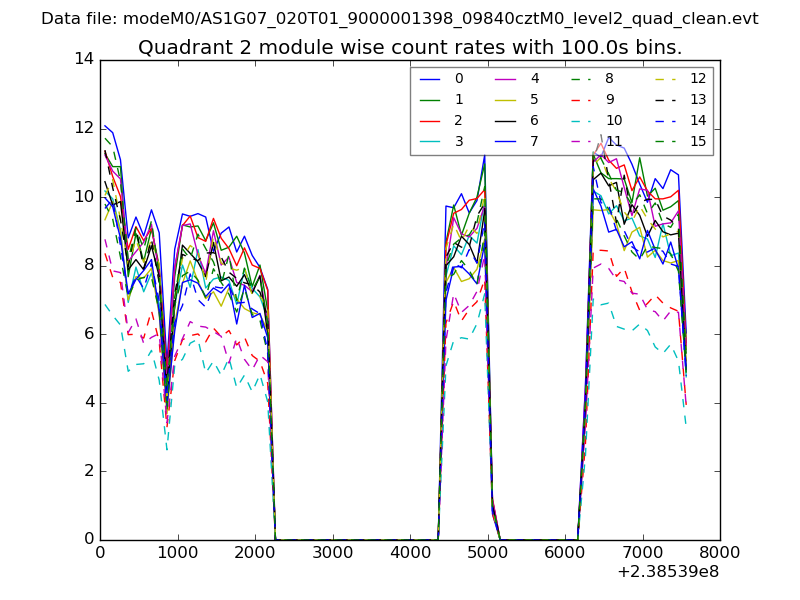
| Module-wise count rates for Quadrant B Data is divided into 100 sec bins |
 |
 |
| Module-wise count rates for Quadrant C Data is divided into 100 sec bins |
 |
 |
| Module-wise count rates for Quadrant D Data is divided into 100 sec bins |
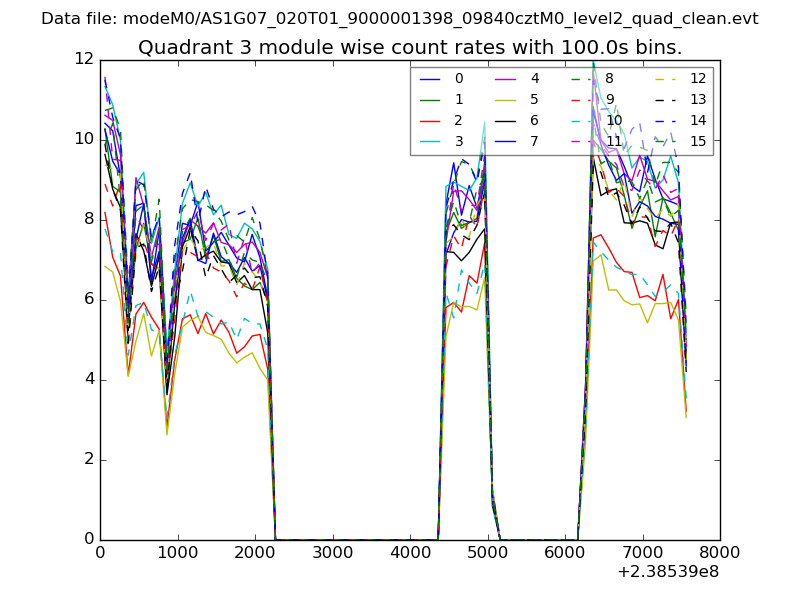 |
 |
| Parameter | Plot |
|---|---|
| CZT HV Monitor | 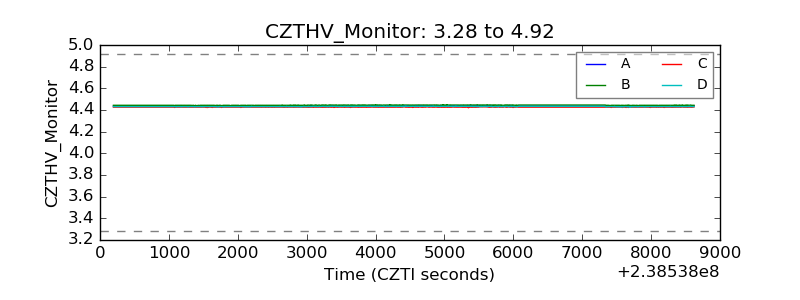 |
| D_VDD | 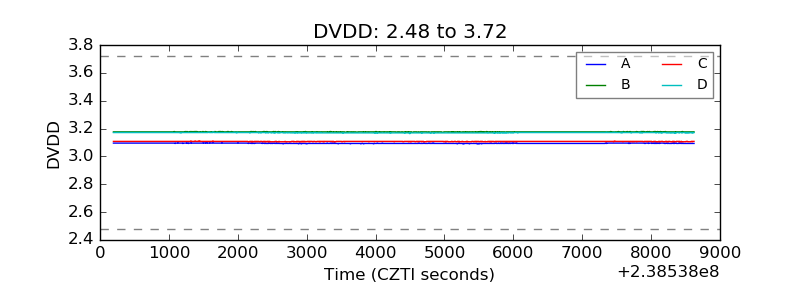 |
| Temperature 1 | 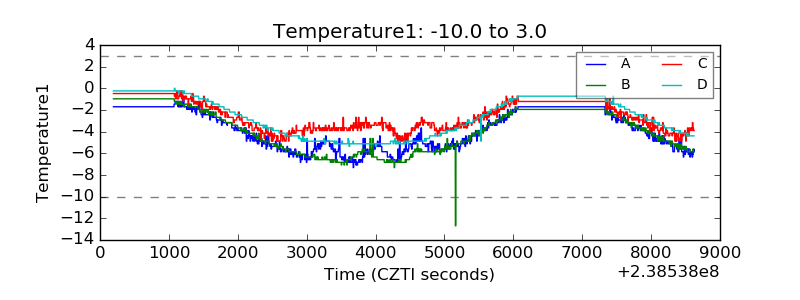 |
| Veto HV Monitor |  |
| Veto LLD | 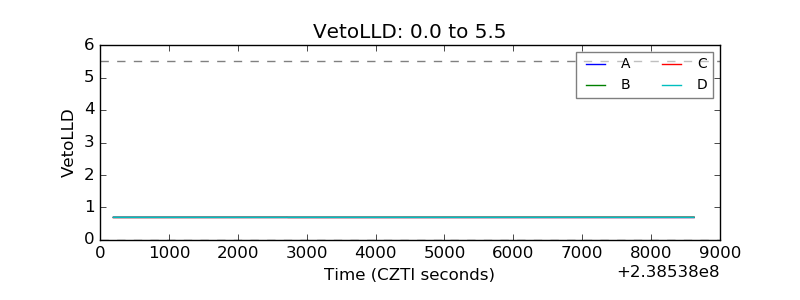 |
| Alpha Counter | 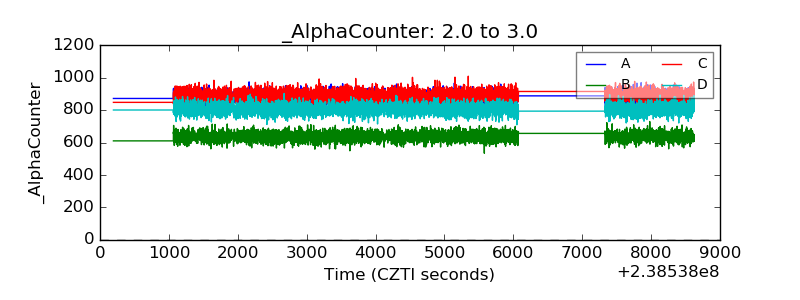 |
| _CPM_Rate | 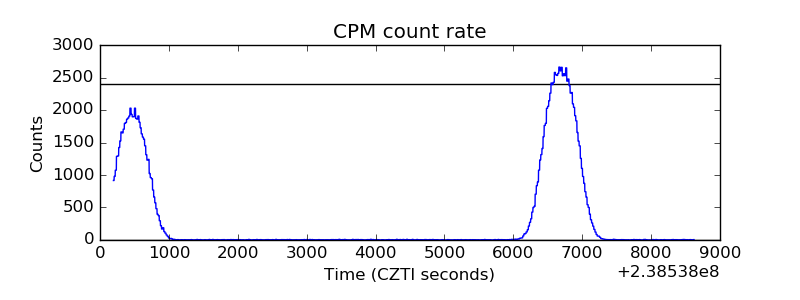 |
| CZT Counter | 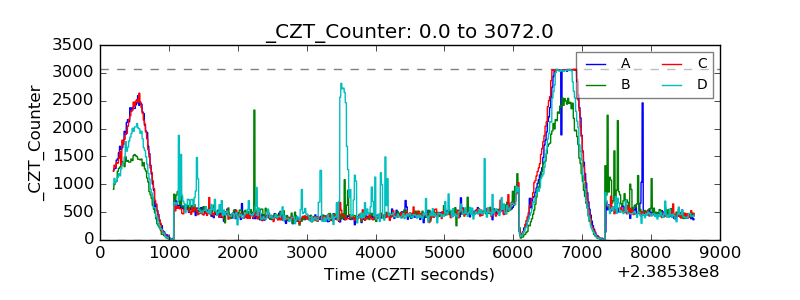 |
| +2.5 Volts monitor | 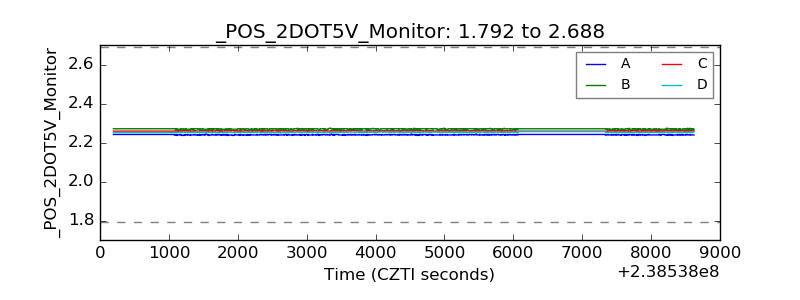 |
| +5 Volts monitor |  |
| _ROLL_ROT | 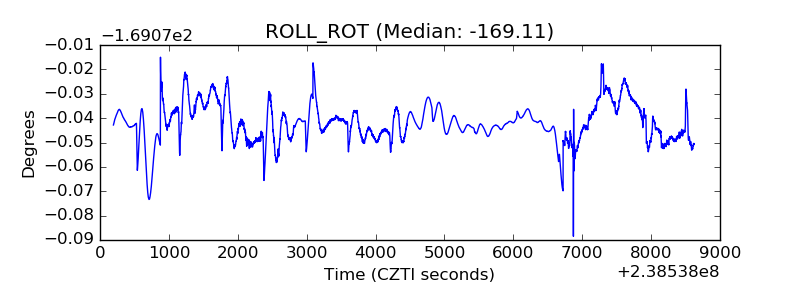 |
| _Roll_DEC | 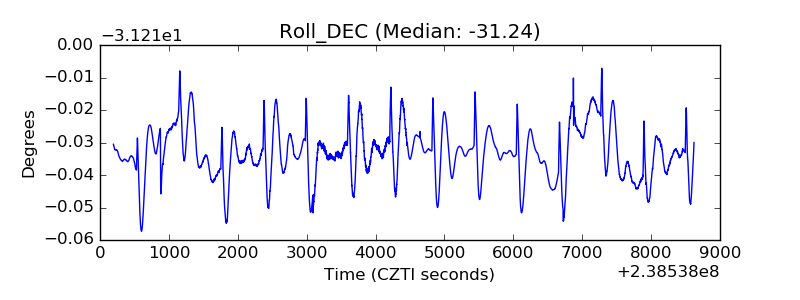 |
| _Roll_RA | 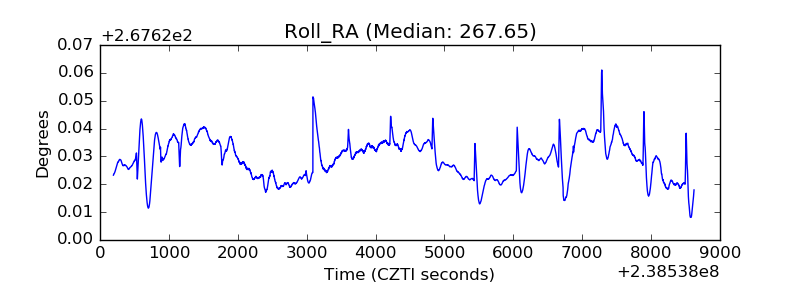 |
| Veto Counter | 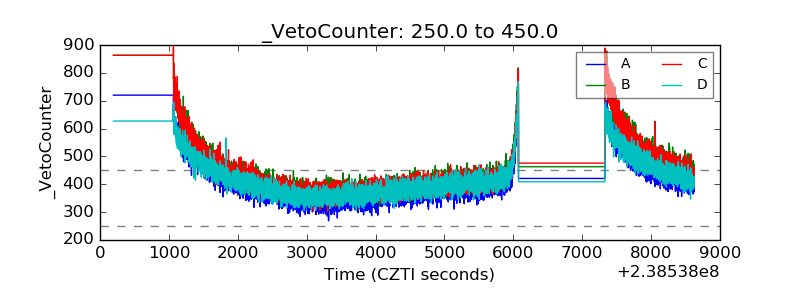 |