| Param | Original file | Final file |
|---|---|---|
| Filename | modeM0/AS1G07_020T01_9000001398_09841cztM0_level2.evt | modeM0/AS1G07_020T01_9000001398_09841cztM0_level2_quad_clean.evt |
| Size (bytes) | 59,765,760 | 18,627,840 |
| Size | 57.0 MB | 17.8 MB |
| Events in quadrant A | 446,862 | 123,031 |
| Events in quadrant B | 461,347 | 124,417 |
| Events in quadrant C | 418,166 | 128,469 |
| Events in quadrant D | 419,652 | 118,143 |
| Mode M0 | |||
|---|---|---|---|
| Quadrant | BADHDUFLAG | Total packets | Discarded packets |
| A | 0 | 3320 | 1439 |
| B | 0 | 3684 | 1777 |
| C | 0 | 3080 | 1264 |
| D | 0 | 3198 | 1367 |
| Mode SS | |||
|---|---|---|---|
| Quadrant | BADHDUFLAG | Total packets | Discarded packets |
| A | 0 | 30 | 10 |
| B | 0 | 30 | 8 |
| C | 0 | 30 | 14 |
| D | 0 | 30 | 10 |
| Mode M9 | |||
|---|---|---|---|
| Quadrant | BADHDUFLAG | Total packets | Discarded packets |
| A | 0 | 4 | 0 |
| B | 0 | 4 | 1 |
| C | 0 | 4 | 0 |
| D | 0 | 5 | 2 |
| Quadrant | Total seconds | Saturated seconds | Saturation percentage |
|---|---|---|---|
| A | 875 | 13 | 1.485714% |
| B | 856 | 5 | 0.584112% |
| C | 898 | 1 | 0.111359% |
| D | 888 | 1 | 0.112613% |
Noise dominated data is calculated using 1-second bins in cleaned event files. If a bin has >2000 counts, and if more than 50% of those come from <1% of pixels, then it is considered to be noise-dominated and hence unusable.
| Quadrant | # 1 sec bins | Bins with >0 counts | Bins with >2000 counts | High rate bins dominated by noise | Noise dominated (total time) | Noise dominated (detector-on time) | Marked lightcurve |
|---|---|---|---|---|---|---|---|
| A | 1499 | 1080 | 5 | 5 | 0.33% | 0.46% | 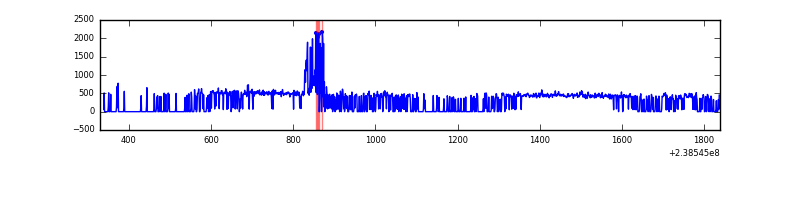 |
| B | 1496 | 1059 | 0 | 0 | 0.00% | 0.00% | 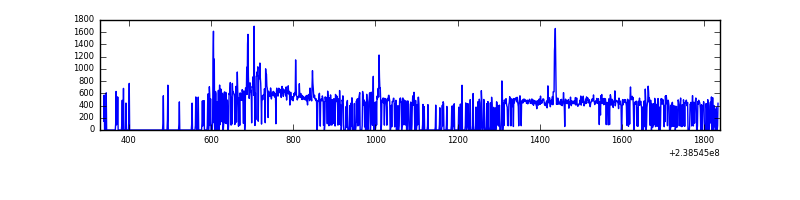 |
| C | 1509 | 1107 | 0 | 0 | 0.00% | 0.00% | 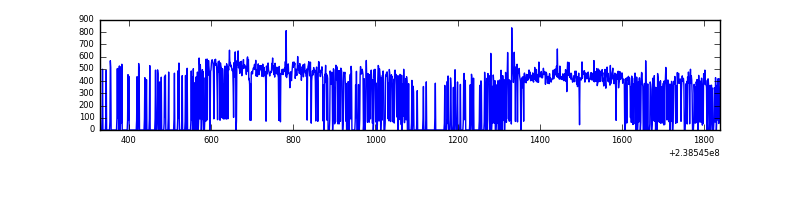 |
| D | 1503 | 1081 | 2 | 2 | 0.13% | 0.19% | 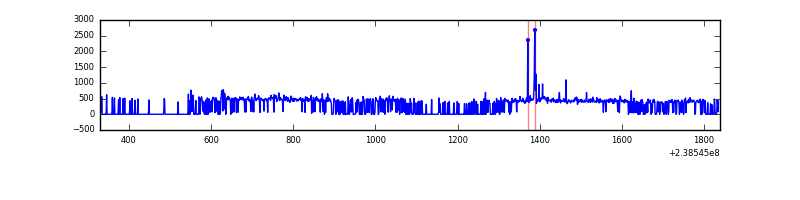 |
Top three noisy pixels from each quadrant. If the there are fewer than three noisy pixels in the level2.evt file, extra rows are filled as -1
| Pixel properties | Quadrant properties | ||||||
|---|---|---|---|---|---|---|---|
| Quadrant | DetID | PixID | Counts | Sigma | Mean | Median | Sigma |
| A | 4 | 2 | 37237 | 1590.8 | 105 | 104 | 23.3 |
| A | 0 | 226 | 1039 | 40.06 | 105 | 104 | 23.3 |
| A | 14 | 111 | 944 | 35.99 | 105 | 104 | 23.3 |
| B | 4 | 81 | 22210 | 995.88 | 105 | 103 | 22.2 |
| B | 4 | 239 | 8188 | 364.22 | 105 | 103 | 22.2 |
| B | 4 | 173 | 6477 | 287.14 | 105 | 103 | 22.2 |
| C | 12 | 4 | 3408 | 127.35 | 105 | 106 | 25.9 |
| C | 4 | 254 | 944 | 32.32 | 105 | 106 | 25.9 |
| C | 13 | 61 | 803 | 26.88 | 105 | 106 | 25.9 |
| D | 10 | 253 | 8977 | 332.75 | 101 | 98 | 26.7 |
| D | 1 | 52 | 5649 | 208.03 | 101 | 98 | 26.7 |
| D | 2 | 234 | 5047 | 185.47 | 101 | 98 | 26.7 |
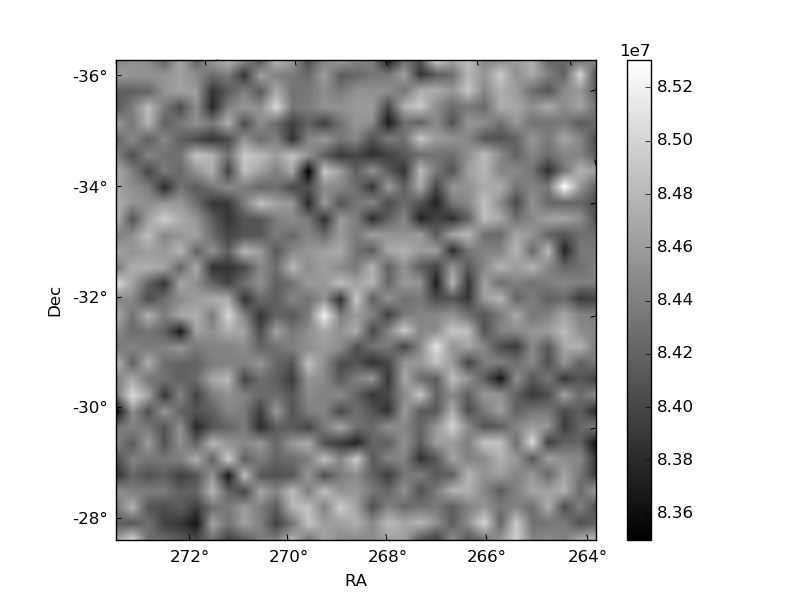
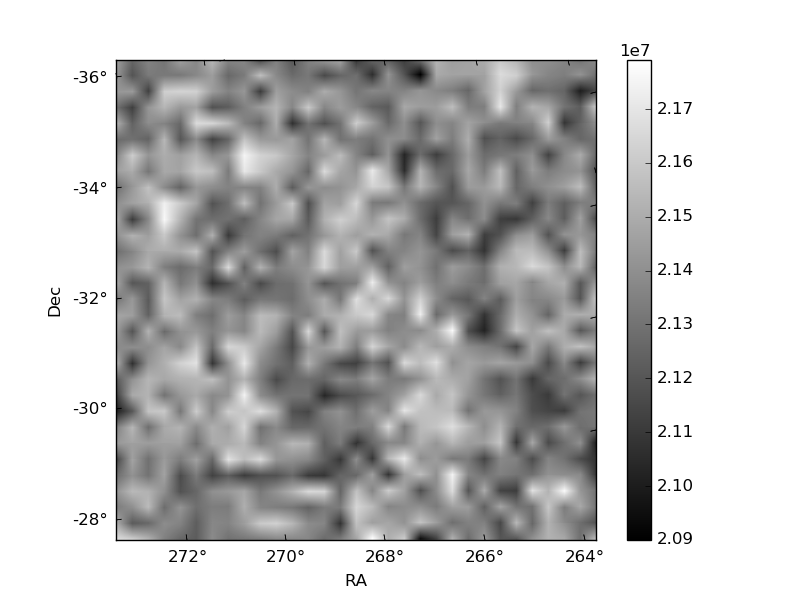
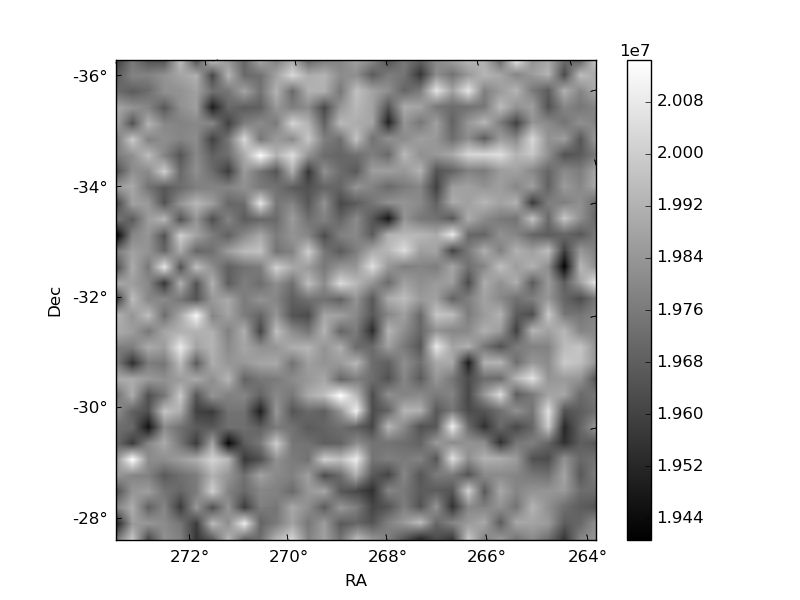
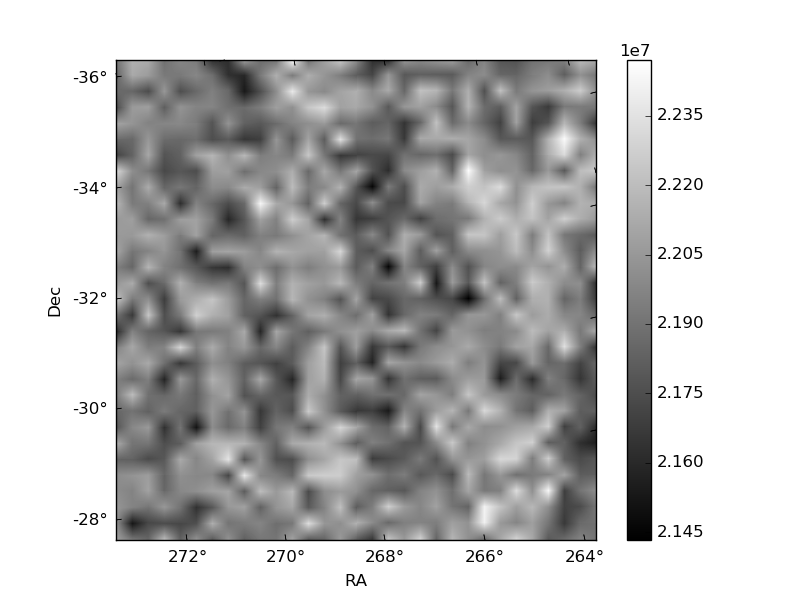
Histogram calculated using DETX and DETY for each event in the final _common_clean file
| Quadrant A | 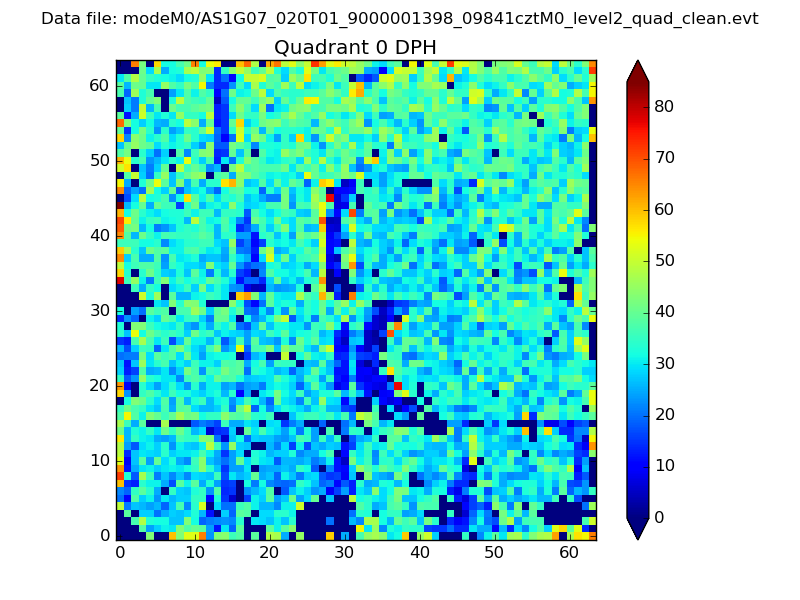 |
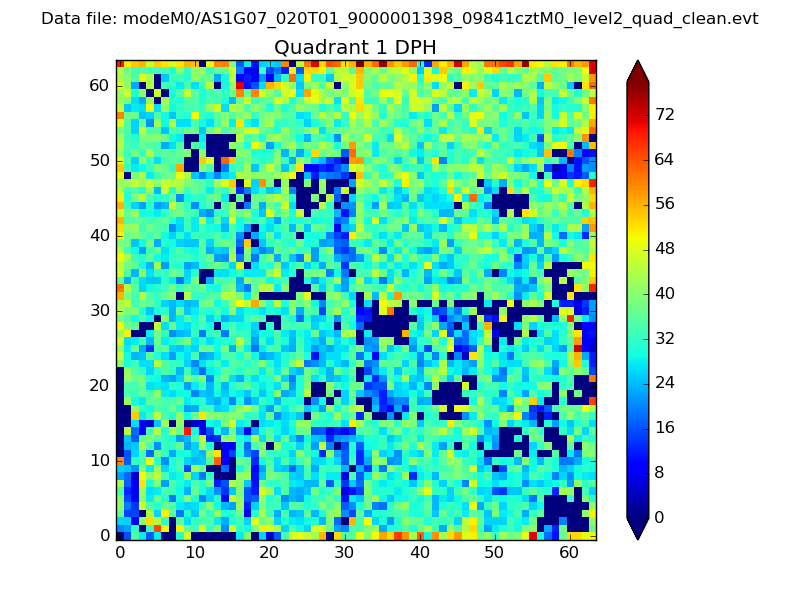 |
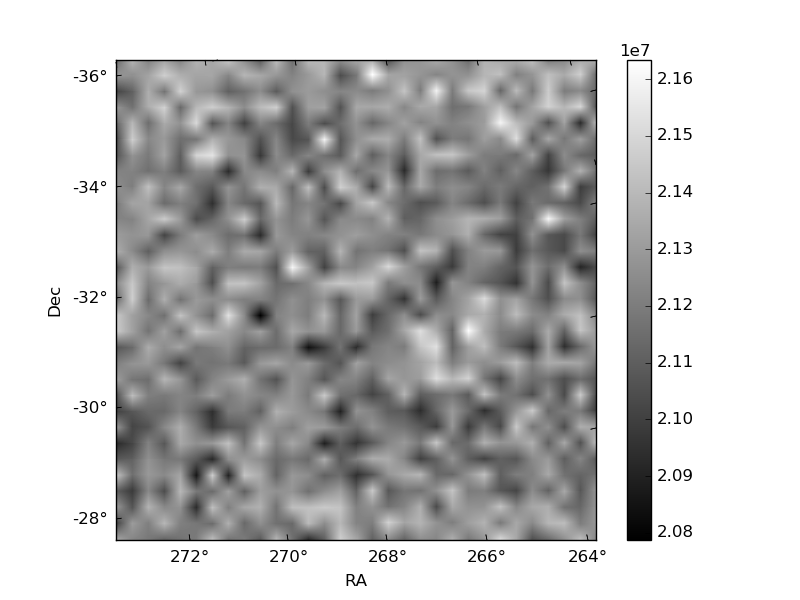
Quadrant B |
|---|---|---|---|
| Quadrant D | 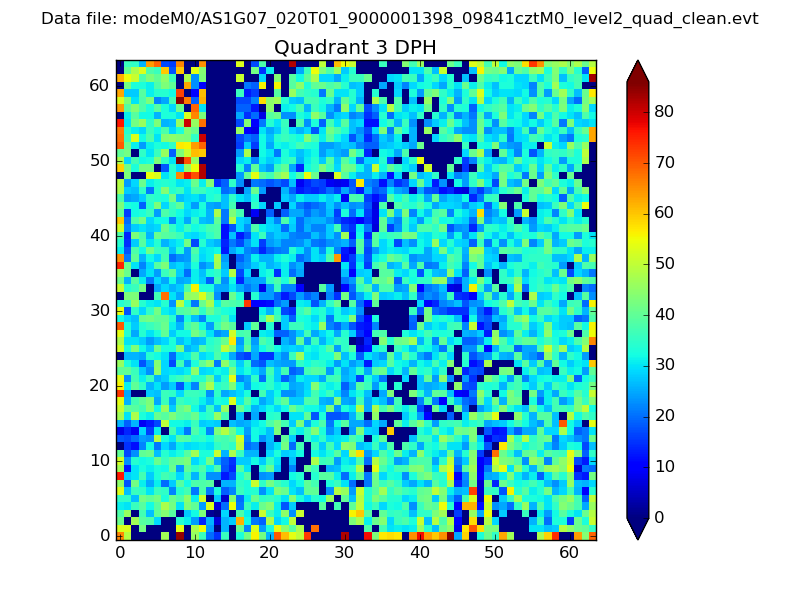 |
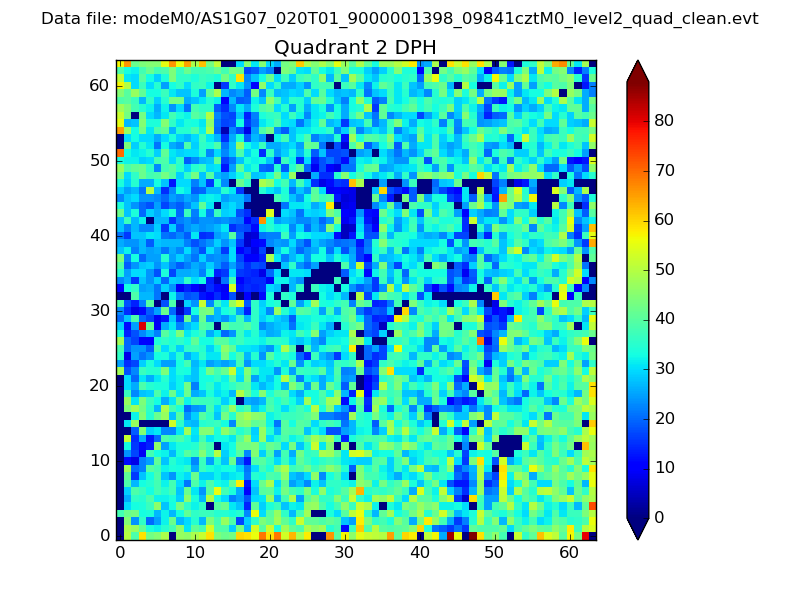 |
Quadrant C |
| Plot type | Count rate plots | Images |
|---|---|---|
| Comparison with Poisson distribution Blue bars denote a histogram of data divided into 1 sec bins. Red curve is a Poisson curve with rate = median count rate of data. |
 |
 |
| Quadrant-wise count rates Data is divided into 100 sec bins |
 |
|
| Module-wise count rates for Quadrant A Data is divided into 100 sec bins |
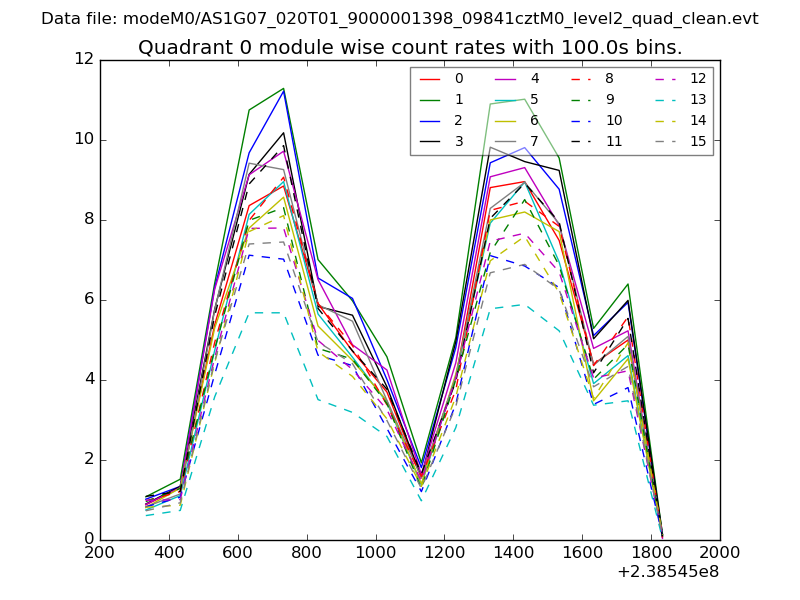 |
 |
| Module-wise count rates for Quadrant B Data is divided into 100 sec bins |
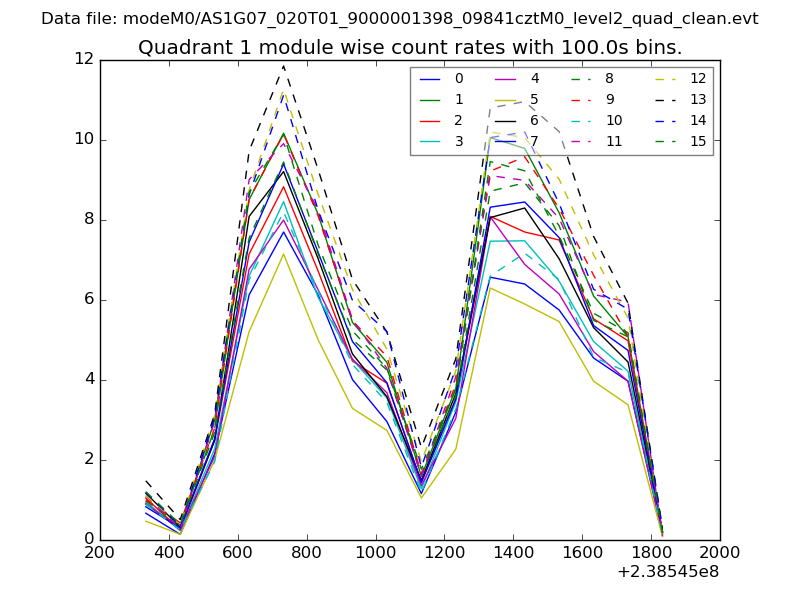 |
 |
| Module-wise count rates for Quadrant C Data is divided into 100 sec bins |
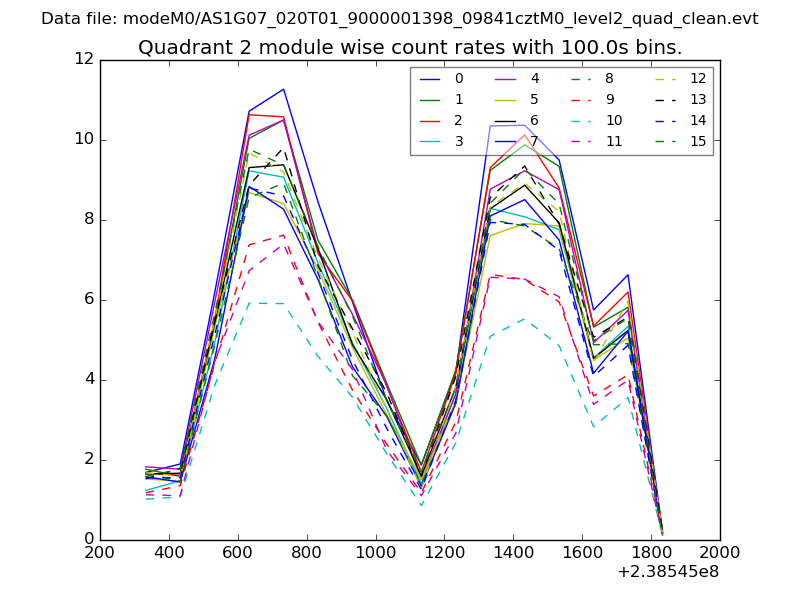 |
 |
| Module-wise count rates for Quadrant D Data is divided into 100 sec bins |
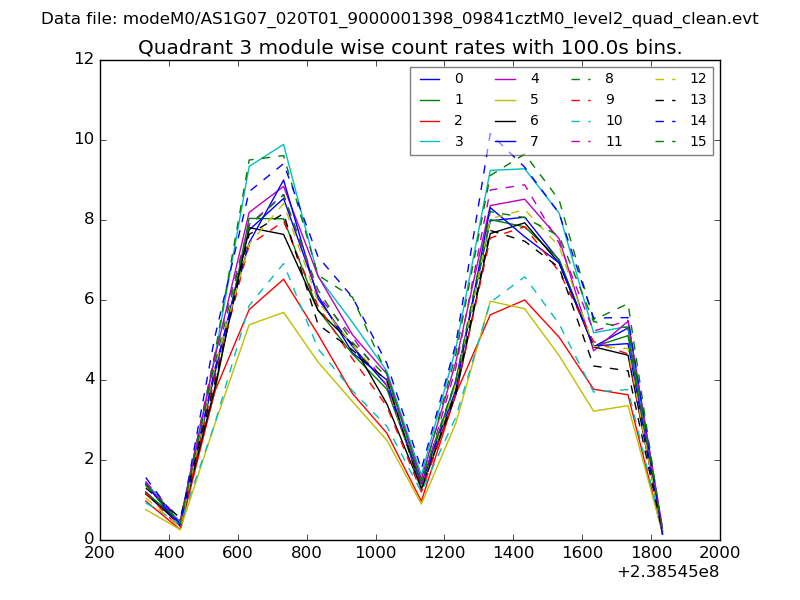 |
 |
| Parameter | Plot |
|---|---|
| CZT HV Monitor | 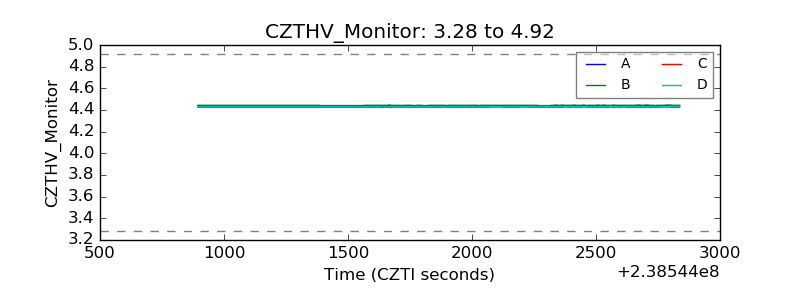 |
| D_VDD | 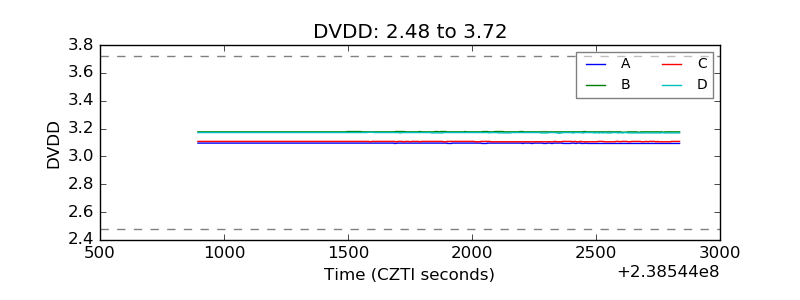 |
| Temperature 1 | 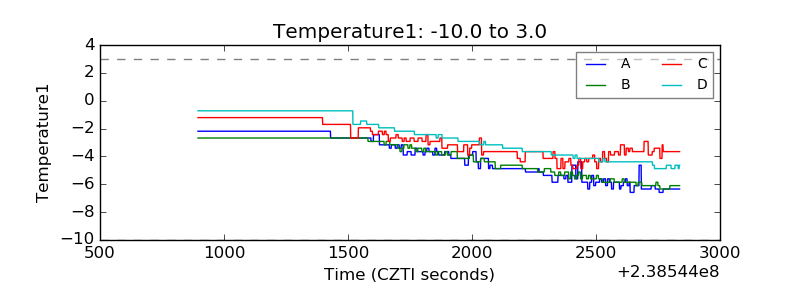 |
| Veto HV Monitor | 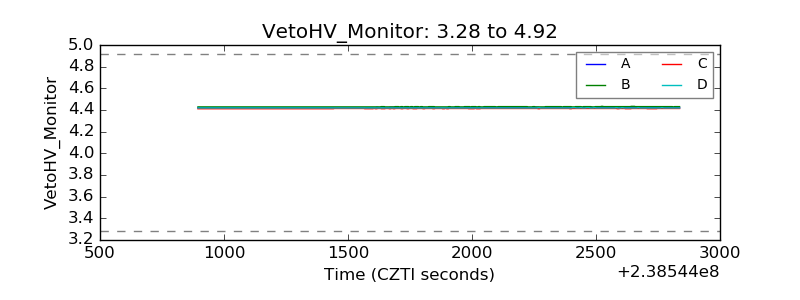 |
| Veto LLD | 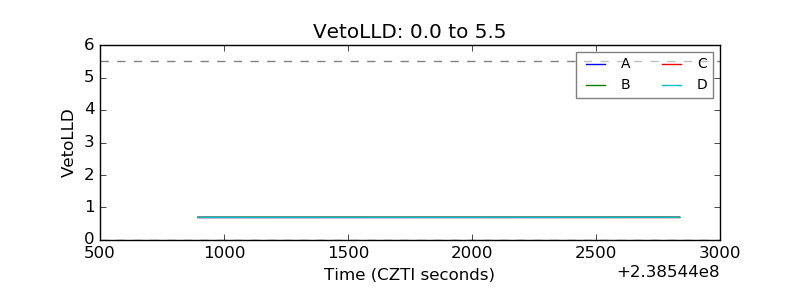 |
| Alpha Counter |  |
| _CPM_Rate | 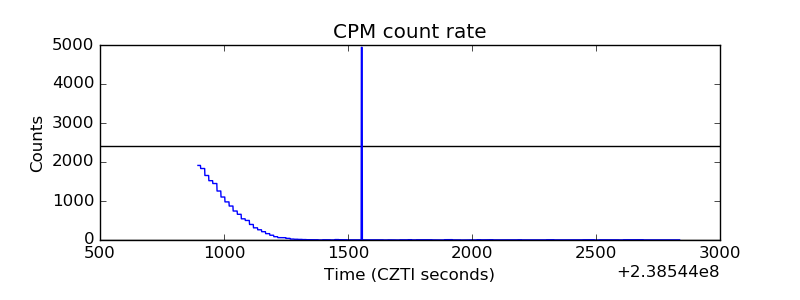 |
| CZT Counter | 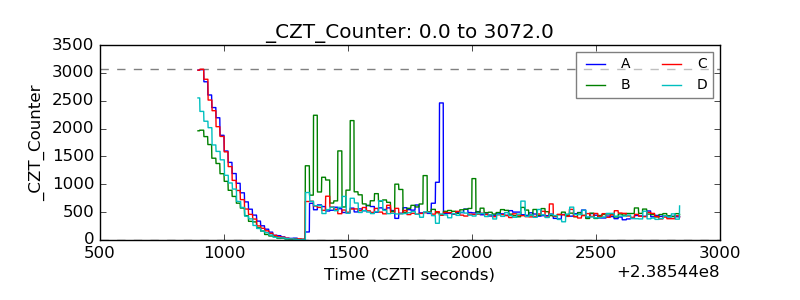 |
| +2.5 Volts monitor |  |
| +5 Volts monitor |  |
| _ROLL_ROT | 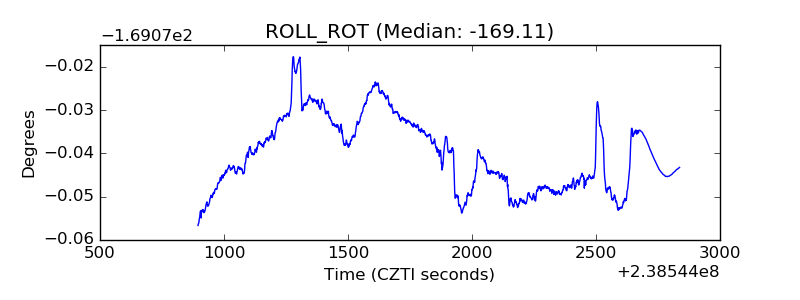 |
| _Roll_DEC | 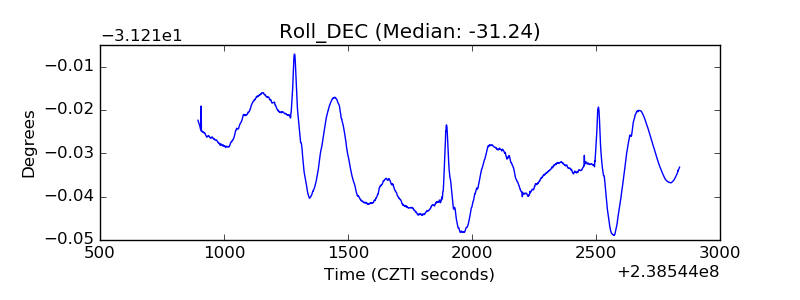 |
| _Roll_RA | 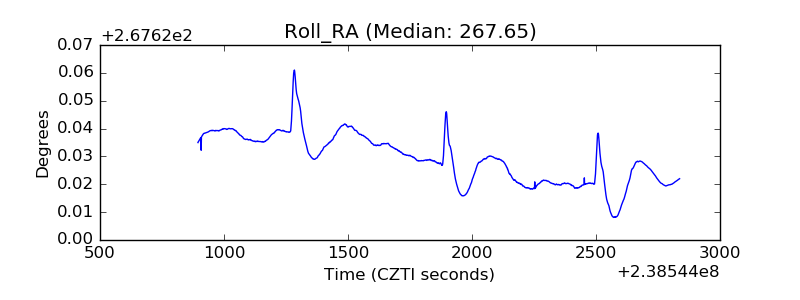 |
| Veto Counter | 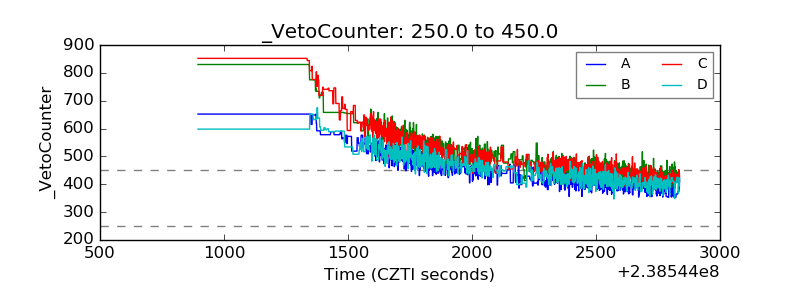 |