| Param | Original file | Final file |
|---|---|---|
| Filename | modeM0/AS1G07_035T01_9000001396_09822cztM0_level2.evt | modeM0/AS1G07_035T01_9000001396_09822cztM0_level2_quad_clean.evt |
| Size (bytes) | 600,606,720 | 112,394,880 |
| Size | 572.8 MB | 107.2 MB |
| Events in quadrant A | 4,234,118 | 707,975 |
| Events in quadrant B | 4,338,081 | 712,853 |
| Events in quadrant C | 4,105,027 | 689,586 |
| Events in quadrant D | 4,892,521 | 660,989 |
| Mode M9 | |||
|---|---|---|---|
| Quadrant | BADHDUFLAG | Total packets | Discarded packets |
| A | 0 | 10 | 0 |
| B | 0 | 10 | 0 |
| C | 0 | 10 | 0 |
| D | 0 | 10 | 0 |
| Mode SS | |||
|---|---|---|---|
| Quadrant | BADHDUFLAG | Total packets | Discarded packets |
| A | 0 | 200 | 22 |
| B | 0 | 200 | 12 |
| C | 0 | 200 | 16 |
| D | 0 | 200 | 8 |
| Mode M0 | |||
|---|---|---|---|
| Quadrant | BADHDUFLAG | Total packets | Discarded packets |
| A | 0 | 20097 | 1430 |
| B | 0 | 20292 | 1515 |
| C | 0 | 20011 | 1414 |
| D | 0 | 22211 | 1922 |
| Quadrant | Total seconds | Saturated seconds | Saturation percentage |
|---|---|---|---|
| A | 9135 | 98 | 1.072797% |
| B | 9113 | 133 | 1.459454% |
| C | 9138 | 90 | 0.984898% |
| D | 9031 | 123 | 1.361975% |
Noise dominated data is calculated using 1-second bins in cleaned event files. If a bin has >2000 counts, and if more than 50% of those come from <1% of pixels, then it is considered to be noise-dominated and hence unusable.
| Quadrant | # 1 sec bins | Bins with >0 counts | Bins with >2000 counts | High rate bins dominated by noise | Noise dominated (total time) | Noise dominated (detector-on time) | Marked lightcurve |
|---|---|---|---|---|---|---|---|
| A | 10797 | 9723 | 1 | 1 | 0.01% | 0.01% | 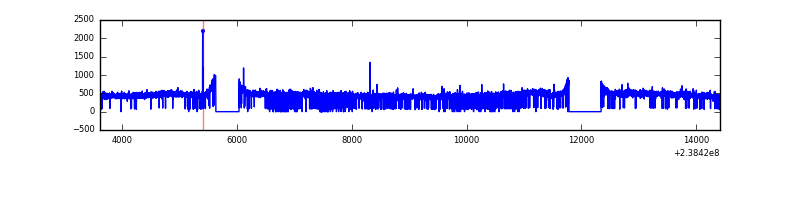 |
| B | 10797 | 9727 | 1 | 1 | 0.01% | 0.01% | 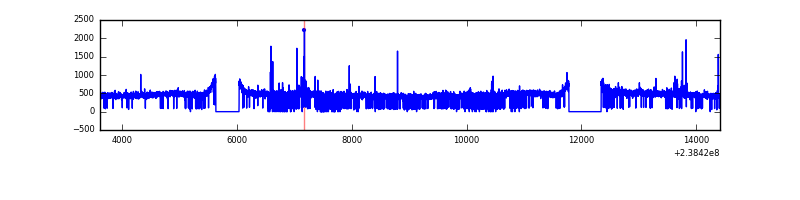 |
| C | 10797 | 9726 | 0 | 0 | 0.00% | 0.00% | 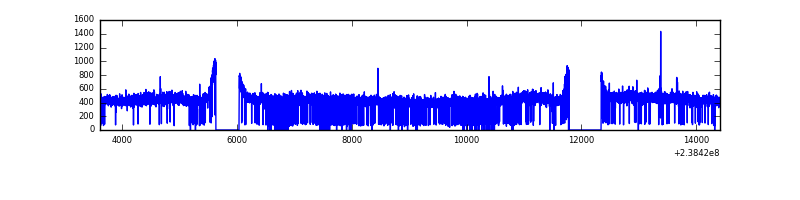 |
| D | 10797 | 9663 | 20 | 20 | 0.19% | 0.21% | 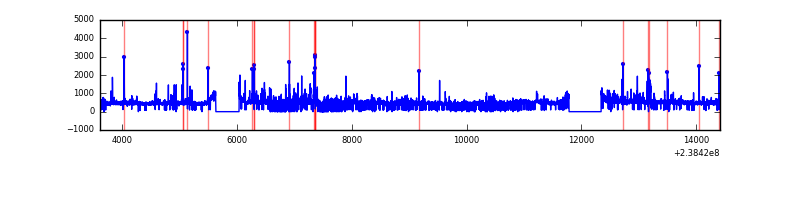 |
Top three noisy pixels from each quadrant. If the there are fewer than three noisy pixels in the level2.evt file, extra rows are filled as -1
| Pixel properties | Quadrant properties | ||||||
|---|---|---|---|---|---|---|---|
| Quadrant | DetID | PixID | Counts | Sigma | Mean | Median | Sigma |
| A | 1 | 162 | 24261 | 103.39 | 1088 | 1063 | 224.4 |
| A | 0 | 226 | 9832 | 39.08 | 1088 | 1063 | 224.4 |
| A | 13 | 248 | 9474 | 37.49 | 1088 | 1063 | 224.4 |
| B | 0 | 85 | 37387 | 172.48 | 1086 | 1059 | 210.6 |
| B | 12 | 111 | 24394 | 110.79 | 1086 | 1059 | 210.6 |
| B | 11 | 111 | 20126 | 90.53 | 1086 | 1059 | 210.6 |
| C | 13 | 61 | 7823 | 27.47 | 1050 | 1054 | 246.4 |
| C | 10 | 22 | 6815 | 23.38 | 1050 | 1054 | 246.4 |
| C | 9 | 54 | 4328 | 13.29 | 1050 | 1054 | 246.4 |
| D | 5 | 113 | 474057 | 1760.84 | 1029 | 1003 | 268.7 |
| D | 2 | 152 | 200397 | 742.2 | 1029 | 1003 | 268.7 |
| D | 1 | 52 | 159397 | 589.59 | 1029 | 1003 | 268.7 |
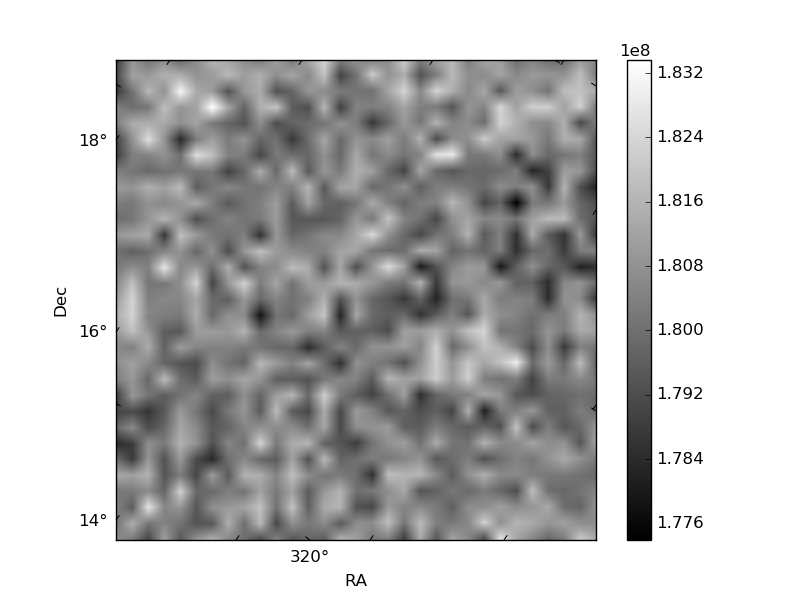
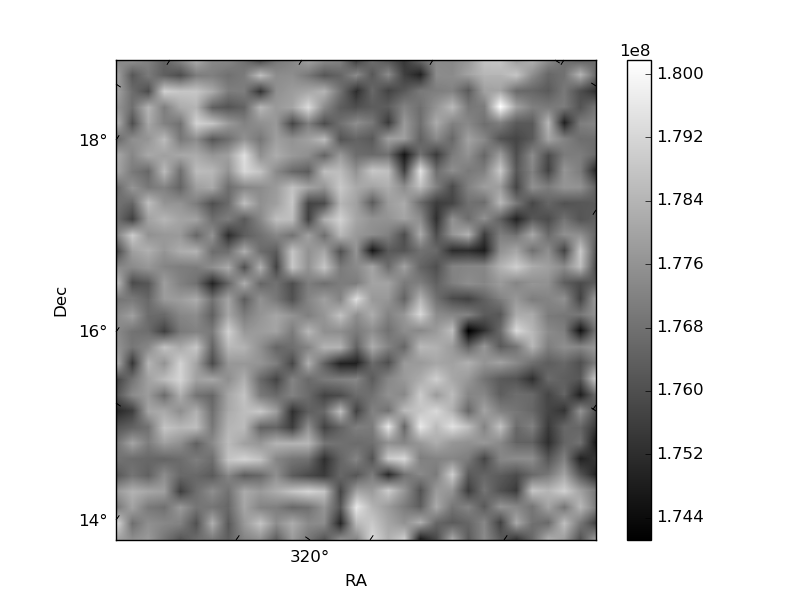
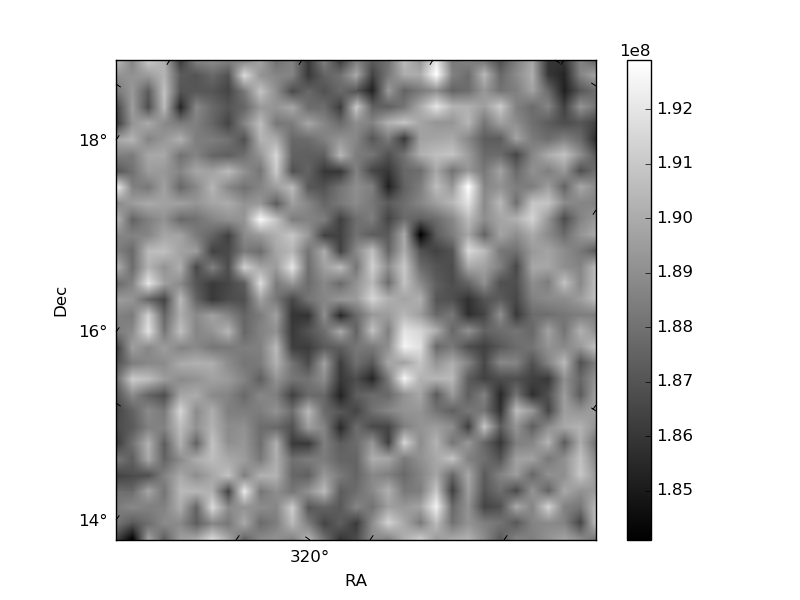
Histogram calculated using DETX and DETY for each event in the final _common_clean file
| Quadrant A | 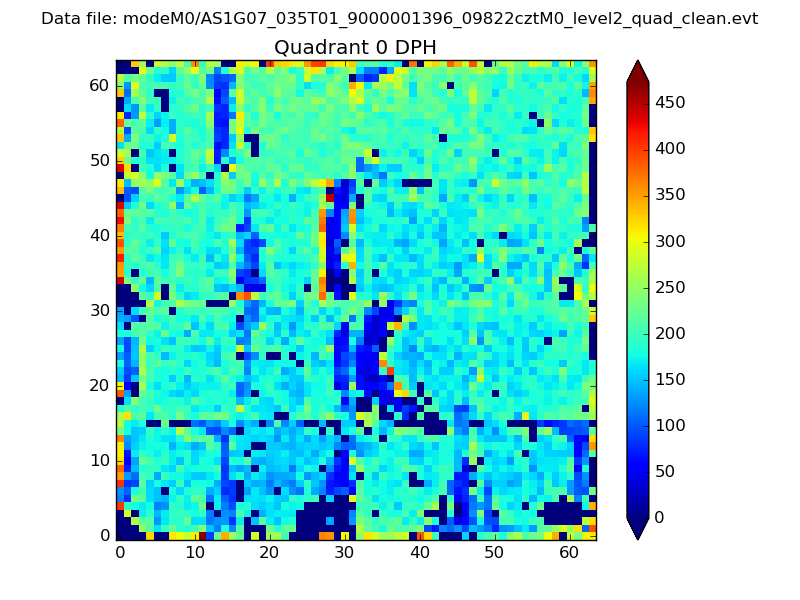 |
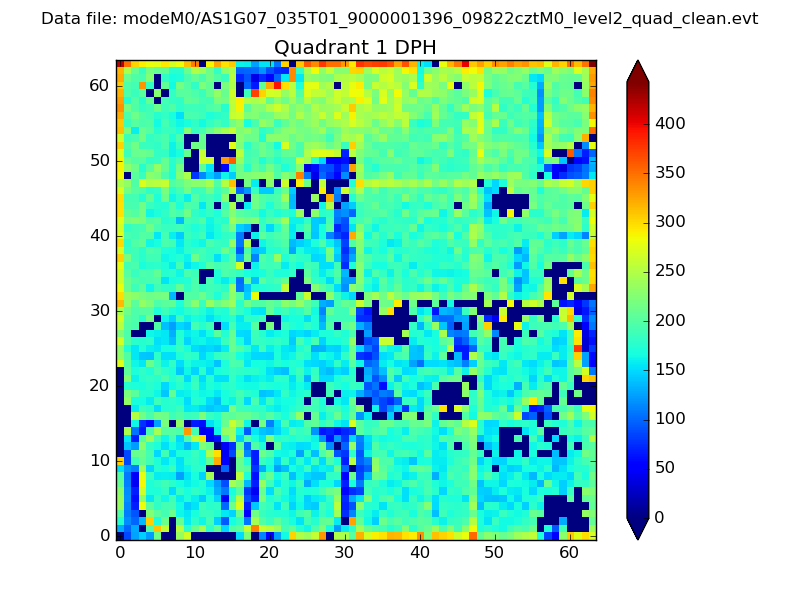 |
Quadrant B |
|---|---|---|---|
| Quadrant D | 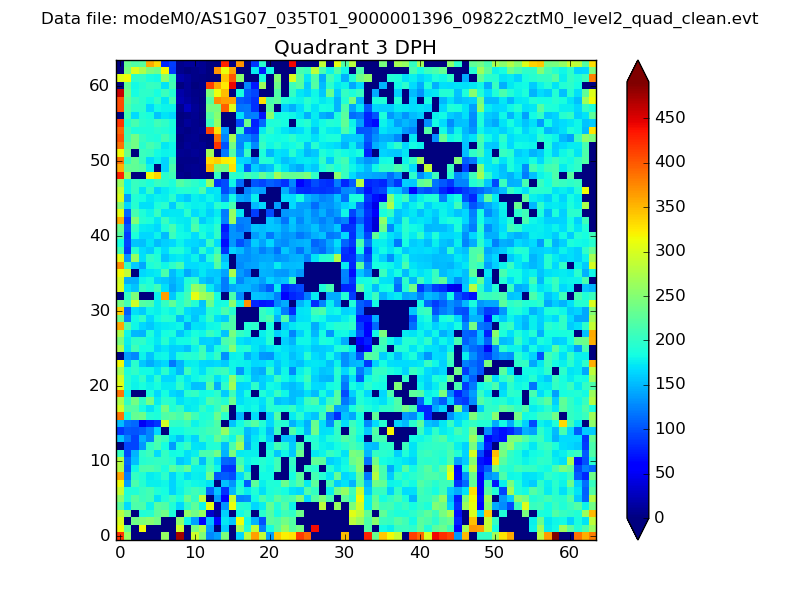 |
 |
Quadrant C |
| Plot type | Count rate plots | Images |
|---|---|---|
| Comparison with Poisson distribution Blue bars denote a histogram of data divided into 1 sec bins. Red curve is a Poisson curve with rate = median count rate of data. |
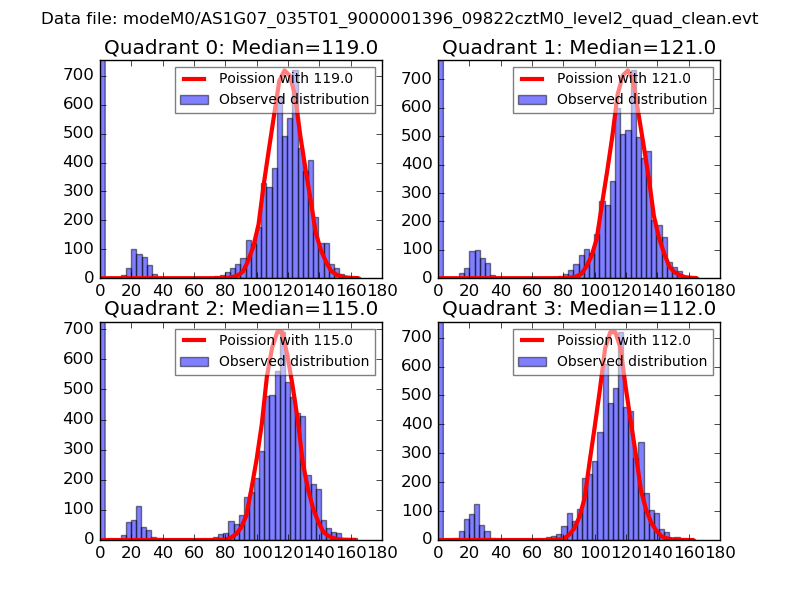 |
 |
| Quadrant-wise count rates Data is divided into 100 sec bins |
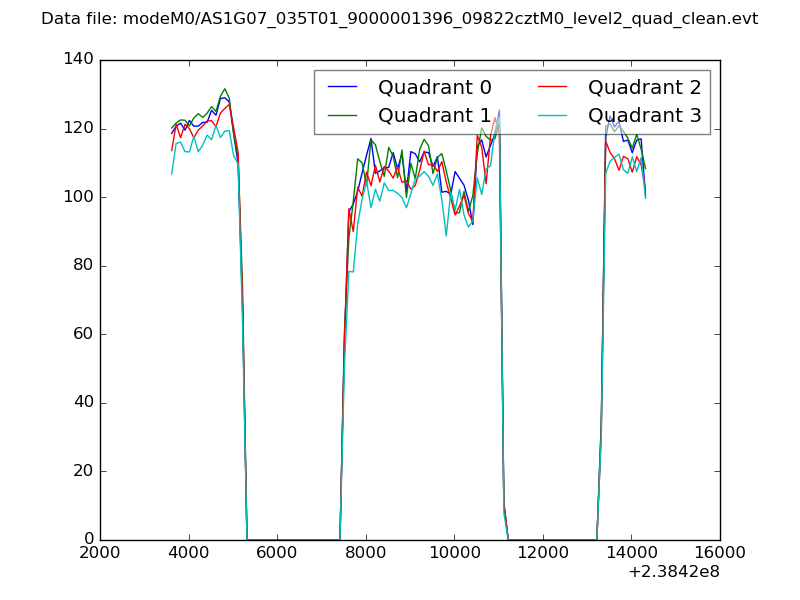 |
|
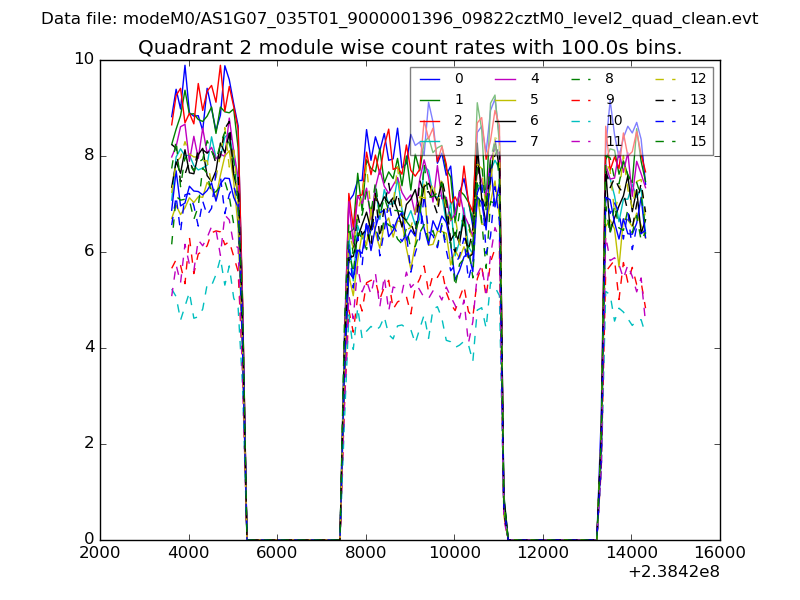
| Module-wise count rates for Quadrant A Data is divided into 100 sec bins |
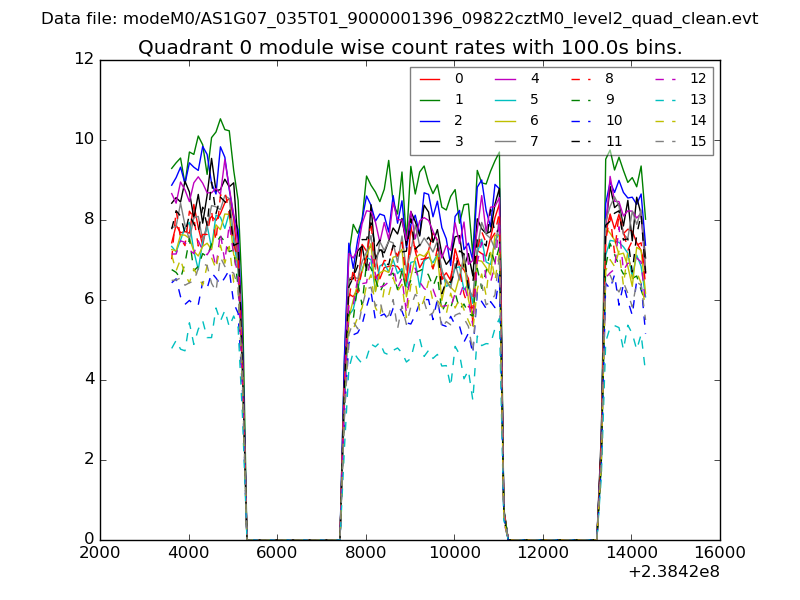 |
 |
| Module-wise count rates for Quadrant B Data is divided into 100 sec bins |
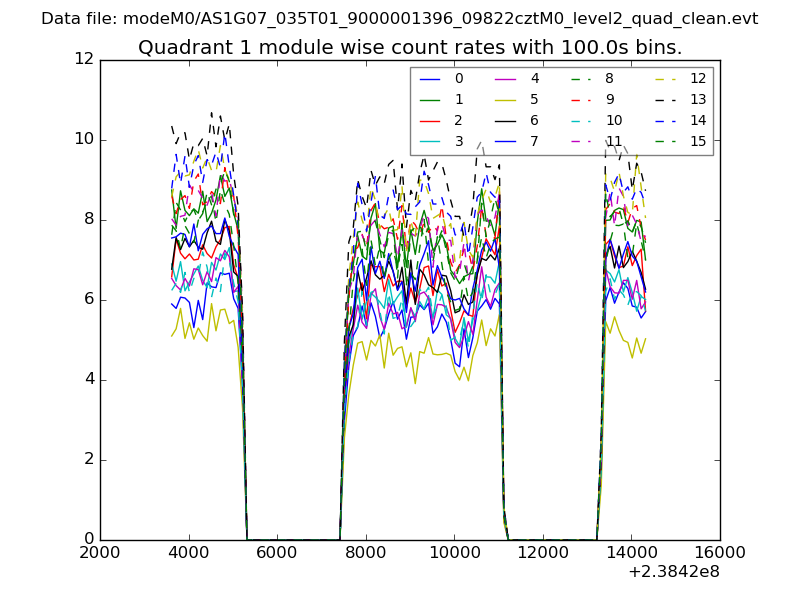 |
 |
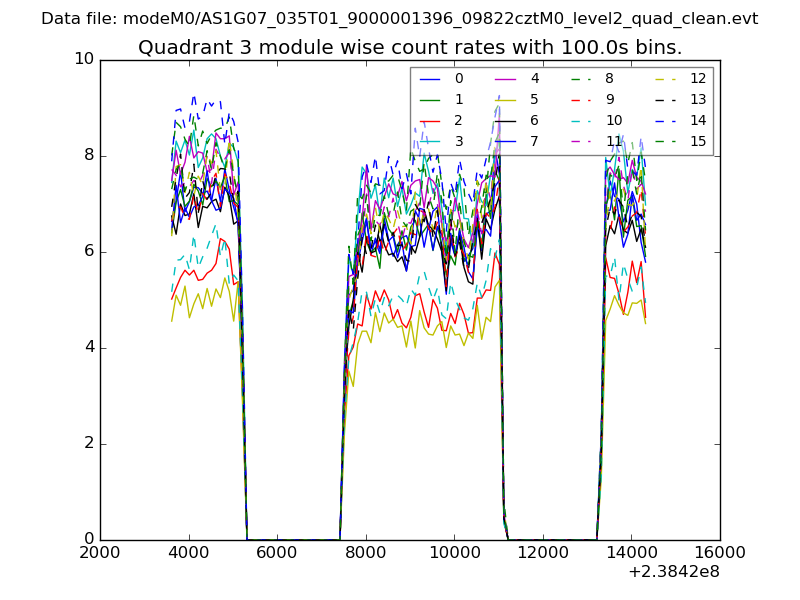
| Module-wise count rates for Quadrant C Data is divided into 100 sec bins |
 |
 |
| Module-wise count rates for Quadrant D Data is divided into 100 sec bins |
 |
 |
| Parameter | Plot |
|---|---|
| CZT HV Monitor | 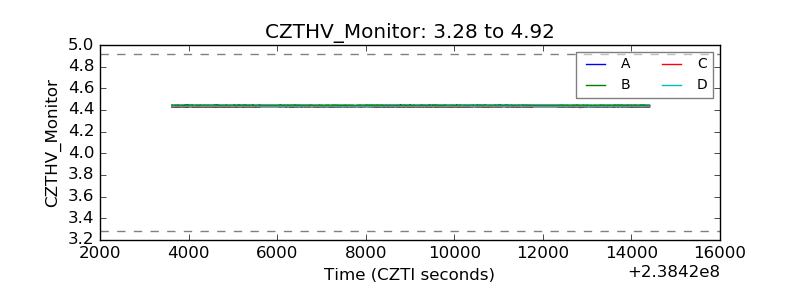 |
| D_VDD | 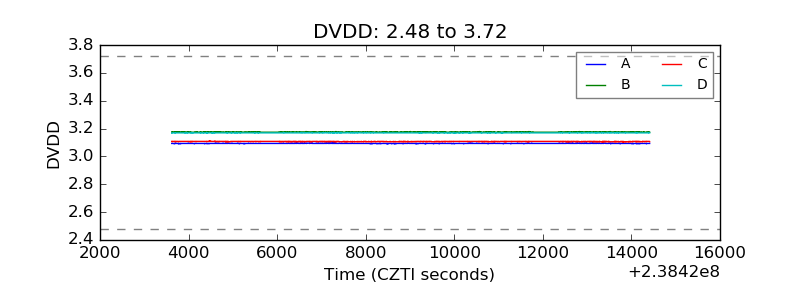 |
| Temperature 1 | 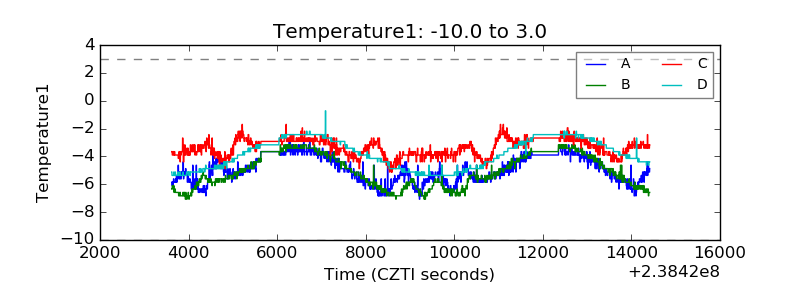 |
| Veto HV Monitor | 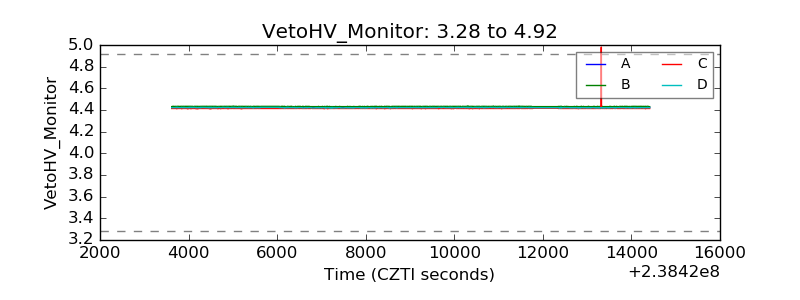 |
| Veto LLD | 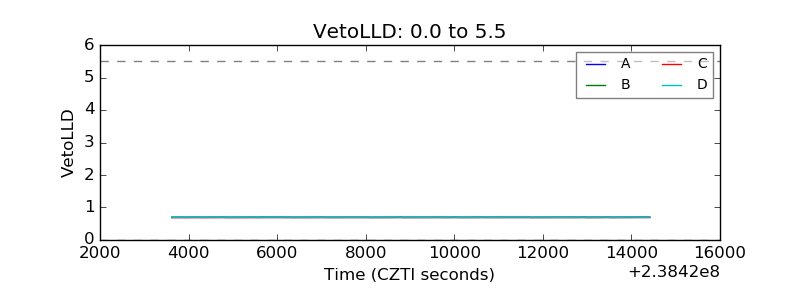 |
| Alpha Counter | 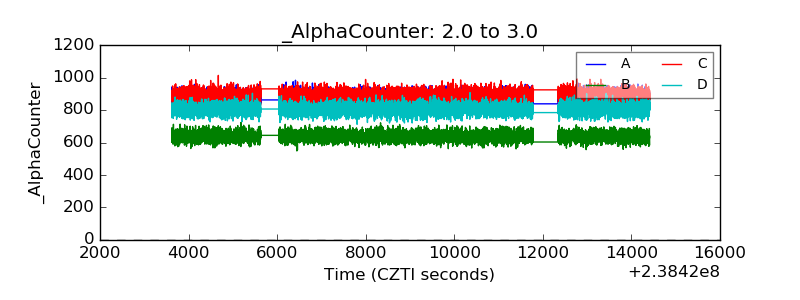 |
| _CPM_Rate | 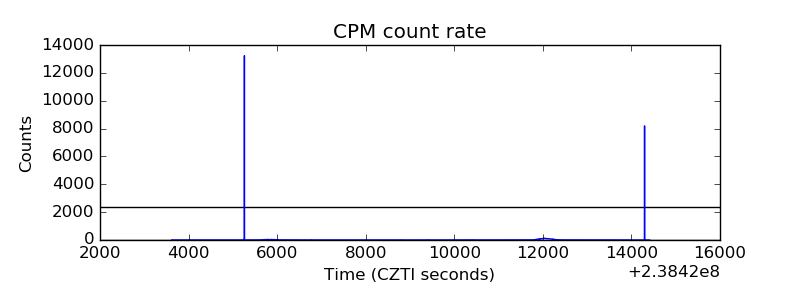 |
| CZT Counter | 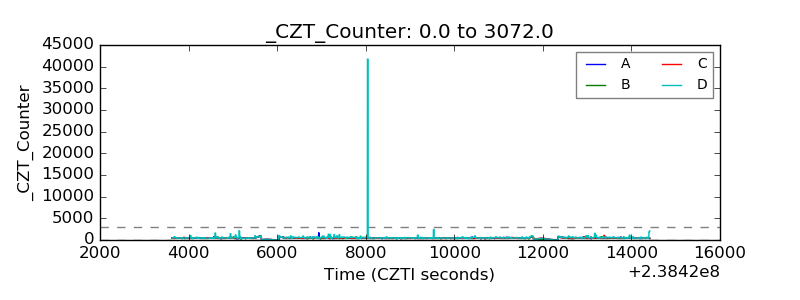 |
| +2.5 Volts monitor |  |
| +5 Volts monitor |  |
| _ROLL_ROT | 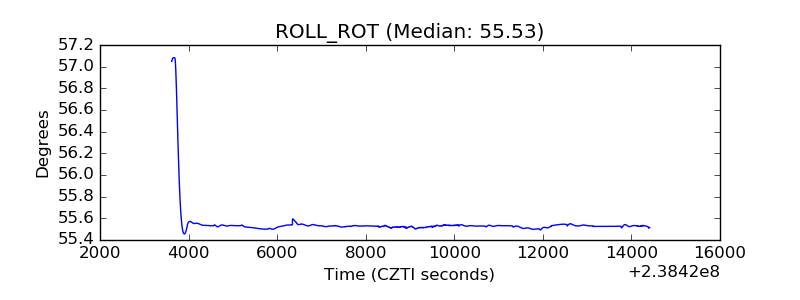 |
| _Roll_DEC | 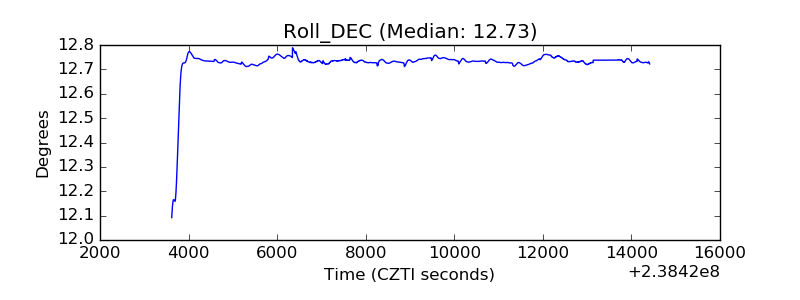 |
| _Roll_RA | 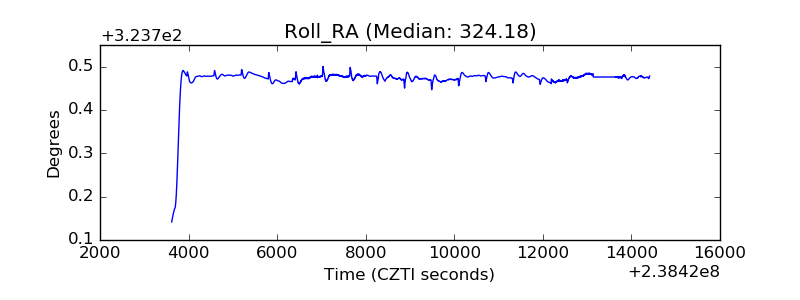 |
| Veto Counter | 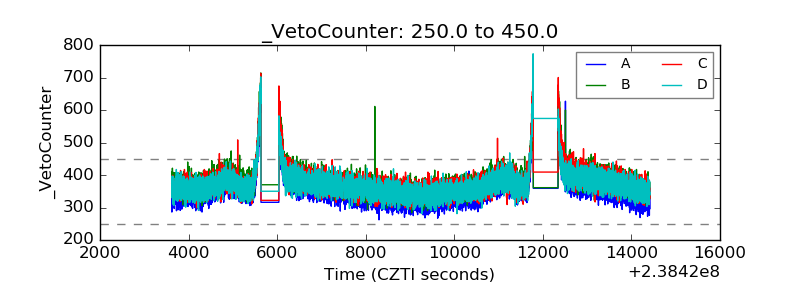 |