| Param | Original file | Final file |
|---|---|---|
| Filename | modeM0/AS1A03_134T01_9000001400cztM0_level2.fits | modeM0/AS1A03_134T01_9000001400cztM0_level2_quad_clean.evt |
| Size (bytes) | 530,804,160 | 542,050,560 |
| Size | 506.2 MB | 516.9 MB |
| Events in quadrant A | 3,200,219 | 3,283,263 |
| Events in quadrant B | 3,094,132 | 3,287,477 |
| Events in quadrant C | 3,153,496 | 3,104,706 |
| Events in quadrant D | 2,666,924 | 2,783,439 |
| Mode M0 | |||
|---|---|---|---|
| Quadrant | BADHDUFLAG | Total packets | Discarded packets |
| A | 0 | 118799 | 0 |
| B | 0 | 121011 | 0 |
| C | 0 | 118724 | 0 |
| D | 0 | 155058 | 0 |
| Mode SS | |||
|---|---|---|---|
| Quadrant | BADHDUFLAG | Total packets | Discarded packets |
| A | 0 | 1178 | 0 |
| B | 0 | 1158 | 0 |
| C | 0 | 1176 | 0 |
| D | 0 | 1178 | 0 |
| Mode M9 | |||
|---|---|---|---|
| Quadrant | BADHDUFLAG | Total packets | Discarded packets |
| A | 0 | 81 | 0 |
| B | 0 | 80 | 0 |
| C | 0 | 80 | 0 |
| D | 0 | 80 | 0 |
| Quadrant | Total seconds | Saturated seconds | Saturation percentage |
|---|---|---|---|
| A | 57738 | 1092 | 1.891302% |
| B | 57630 | 1228 | 2.130835% |
| C | 57731 | 873 | 1.512186% |
| D | 57597 | 2802 | 4.864837% |
Noise dominated data is calculated using 1-second bins in cleaned event files. If a bin has >2000 counts, and if more than 50% of those come from <1% of pixels, then it is considered to be noise-dominated and hence unusable.
| Quadrant | # 1 sec bins | Bins with >0 counts | Bins with >2000 counts | High rate bins dominated by noise | Noise dominated (total time) | Noise dominated (detector-on time) | Marked lightcurve |
|---|---|---|---|---|---|---|---|
| A | 68766 | 58793 | 0 | 0 | 0.00% | 0.00% |  |
| B | 68766 | 58698 | 0 | 0 | 0.00% | 0.00% |  |
| C | 68777 | 58821 | 0 | 0 | 0.00% | 0.00% | 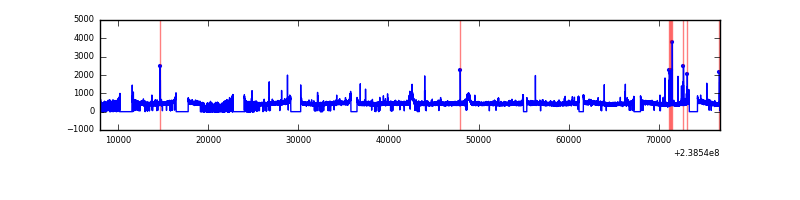 |
| D | 68777 | 58621 | 0 | 0 | 0.00% | 0.00% |  |
Top three noisy pixels from each quadrant. If the there are fewer than three noisy pixels in the level2.evt file, extra rows are filled as -1
| Pixel properties | Quadrant properties | ||||||
|---|---|---|---|---|---|---|---|
| Quadrant | DetID | PixID | Counts | Sigma | Mean | Median | Sigma |
| A | 0 | 29 | 3072 | 10.79 | 831 | 776 | 212.7 |
| A | 7 | 110 | 2731 | 9.19 | 831 | 776 | 212.7 |
| A | 0 | 30 | 2414 | 7.7 | 831 | 776 | 212.7 |
| B | 2 | 9 | 2799 | 12.37 | 816 | 775 | 163.6 |
| B | 14 | 254 | 2094 | 8.06 | 816 | 775 | 163.6 |
| B | 3 | 17 | 2076 | 7.95 | 816 | 775 | 163.6 |
| C | 12 | 241 | 2278 | 6.87 | 834 | 772 | 219.1 |
| C | 9 | 242 | 2107 | 6.09 | 834 | 772 | 219.1 |
| C | 2 | 191 | 2090 | 6.01 | 834 | 772 | 219.1 |
| D | 6 | 231 | 1993 | 6.44 | 760 | 691 | 202.1 |
| D | 3 | 14 | 1973 | 6.34 | 760 | 691 | 202.1 |
| D | 7 | 5 | 1879 | 5.88 | 760 | 691 | 202.1 |
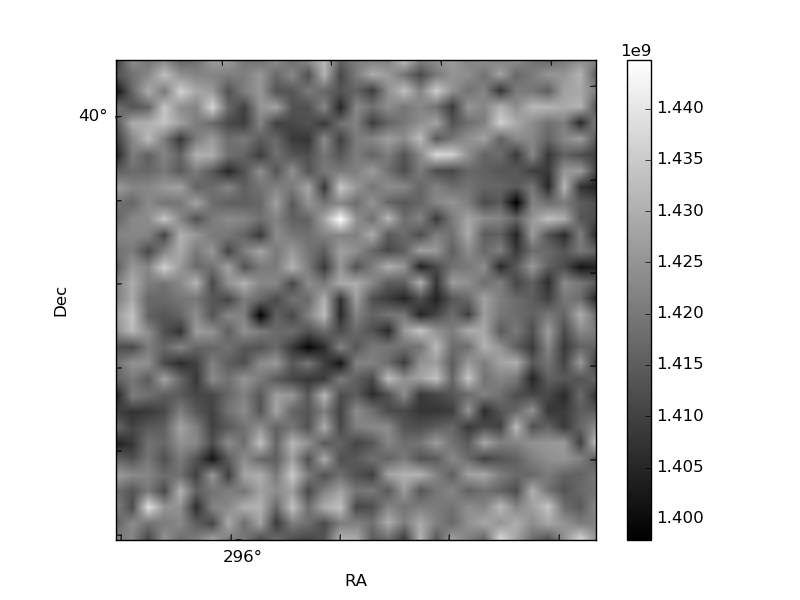
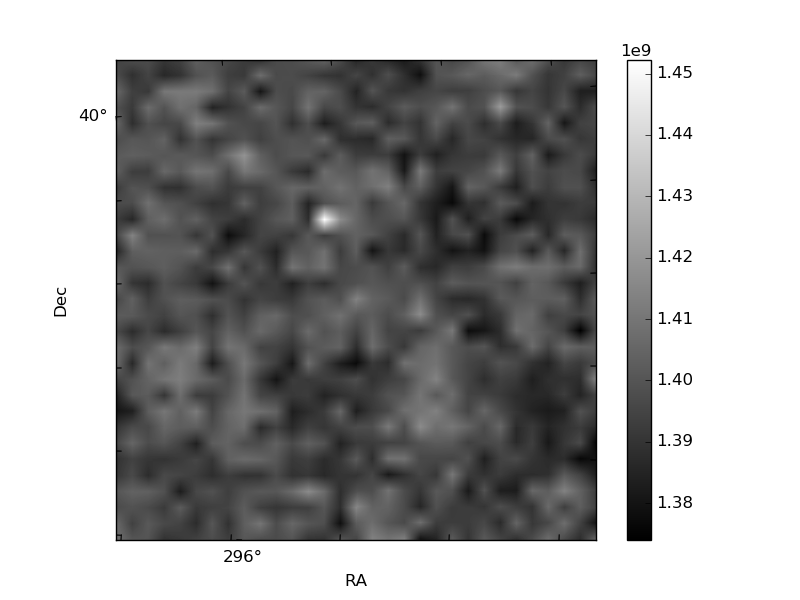
Histogram calculated using DETX and DETY for each event in the final _common_clean file
| Quadrant A | 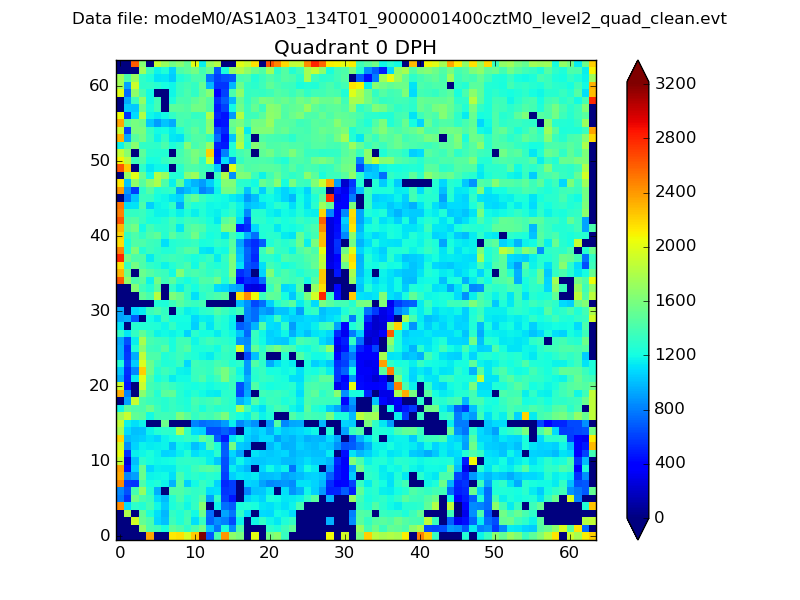 |
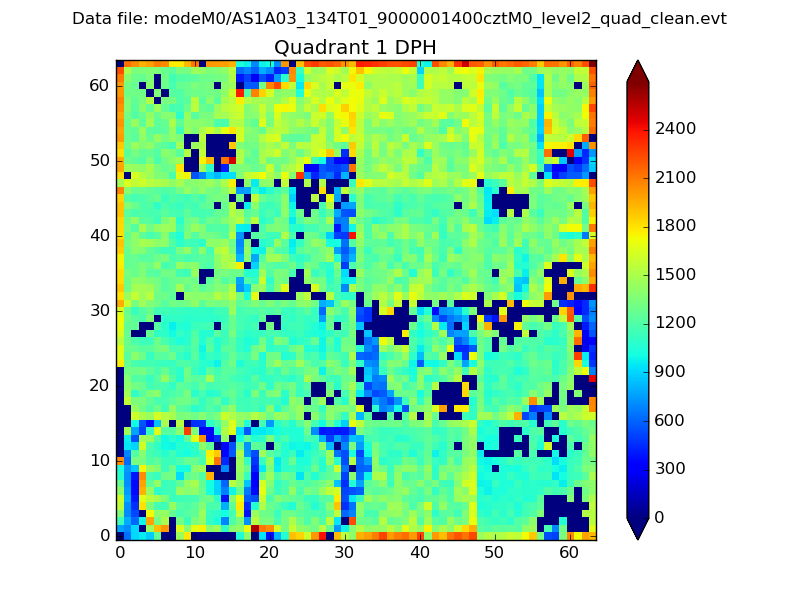 |
Quadrant B |
|---|---|---|---|
| Quadrant D | 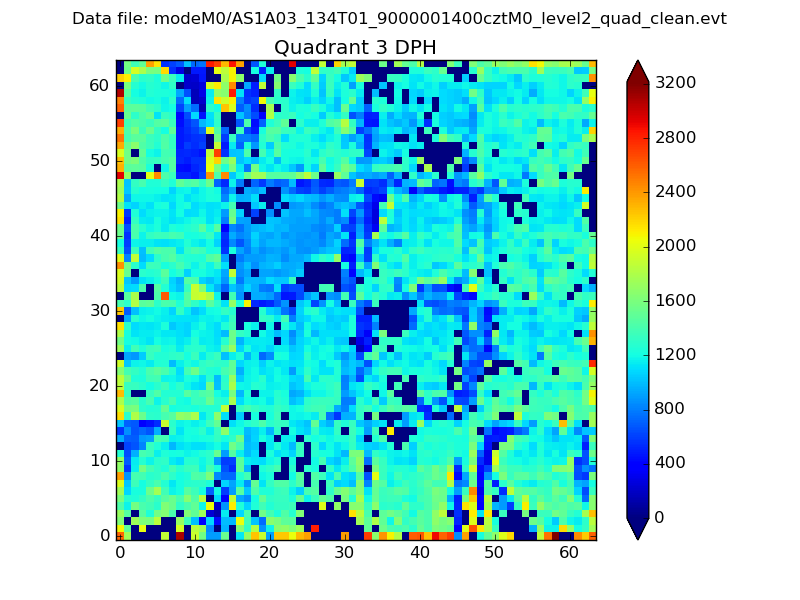 |
 |
Quadrant C |
| Plot type | Count rate plots | Images |
|---|---|---|
| Comparison with Poisson distribution Blue bars denote a histogram of data divided into 1 sec bins. Red curve is a Poisson curve with rate = median count rate of data. |
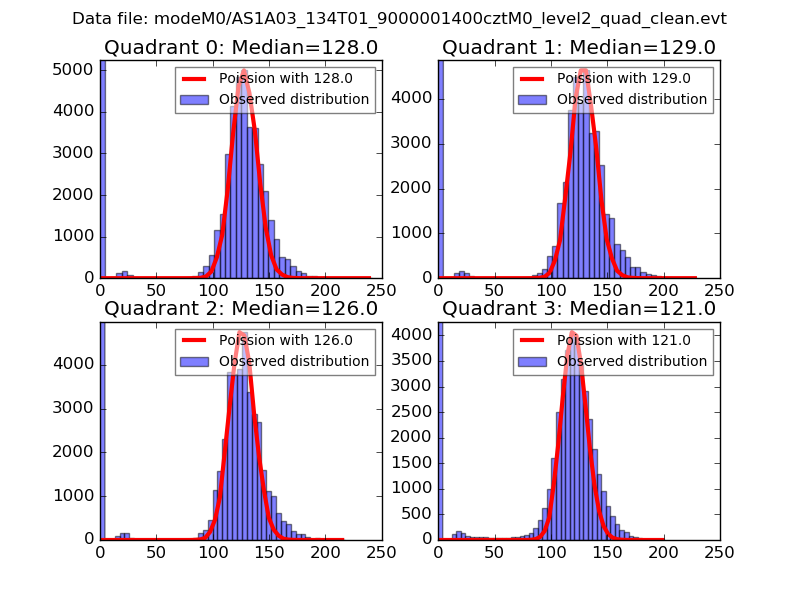 |
 |
| Quadrant-wise count rates Data is divided into 100 sec bins |
 |
|
| Module-wise count rates for Quadrant A Data is divided into 100 sec bins |
 |
 |
| Module-wise count rates for Quadrant B Data is divided into 100 sec bins |
 |
 |
| Module-wise count rates for Quadrant C Data is divided into 100 sec bins |
 |
 |
| Module-wise count rates for Quadrant D Data is divided into 100 sec bins |
 |
 |
| Parameter | Plot |
|---|---|
| CZT HV Monitor |  |
| D_VDD | 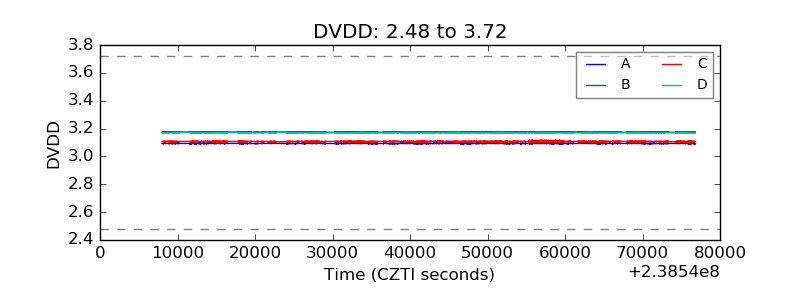 |
| Temperature 1 |  |
| Veto HV Monitor |  |
| Veto LLD |  |
| Alpha Counter |  |
| _CPM_Rate | 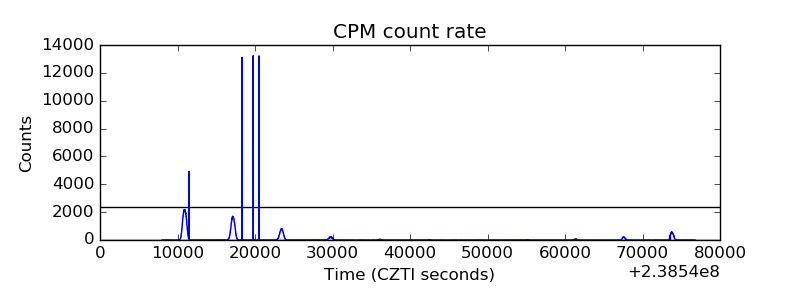 |
| CZT Counter |  |
| +2.5 Volts monitor |  |
| +5 Volts monitor |  |
| _ROLL_ROT |  |
| _Roll_DEC |  |
| _Roll_RA |  |
| Veto Counter |  |