| Param | Original file | Final file |
|---|---|---|
| Filename | modeM0/AS1A03_134T01_9000001400_09841cztM0_level2.evt | modeM0/AS1A03_134T01_9000001400_09841cztM0_level2_quad_clean.evt |
| Size (bytes) | 213,048,000 | 36,279,360 |
| Size | 203.2 MB | 34.6 MB |
| Events in quadrant A | 1,498,121 | 222,565 |
| Events in quadrant B | 1,608,641 | 228,480 |
| Events in quadrant C | 1,471,414 | 219,375 |
| Events in quadrant D | 1,663,420 | 209,639 |
| Mode M0 | |||
|---|---|---|---|
| Quadrant | BADHDUFLAG | Total packets | Discarded packets |
| A | 0 | 6970 | 608 |
| B | 0 | 7396 | 737 |
| C | 0 | 6951 | 636 |
| D | 0 | 7667 | 680 |
| Mode SS | |||
|---|---|---|---|
| Quadrant | BADHDUFLAG | Total packets | Discarded packets |
| A | 0 | 70 | 6 |
| B | 0 | 70 | 10 |
| C | 0 | 70 | 8 |
| D | 0 | 70 | 4 |
| Mode M9 | |||
|---|---|---|---|
| Quadrant | BADHDUFLAG | Total packets | Discarded packets |
| A | 0 | 13 | 0 |
| B | 0 | 13 | 1 |
| C | 0 | 13 | 0 |
| D | 0 | 13 | 1 |
| Quadrant | Total seconds | Saturated seconds | Saturation percentage |
|---|---|---|---|
| A | 3076 | 16 | 0.520156% |
| B | 3037 | 26 | 0.856108% |
| C | 3063 | 5 | 0.163239% |
| D | 3071 | 20 | 0.651254% |
Noise dominated data is calculated using 1-second bins in cleaned event files. If a bin has >2000 counts, and if more than 50% of those come from <1% of pixels, then it is considered to be noise-dominated and hence unusable.
| Quadrant | # 1 sec bins | Bins with >0 counts | Bins with >2000 counts | High rate bins dominated by noise | Noise dominated (total time) | Noise dominated (detector-on time) | Marked lightcurve |
|---|---|---|---|---|---|---|---|
| A | 4683 | 3291 | 0 | 0 | 0.00% | 0.00% | 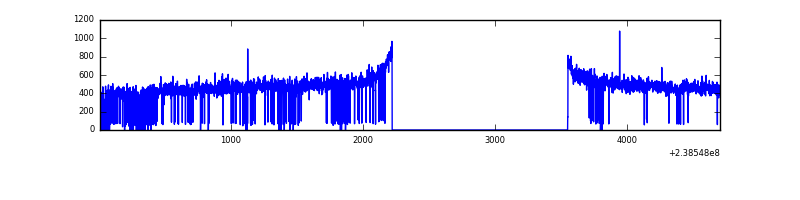 |
| B | 4683 | 3273 | 9 | 9 | 0.19% | 0.27% | 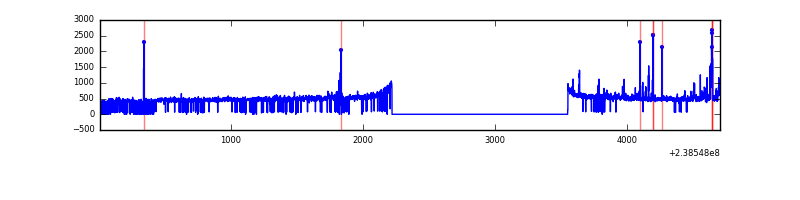 |
| C | 4694 | 3296 | 0 | 0 | 0.00% | 0.00% |  |
| D | 4694 | 3293 | 16 | 16 | 0.34% | 0.49% | 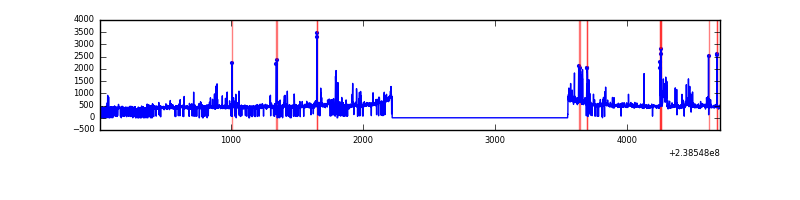 |
Top three noisy pixels from each quadrant. If the there are fewer than three noisy pixels in the level2.evt file, extra rows are filled as -1
| Pixel properties | Quadrant properties | ||||||
|---|---|---|---|---|---|---|---|
| Quadrant | DetID | PixID | Counts | Sigma | Mean | Median | Sigma |
| A | 0 | 226 | 3486 | 38.83 | 389 | 382 | 79.9 |
| A | 12 | 194 | 3034 | 33.18 | 389 | 382 | 79.9 |
| A | 3 | 137 | 1683 | 16.27 | 389 | 382 | 79.9 |
| B | 4 | 81 | 71320 | 961.34 | 388 | 379 | 73.8 |
| B | 4 | 173 | 13503 | 177.85 | 388 | 379 | 73.8 |
| B | 4 | 239 | 9207 | 119.63 | 388 | 379 | 73.8 |
| C | 13 | 61 | 2814 | 28.06 | 375 | 377 | 86.9 |
| C | 14 | 234 | 2722 | 27.0 | 375 | 377 | 86.9 |
| C | 10 | 22 | 2543 | 24.94 | 375 | 377 | 86.9 |
| D | 2 | 16 | 106621 | 1190.62 | 371 | 362 | 89.2 |
| D | 1 | 52 | 80512 | 898.07 | 371 | 362 | 89.2 |
| D | 10 | 253 | 28907 | 319.84 | 371 | 362 | 89.2 |
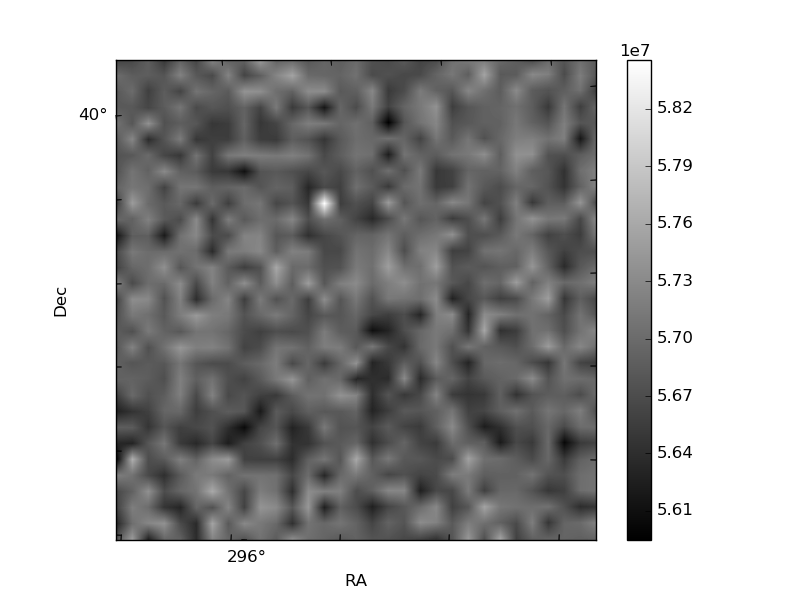
Histogram calculated using DETX and DETY for each event in the final _common_clean file
| Quadrant A |  |
 |
Quadrant B |
|---|---|---|---|
| Quadrant D | 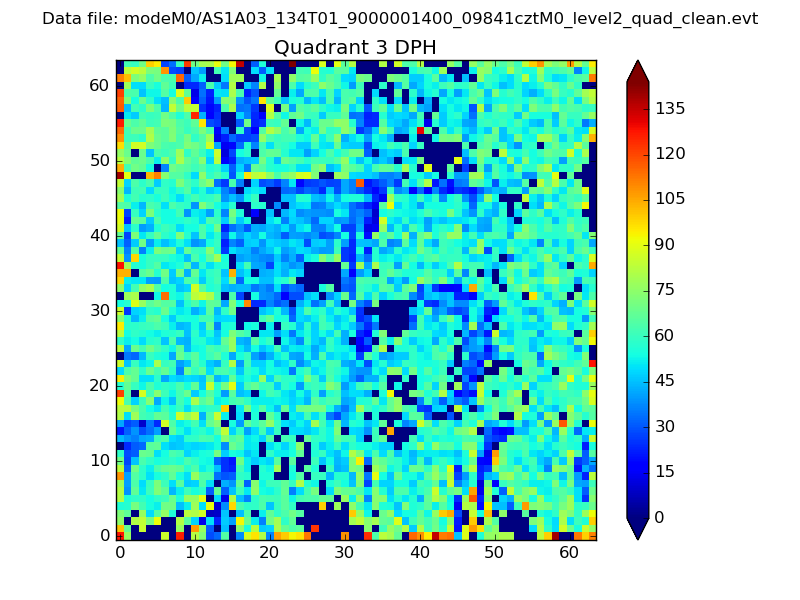 |
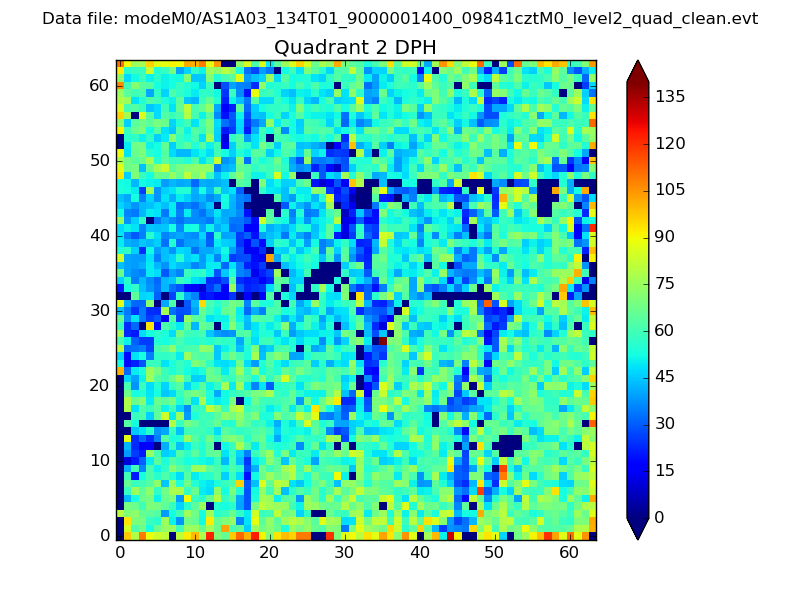 |
Quadrant C |
| Plot type | Count rate plots | Images |
|---|---|---|
| Comparison with Poisson distribution Blue bars denote a histogram of data divided into 1 sec bins. Red curve is a Poisson curve with rate = median count rate of data. |
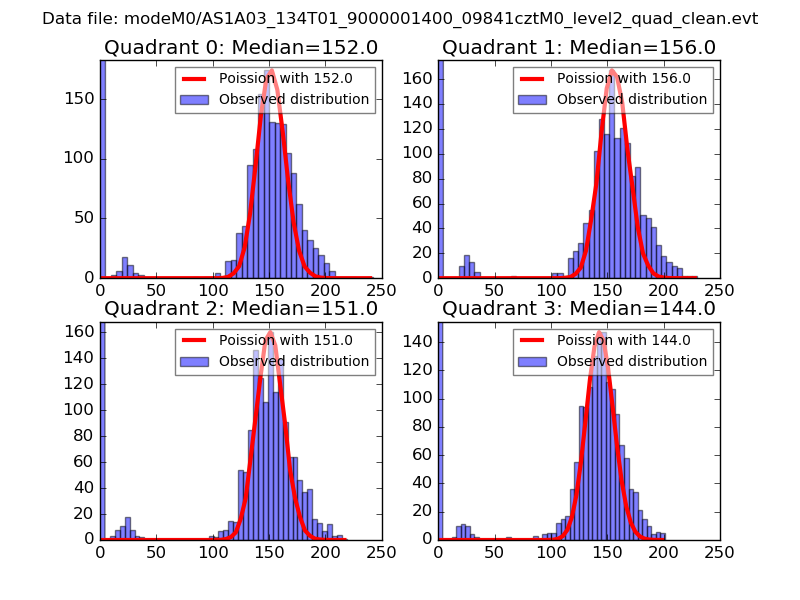 |
 |
| Quadrant-wise count rates Data is divided into 100 sec bins |
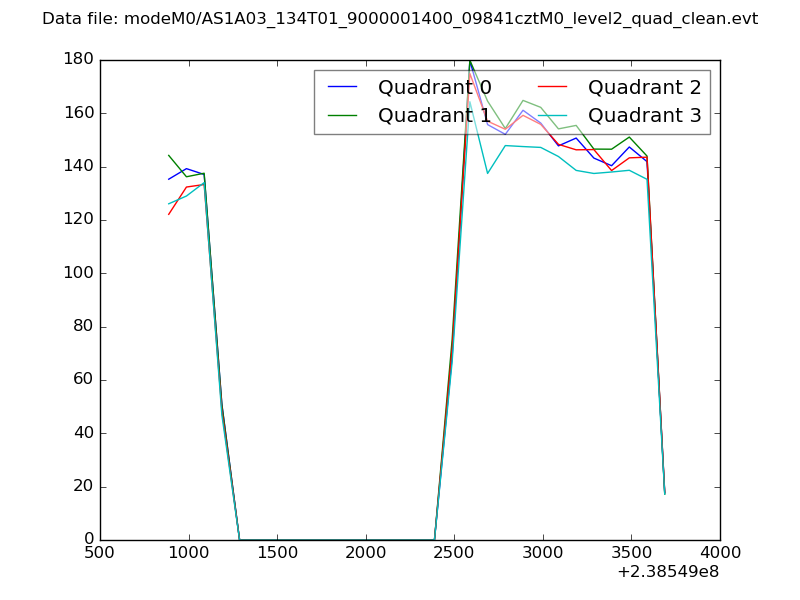 |
|
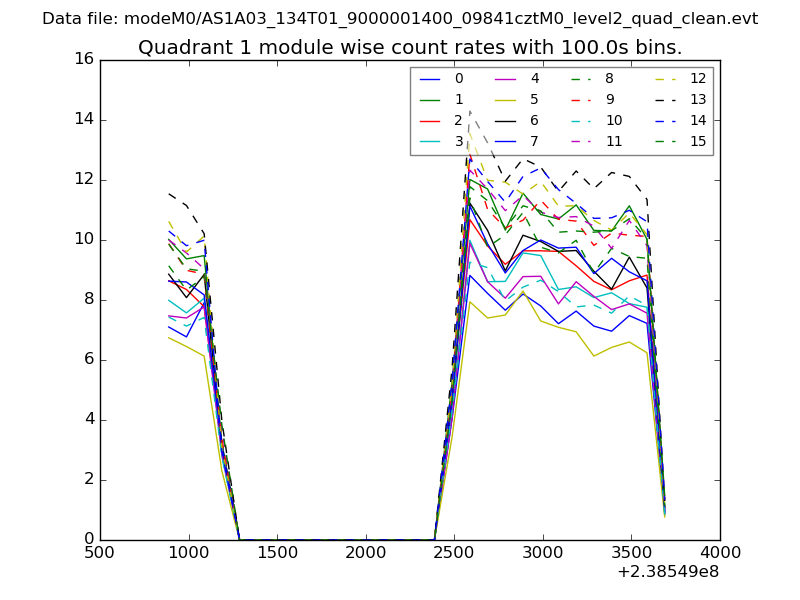
| Module-wise count rates for Quadrant A Data is divided into 100 sec bins |
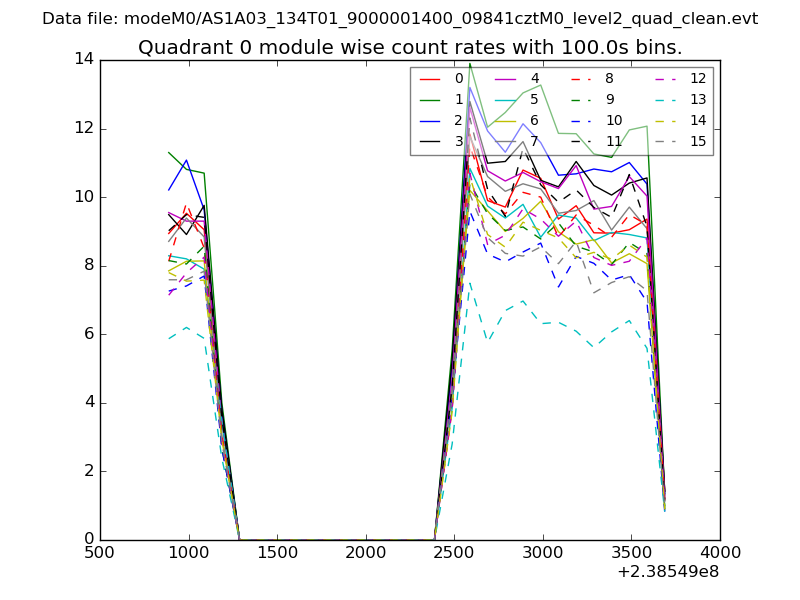 |
 |
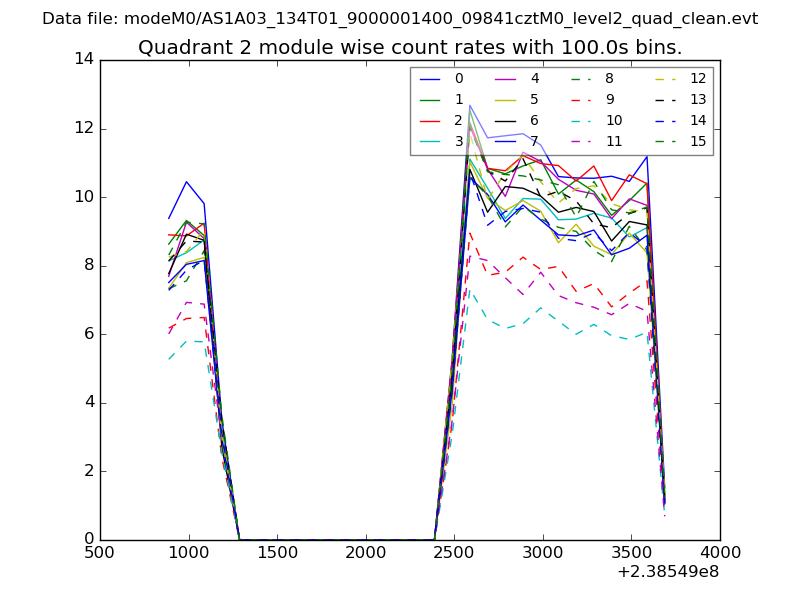
| Module-wise count rates for Quadrant B Data is divided into 100 sec bins |
 |
 |
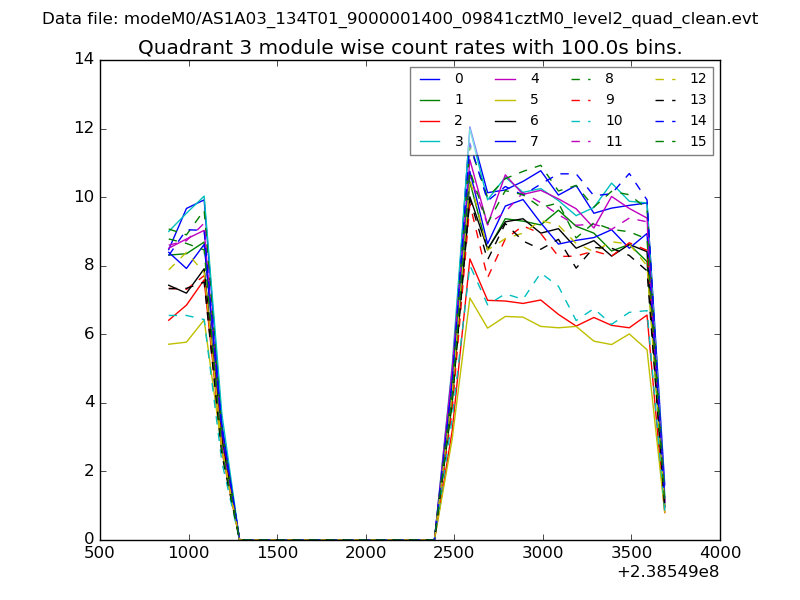
| Module-wise count rates for Quadrant C Data is divided into 100 sec bins |
 |
 |
| Module-wise count rates for Quadrant D Data is divided into 100 sec bins |
 |
 |
| Parameter | Plot |
|---|---|
| CZT HV Monitor | 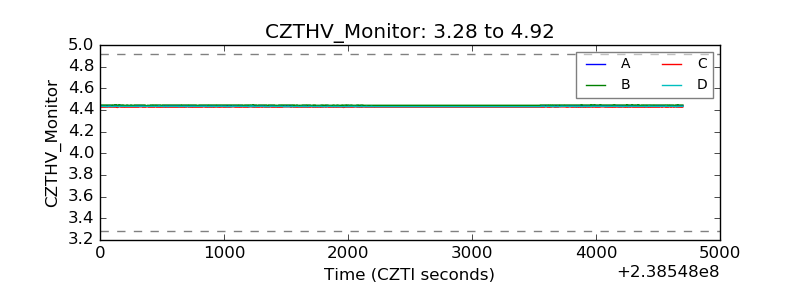 |
| D_VDD | 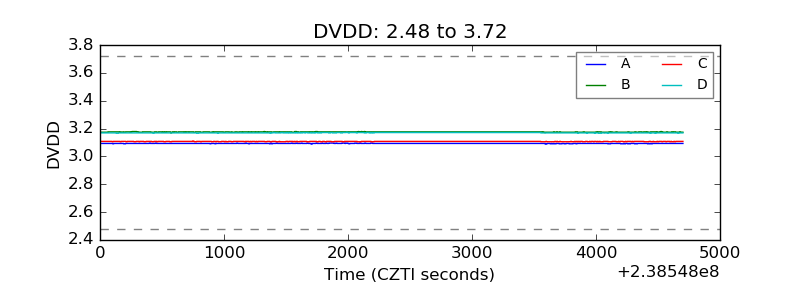 |
| Temperature 1 | 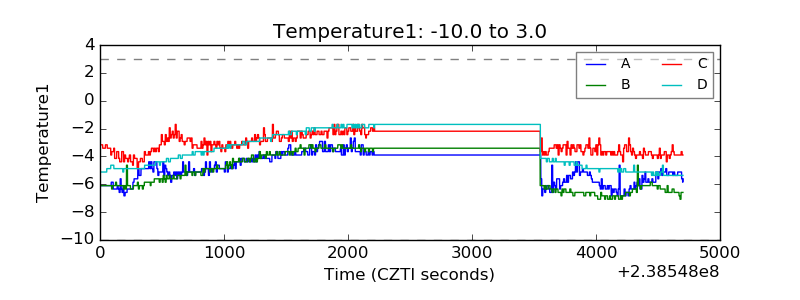 |
| Veto HV Monitor | 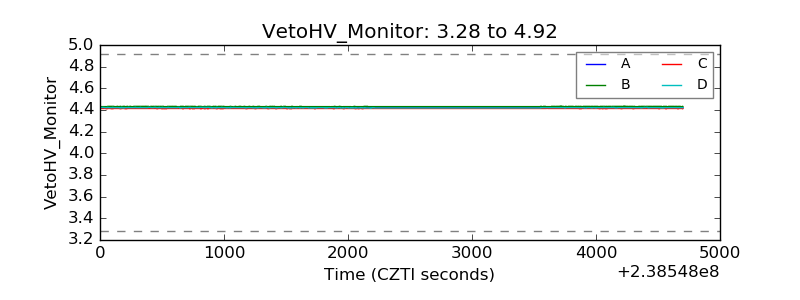 |
| Veto LLD | 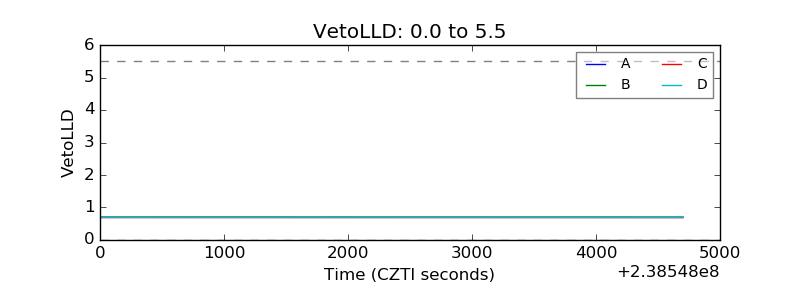 |
| Alpha Counter | 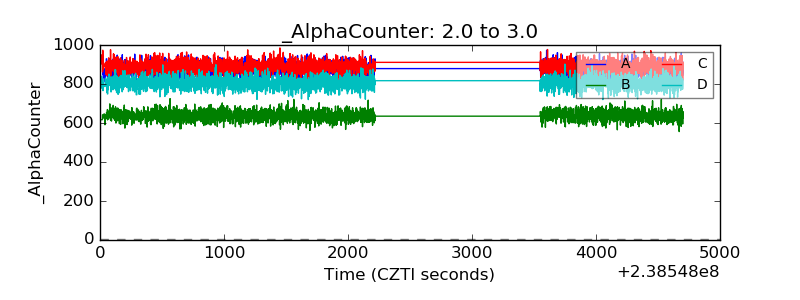 |
| _CPM_Rate | 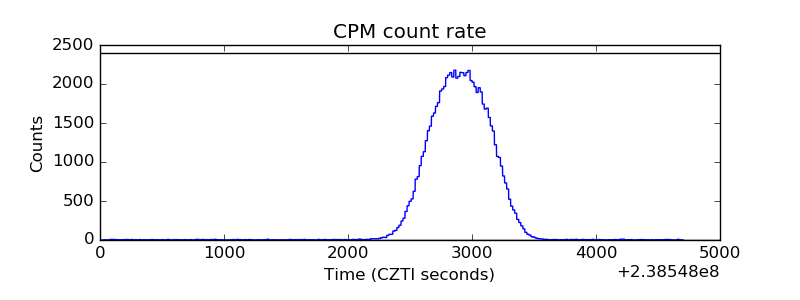 |
| CZT Counter | 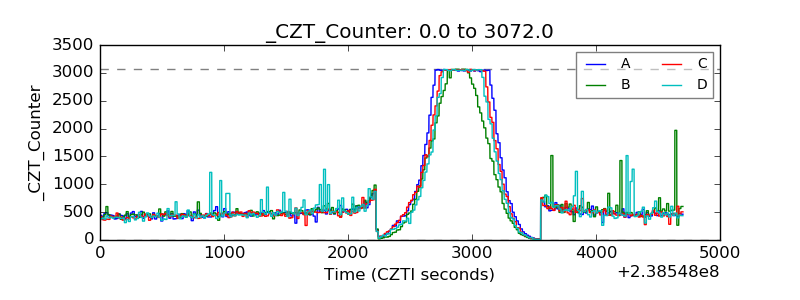 |
| +2.5 Volts monitor |  |
| +5 Volts monitor |  |
| _ROLL_ROT | 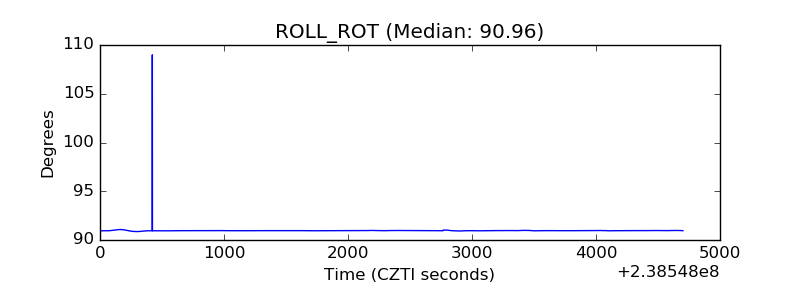 |
| _Roll_DEC | 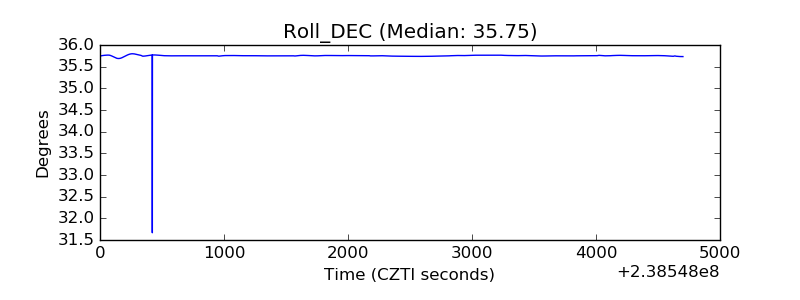 |
| _Roll_RA | 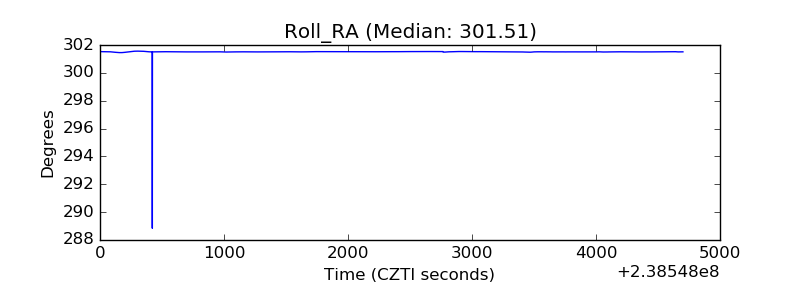 |
| Veto Counter | 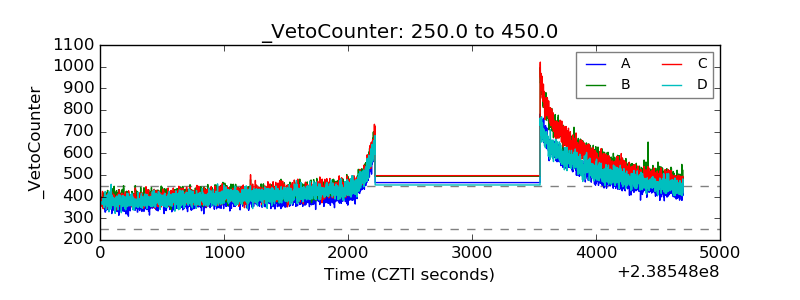 |