| Param | Original file | Final file |
|---|---|---|
| Filename | modeM0/AS1A03_134T01_9000001400_09842cztM0_level2.evt | modeM0/AS1A03_134T01_9000001400_09842cztM0_level2_quad_clean.evt |
| Size (bytes) | 586,172,160 | 97,948,800 |
| Size | 559.0 MB | 93.4 MB |
| Events in quadrant A | 3,863,929 | 608,635 |
| Events in quadrant B | 4,098,064 | 626,891 |
| Events in quadrant C | 3,805,153 | 606,979 |
| Events in quadrant D | 5,432,210 | 557,138 |
| Mode M0 | |||
|---|---|---|---|
| Quadrant | BADHDUFLAG | Total packets | Discarded packets |
| A | 0 | 17471 | 723 |
| B | 0 | 18120 | 786 |
| C | 0 | 17457 | 686 |
| D | 0 | 22735 | 1103 |
| Mode SS | |||
|---|---|---|---|
| Quadrant | BADHDUFLAG | Total packets | Discarded packets |
| A | 0 | 174 | 4 |
| B | 0 | 174 | 4 |
| C | 0 | 174 | 8 |
| D | 0 | 174 | 4 |
| Mode M9 | |||
|---|---|---|---|
| Quadrant | BADHDUFLAG | Total packets | Discarded packets |
| A | 0 | 26 | 3 |
| B | 0 | 26 | 2 |
| C | 0 | 26 | 2 |
| D | 0 | 26 | 1 |
| Quadrant | Total seconds | Saturated seconds | Saturation percentage |
|---|---|---|---|
| A | 8140 | 39 | 0.479115% |
| B | 8149 | 87 | 1.067616% |
| C | 8163 | 25 | 0.306260% |
| D | 8113 | 316 | 3.894983% |
Noise dominated data is calculated using 1-second bins in cleaned event files. If a bin has >2000 counts, and if more than 50% of those come from <1% of pixels, then it is considered to be noise-dominated and hence unusable.
| Quadrant | # 1 sec bins | Bins with >0 counts | Bins with >2000 counts | High rate bins dominated by noise | Noise dominated (total time) | Noise dominated (detector-on time) | Marked lightcurve |
|---|---|---|---|---|---|---|---|
| A | 11134 | 8294 | 0 | 0 | 0.00% | 0.00% | 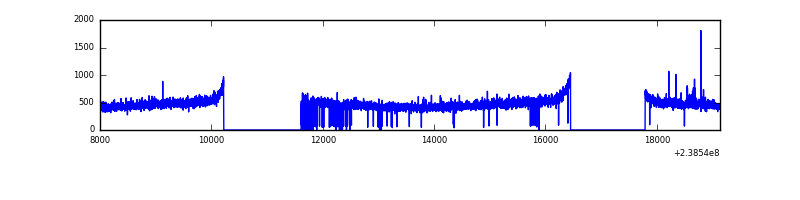 |
| B | 11134 | 8289 | 16 | 16 | 0.14% | 0.19% | 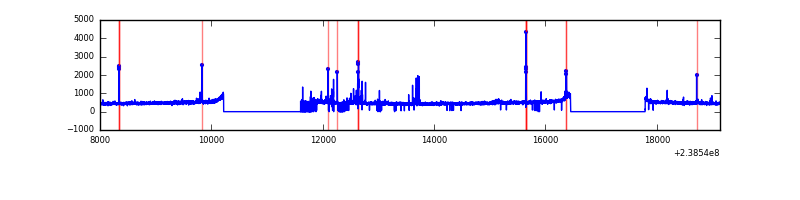 |
| C | 11134 | 8302 | 1 | 1 | 0.01% | 0.01% | 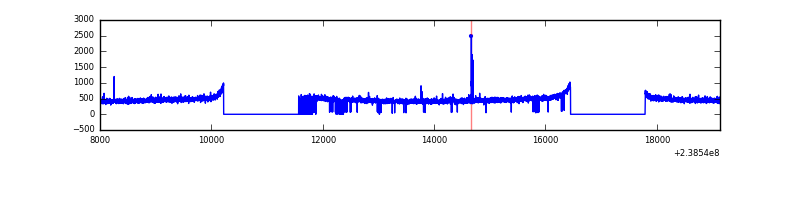 |
| D | 11134 | 8255 | 226 | 226 | 2.03% | 2.74% | 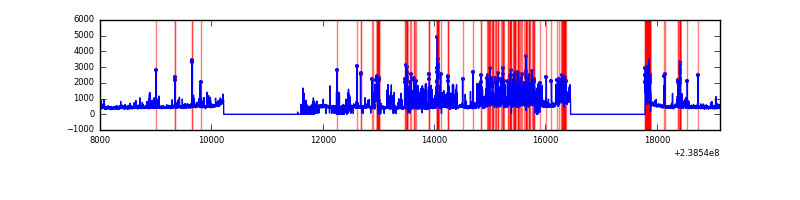 |
Top three noisy pixels from each quadrant. If the there are fewer than three noisy pixels in the level2.evt file, extra rows are filled as -1
| Pixel properties | Quadrant properties | ||||||
|---|---|---|---|---|---|---|---|
| Quadrant | DetID | PixID | Counts | Sigma | Mean | Median | Sigma |
| A | 13 | 248 | 15080 | 70.72 | 1000 | 983 | 199.3 |
| A | 0 | 226 | 9216 | 41.3 | 1000 | 983 | 199.3 |
| A | 12 | 194 | 7823 | 34.31 | 1000 | 983 | 199.3 |
| B | 4 | 81 | 111189 | 588.71 | 1007 | 983 | 187.2 |
| B | 0 | 214 | 29829 | 154.09 | 1007 | 983 | 187.2 |
| B | 4 | 173 | 23813 | 121.96 | 1007 | 983 | 187.2 |
| C | 10 | 22 | 19042 | 81.47 | 967 | 975 | 221.8 |
| C | 8 | 208 | 8494 | 33.91 | 967 | 975 | 221.8 |
| C | 13 | 61 | 7326 | 28.64 | 967 | 975 | 221.8 |
| D | 2 | 16 | 989352 | 4406.71 | 933 | 912 | 224.3 |
| D | 1 | 52 | 514320 | 2288.9 | 933 | 912 | 224.3 |
| D | 13 | 104 | 153893 | 682.03 | 933 | 912 | 224.3 |
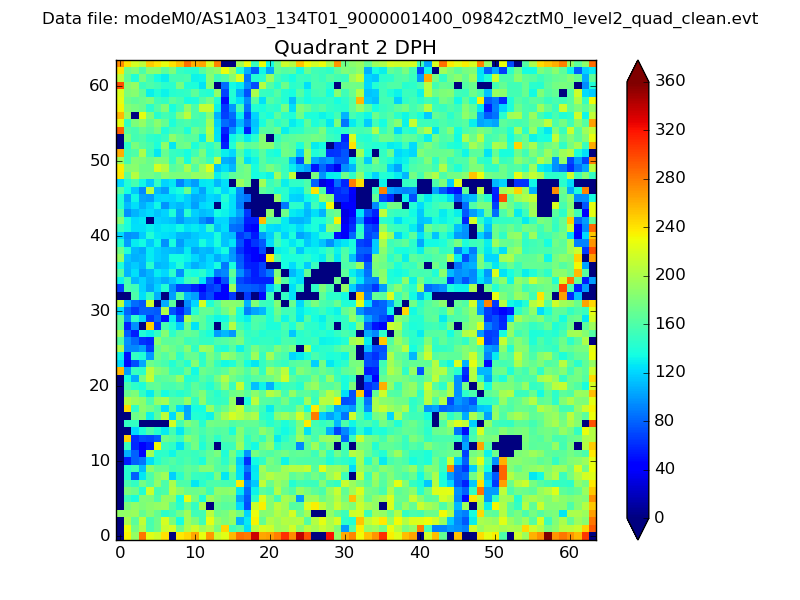
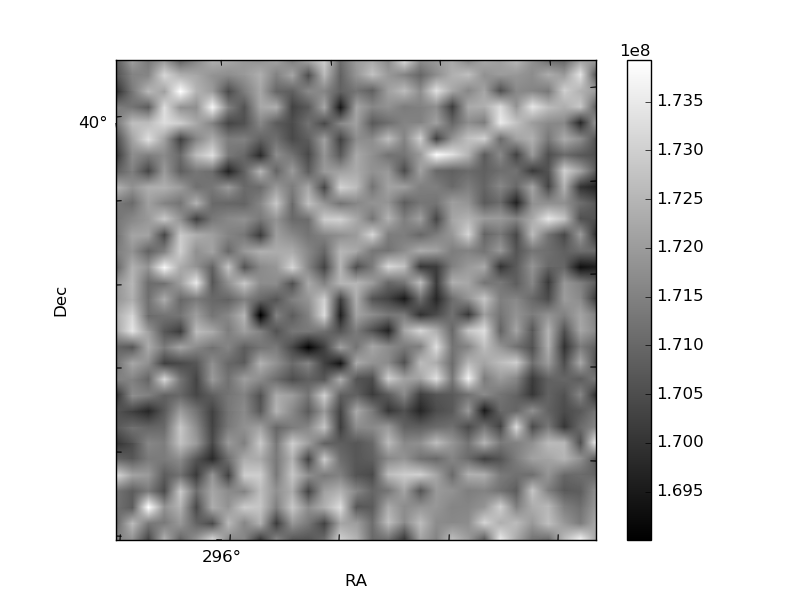
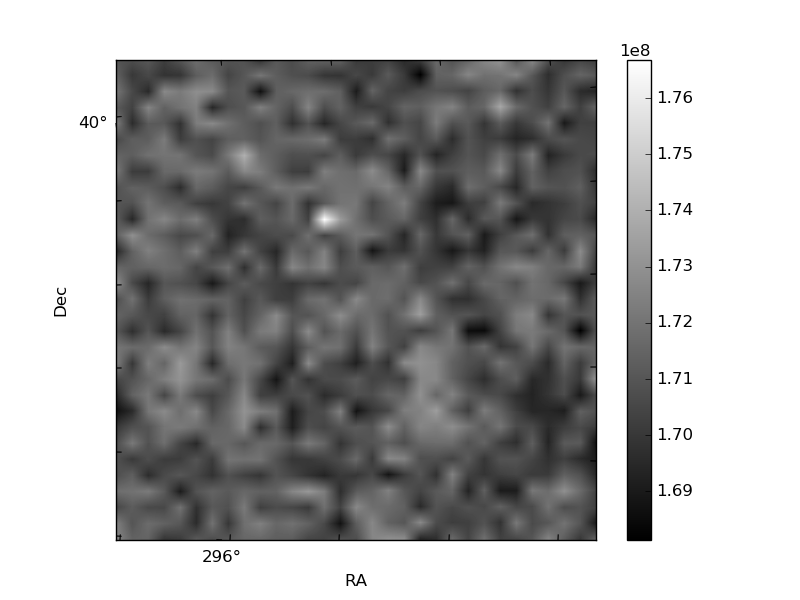
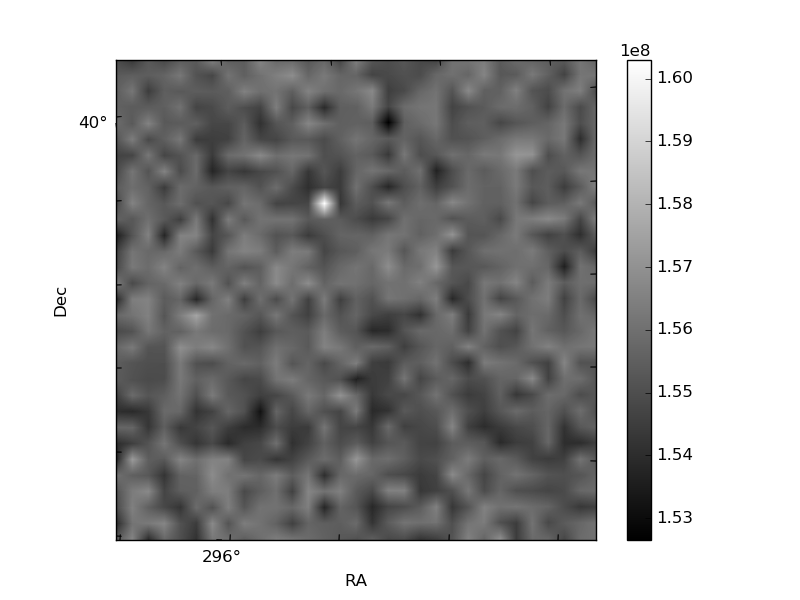
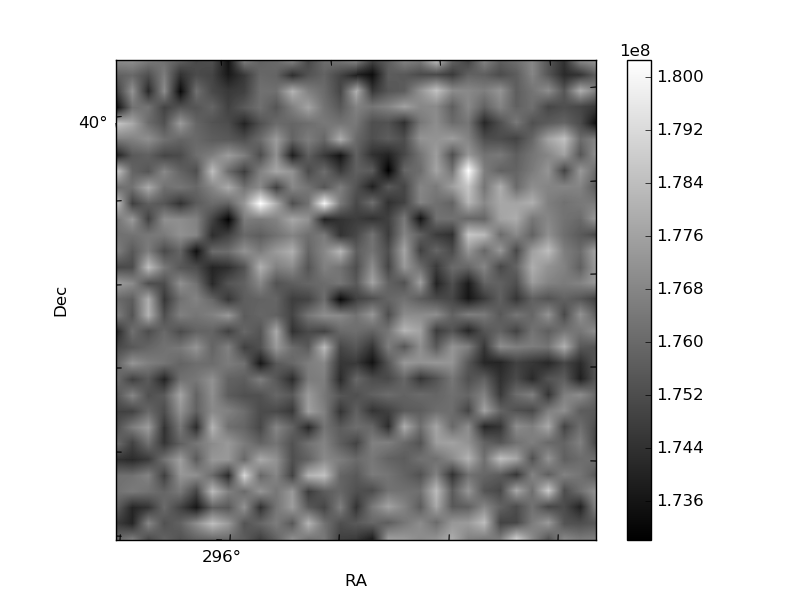
Histogram calculated using DETX and DETY for each event in the final _common_clean file
| Quadrant A |  |
 |
Quadrant B |
|---|---|---|---|
| Quadrant D | 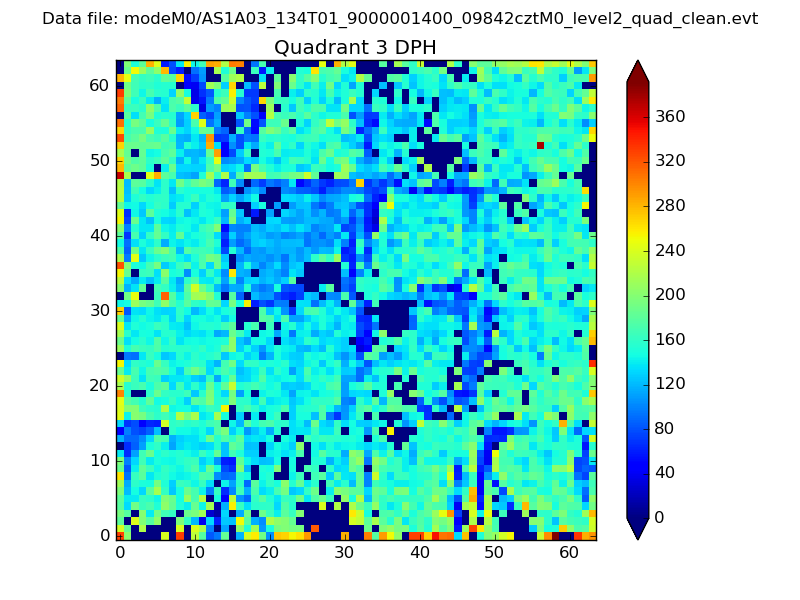 |
 |
Quadrant C |
| Plot type | Count rate plots | Images |
|---|---|---|
| Comparison with Poisson distribution Blue bars denote a histogram of data divided into 1 sec bins. Red curve is a Poisson curve with rate = median count rate of data. |
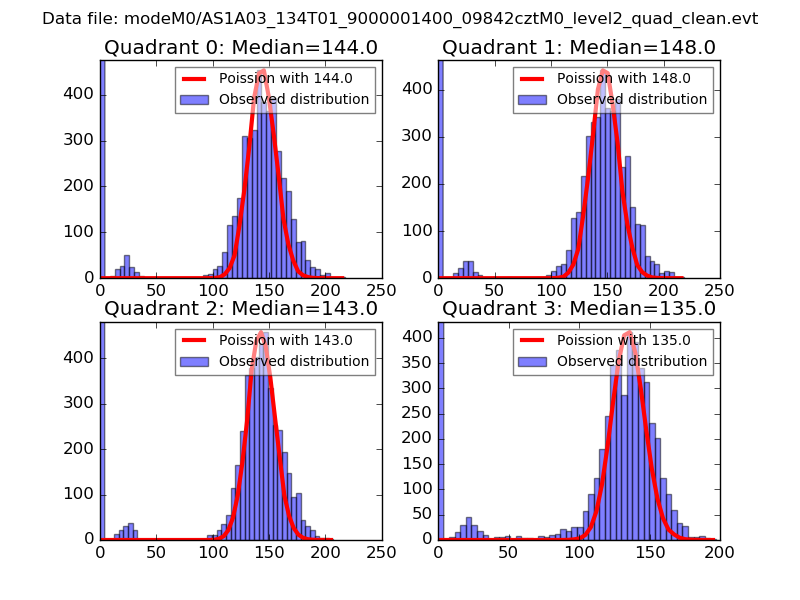 |
 |
| Quadrant-wise count rates Data is divided into 100 sec bins |
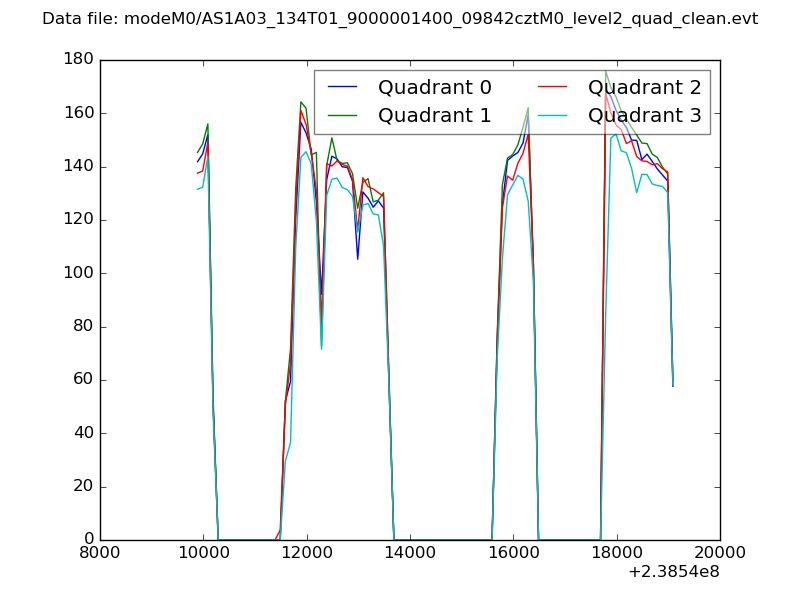 |
|
| Module-wise count rates for Quadrant A Data is divided into 100 sec bins |
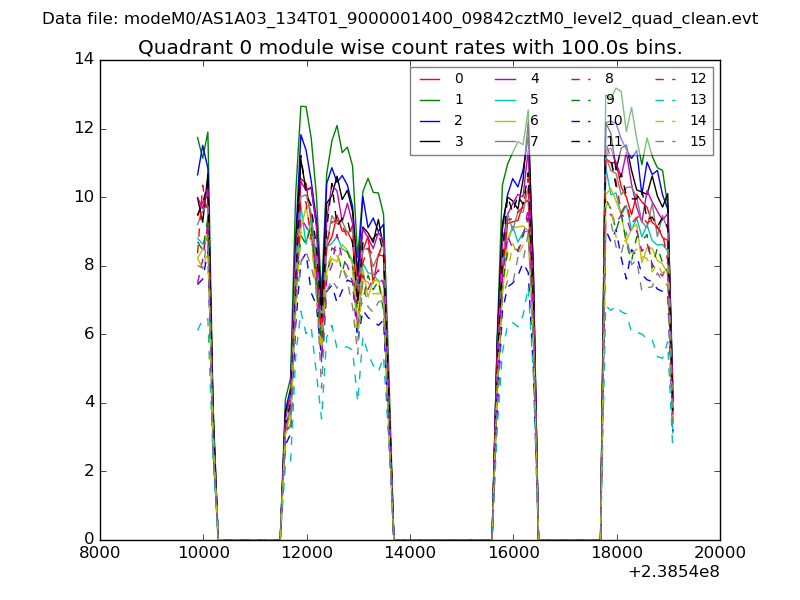 |
 |
| Module-wise count rates for Quadrant B Data is divided into 100 sec bins |
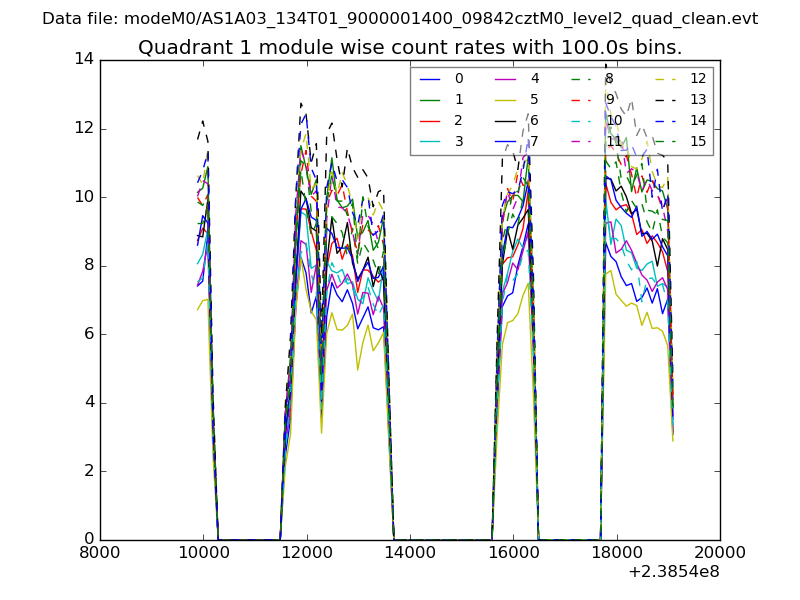 |
 |
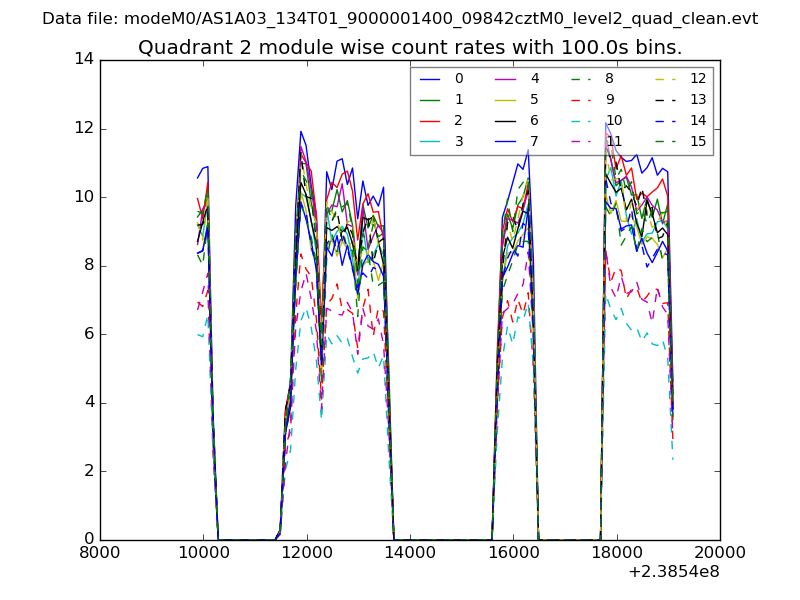
| Module-wise count rates for Quadrant C Data is divided into 100 sec bins |
 |
 |
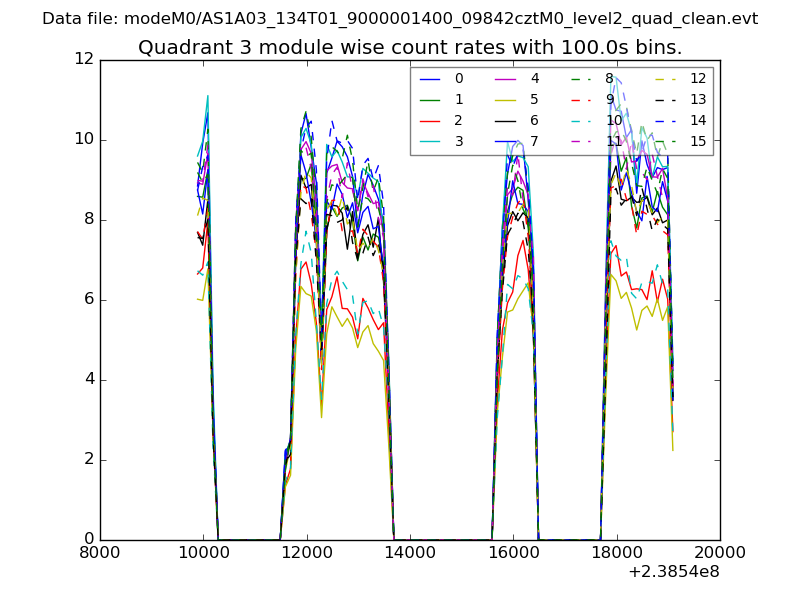
| Module-wise count rates for Quadrant D Data is divided into 100 sec bins |
 |
 |
| Parameter | Plot |
|---|---|
| CZT HV Monitor | 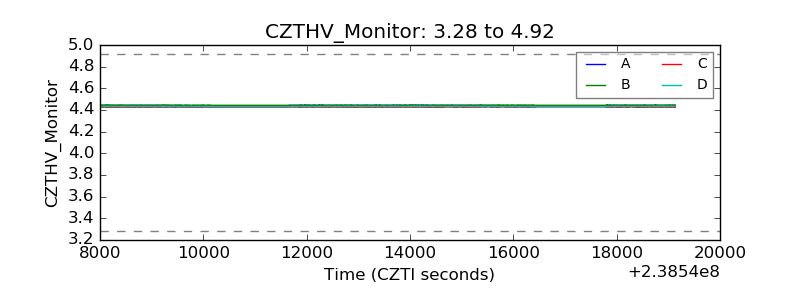 |
| D_VDD | 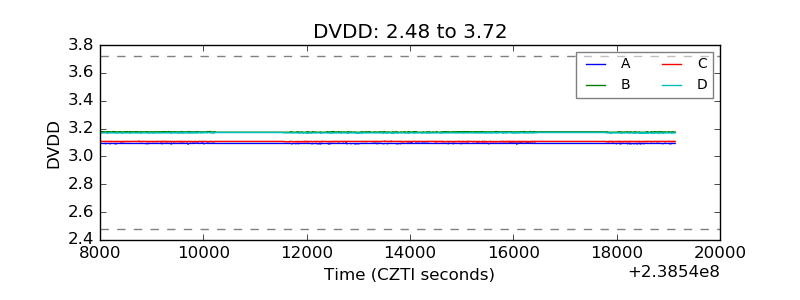 |
| Temperature 1 | 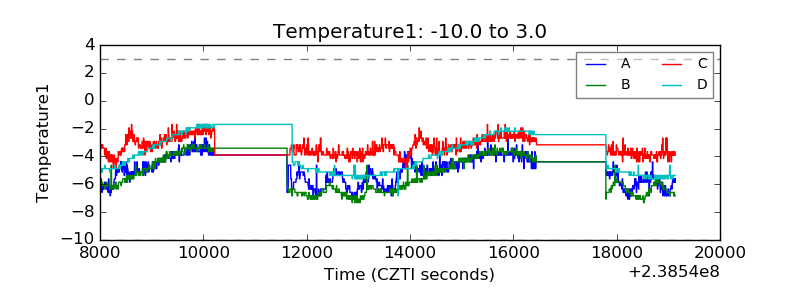 |
| Veto HV Monitor | 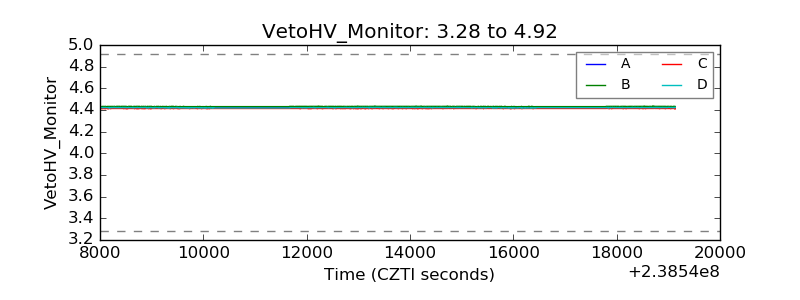 |
| Veto LLD | 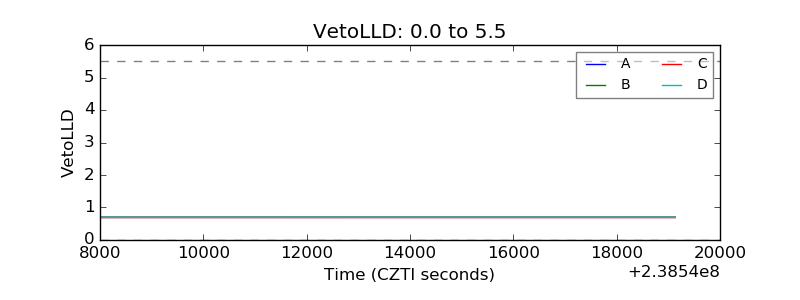 |
| Alpha Counter | 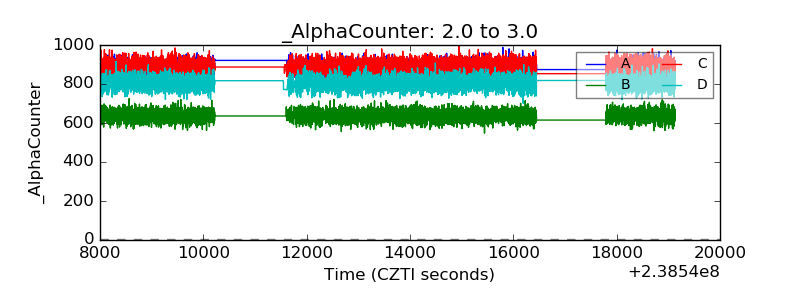 |
| _CPM_Rate | 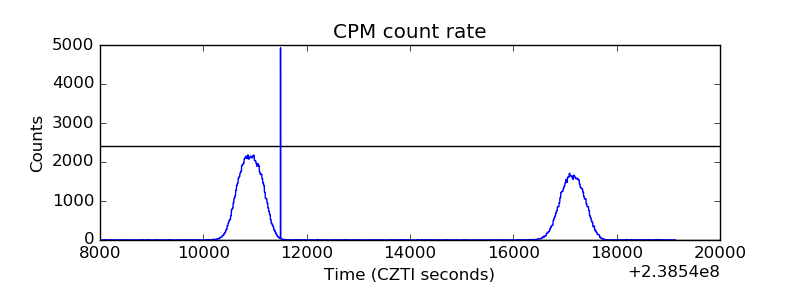 |
| CZT Counter | 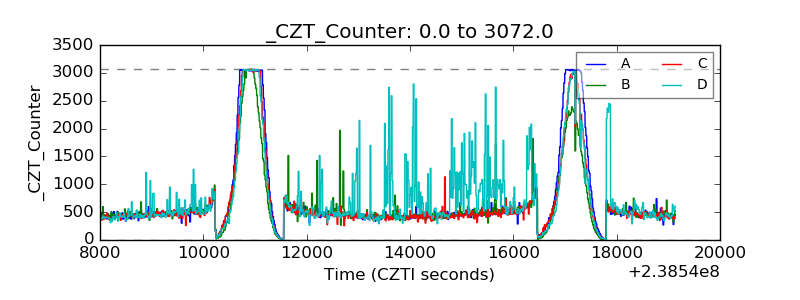 |
| +2.5 Volts monitor |  |
| +5 Volts monitor |  |
| _ROLL_ROT | 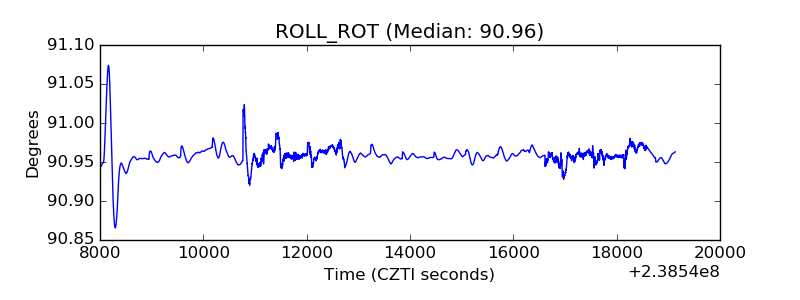 |
| _Roll_DEC | 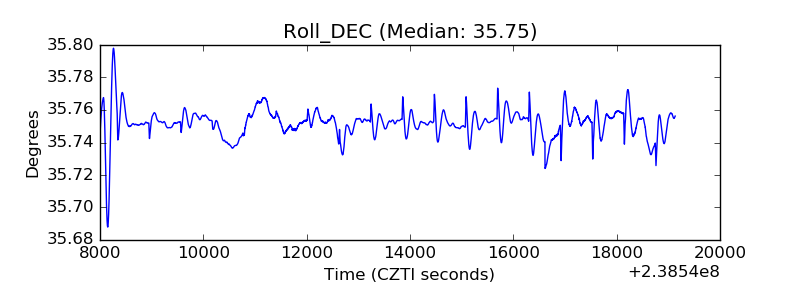 |
| _Roll_RA | 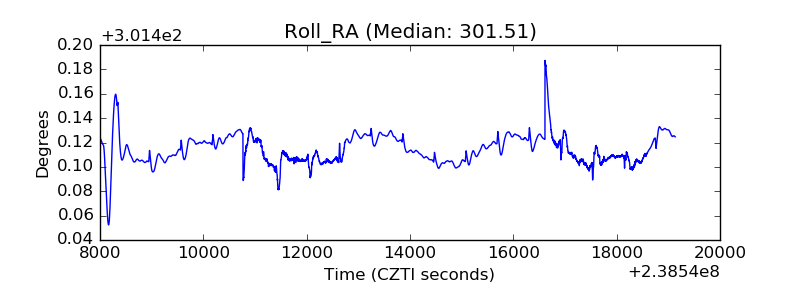 |
| Veto Counter | 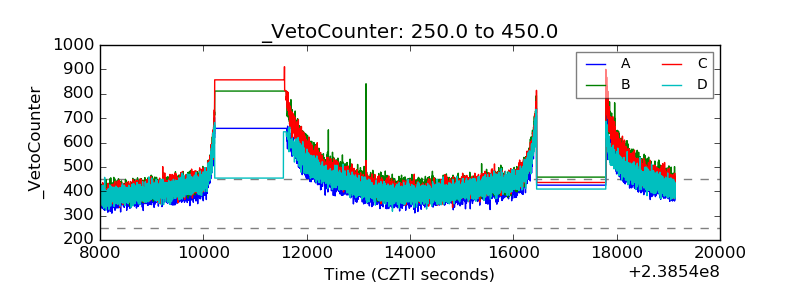 |