| Param | Original file | Final file |
|---|---|---|
| Filename | modeM0/AS1A03_134T01_9000001400_09843cztM0_level2.evt | modeM0/AS1A03_134T01_9000001400_09843cztM0_level2_quad_clean.evt |
| Size (bytes) | 219,911,040 | 56,416,320 |
| Size | 209.7 MB | 53.8 MB |
| Events in quadrant A | 1,619,972 | 380,145 |
| Events in quadrant B | 1,587,210 | 375,716 |
| Events in quadrant C | 1,573,722 | 374,799 |
| Events in quadrant D | 1,652,838 | 344,092 |
| Mode M0 | |||
|---|---|---|---|
| Quadrant | BADHDUFLAG | Total packets | Discarded packets |
| A | 0 | 12878 | 5888 |
| B | 0 | 13021 | 6276 |
| C | 0 | 12813 | 5882 |
| D | 0 | 14484 | 7394 |
| Mode SS | |||
|---|---|---|---|
| Quadrant | BADHDUFLAG | Total packets | Discarded packets |
| A | 0 | 126 | 52 |
| B | 0 | 126 | 74 |
| C | 0 | 126 | 52 |
| D | 0 | 126 | 58 |
| Mode M9 | |||
|---|---|---|---|
| Quadrant | BADHDUFLAG | Total packets | Discarded packets |
| A | 0 | 18 | 5 |
| B | 0 | 18 | 4 |
| C | 0 | 18 | 5 |
| D | 0 | 19 | 4 |
| Quadrant | Total seconds | Saturated seconds | Saturation percentage |
|---|---|---|---|
| A | 3352 | 25 | 0.745823% |
| B | 3218 | 34 | 1.056557% |
| C | 3328 | 8 | 0.240385% |
| D | 3207 | 29 | 0.904272% |
Noise dominated data is calculated using 1-second bins in cleaned event files. If a bin has >2000 counts, and if more than 50% of those come from <1% of pixels, then it is considered to be noise-dominated and hence unusable.
| Quadrant | # 1 sec bins | Bins with >0 counts | Bins with >2000 counts | High rate bins dominated by noise | Noise dominated (total time) | Noise dominated (detector-on time) | Marked lightcurve |
|---|---|---|---|---|---|---|---|
| A | 7556 | 4155 | 0 | 0 | 0.00% | 0.00% |  |
| B | 7551 | 4018 | 0 | 0 | 0.00% | 0.00% |  |
| C | 7559 | 4129 | 0 | 0 | 0.00% | 0.00% | 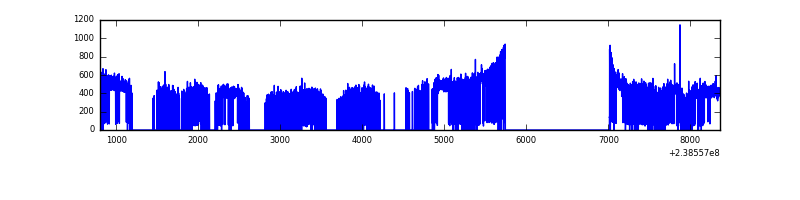 |
| D | 7529 | 3975 | 8 | 8 | 0.11% | 0.20% | 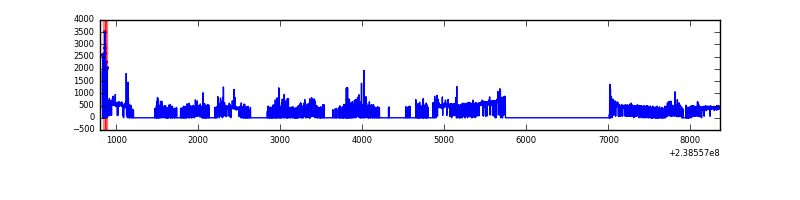 |
Top three noisy pixels from each quadrant. If the there are fewer than three noisy pixels in the level2.evt file, extra rows are filled as -1
| Pixel properties | Quadrant properties | ||||||
|---|---|---|---|---|---|---|---|
| Quadrant | DetID | PixID | Counts | Sigma | Mean | Median | Sigma |
| A | 13 | 248 | 8134 | 89.13 | 418 | 409 | 86.7 |
| A | 0 | 226 | 3817 | 39.32 | 418 | 409 | 86.7 |
| A | 12 | 194 | 3226 | 32.5 | 418 | 409 | 86.7 |
| B | 12 | 111 | 8580 | 106.23 | 405 | 395 | 77.1 |
| B | 4 | 173 | 7968 | 98.29 | 405 | 395 | 77.1 |
| B | 11 | 111 | 7039 | 86.23 | 405 | 395 | 77.1 |
| C | 13 | 61 | 3006 | 27.74 | 402 | 405 | 93.8 |
| C | 14 | 67 | 1744 | 14.28 | 402 | 405 | 93.8 |
| C | 14 | 234 | 1675 | 13.54 | 402 | 405 | 93.8 |
| D | 2 | 16 | 87253 | 911.57 | 378 | 368 | 95.3 |
| D | 1 | 52 | 58235 | 607.12 | 378 | 368 | 95.3 |
| D | 13 | 104 | 46270 | 481.59 | 378 | 368 | 95.3 |
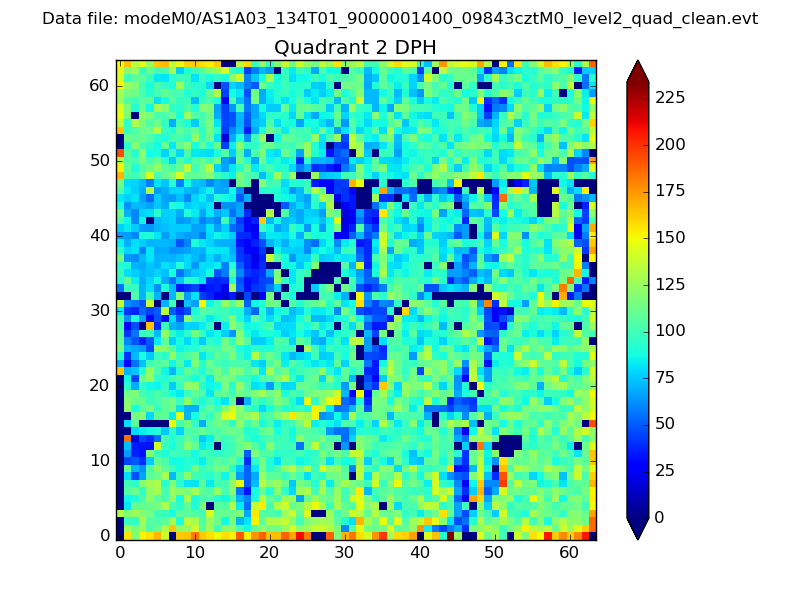
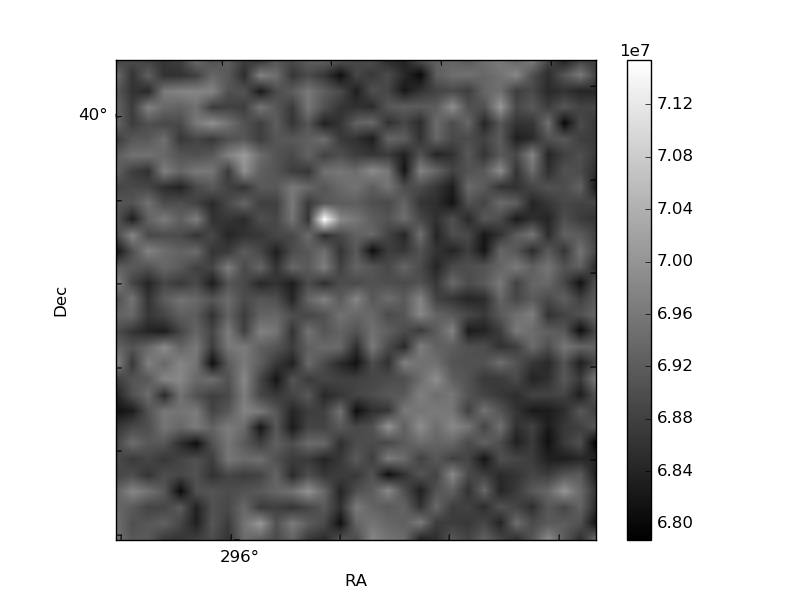
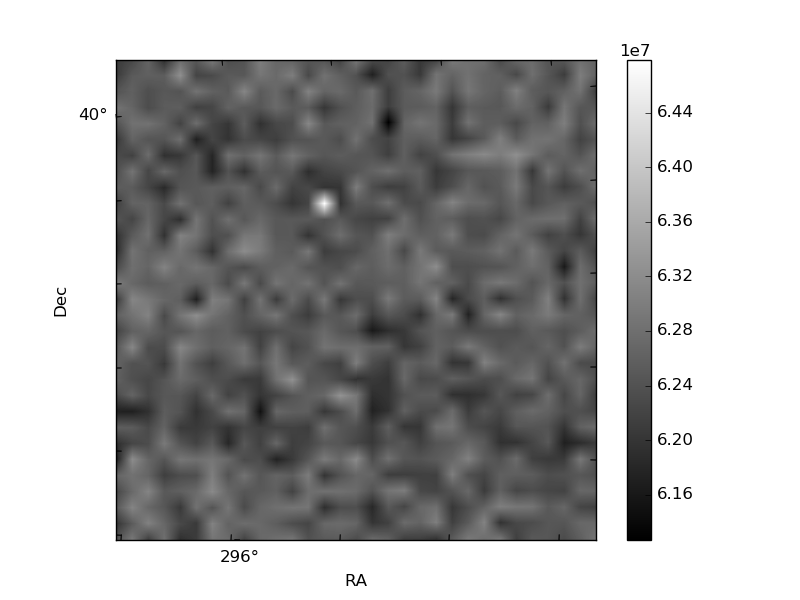
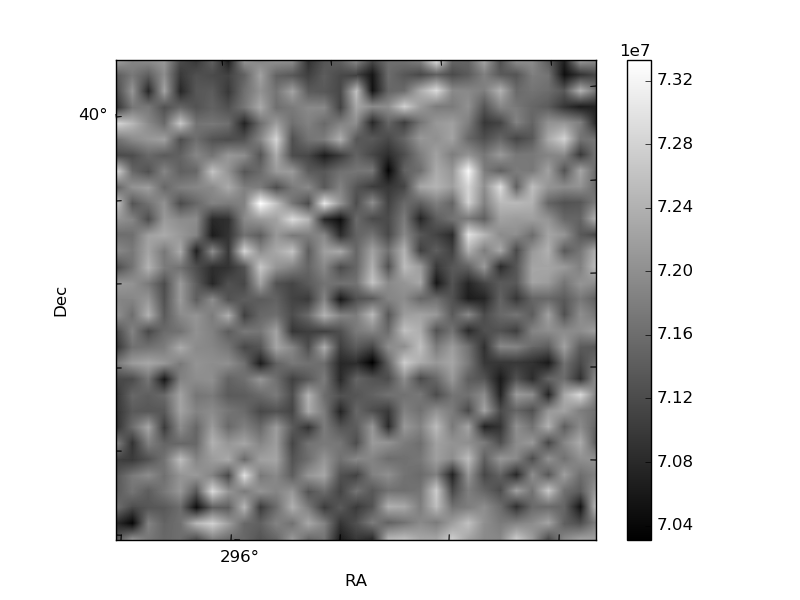
Histogram calculated using DETX and DETY for each event in the final _common_clean file
| Quadrant A | 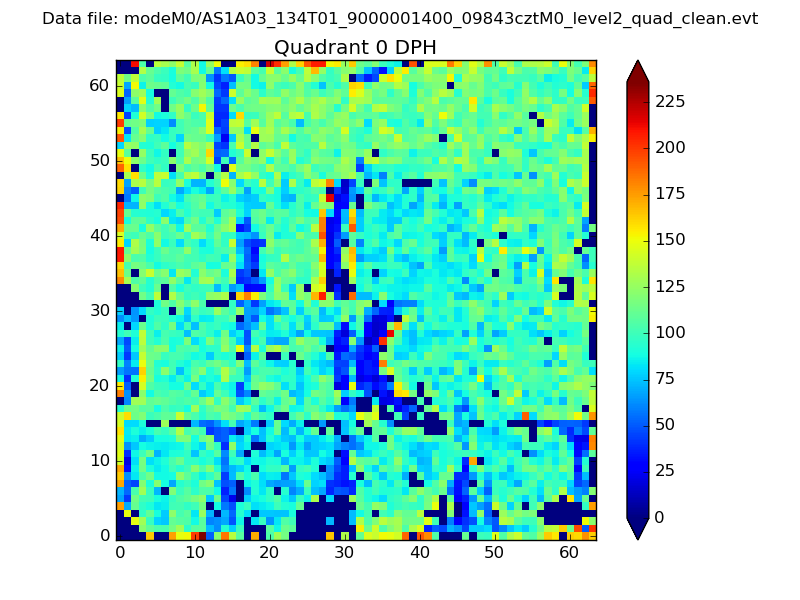 |
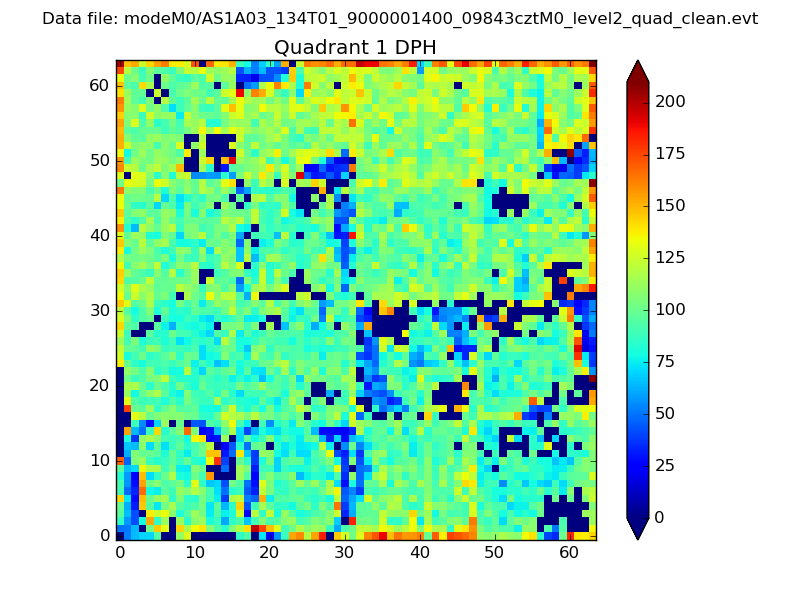 |
Quadrant B |
|---|---|---|---|
| Quadrant D | 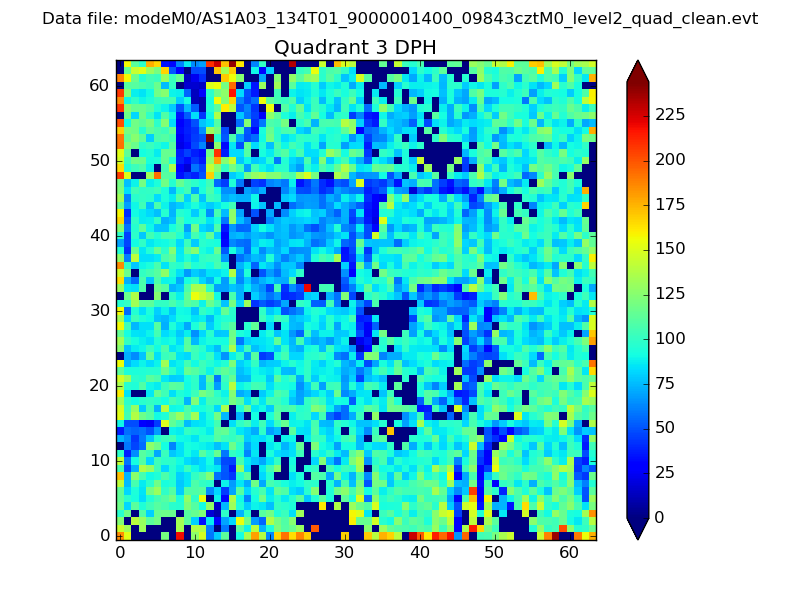 |
 |
Quadrant C |
| Plot type | Count rate plots | Images |
|---|---|---|
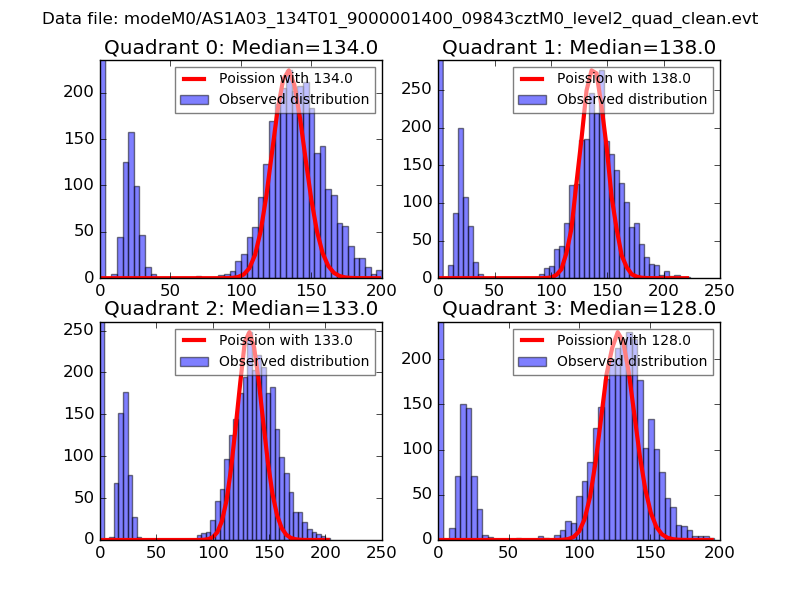
| Comparison with Poisson distribution Blue bars denote a histogram of data divided into 1 sec bins. Red curve is a Poisson curve with rate = median count rate of data. |
 |
 |
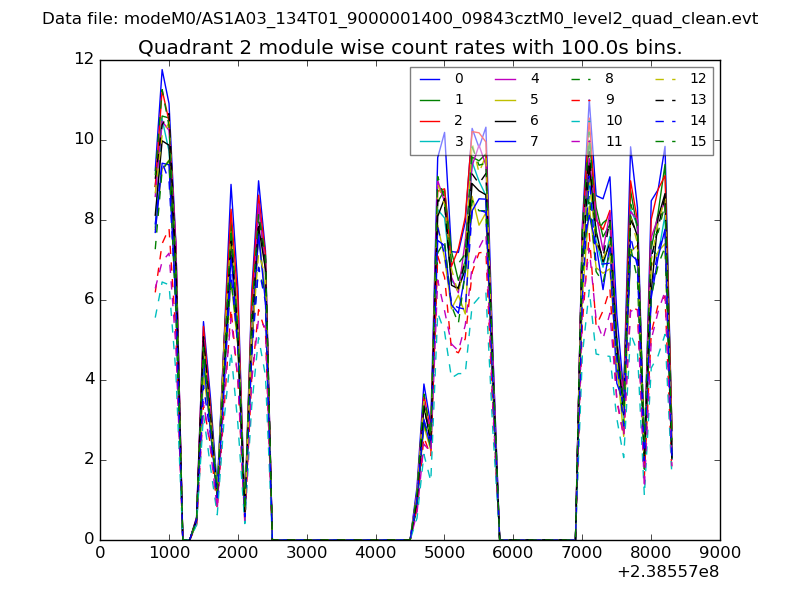
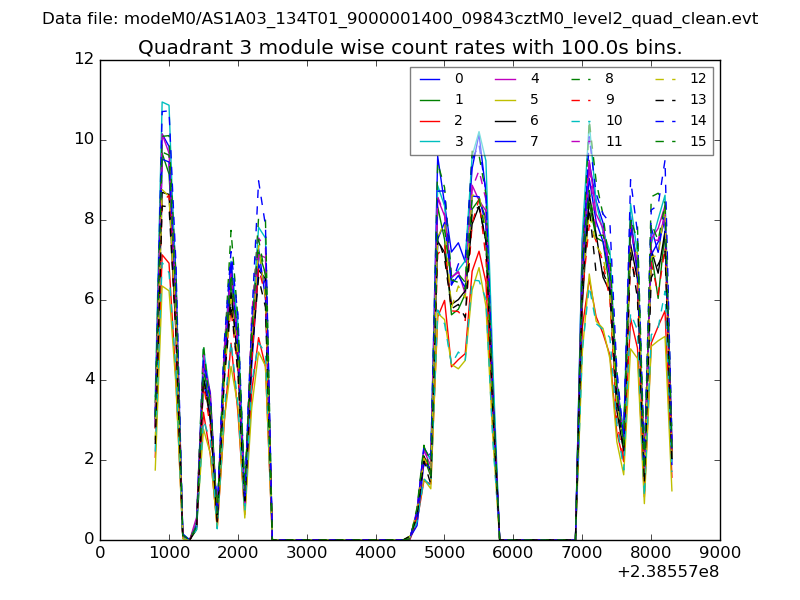
| Quadrant-wise count rates Data is divided into 100 sec bins |
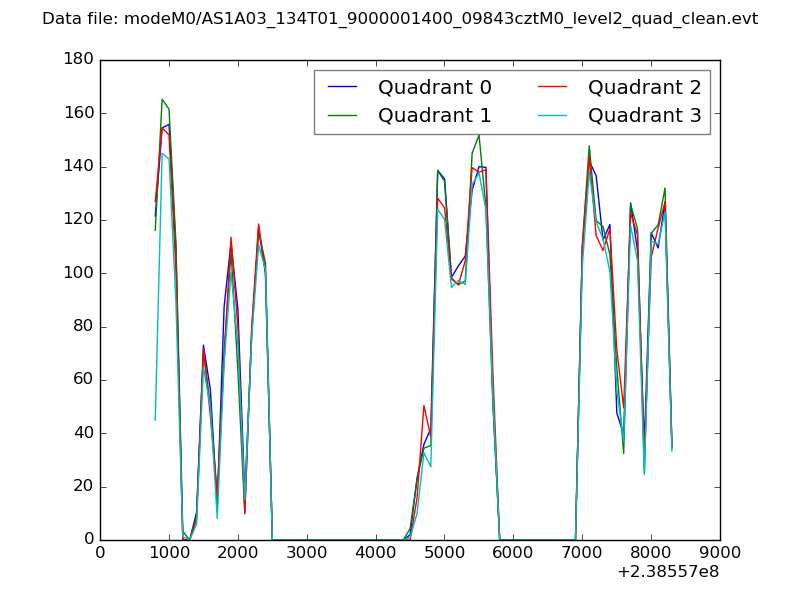 |
|
| Module-wise count rates for Quadrant A Data is divided into 100 sec bins |
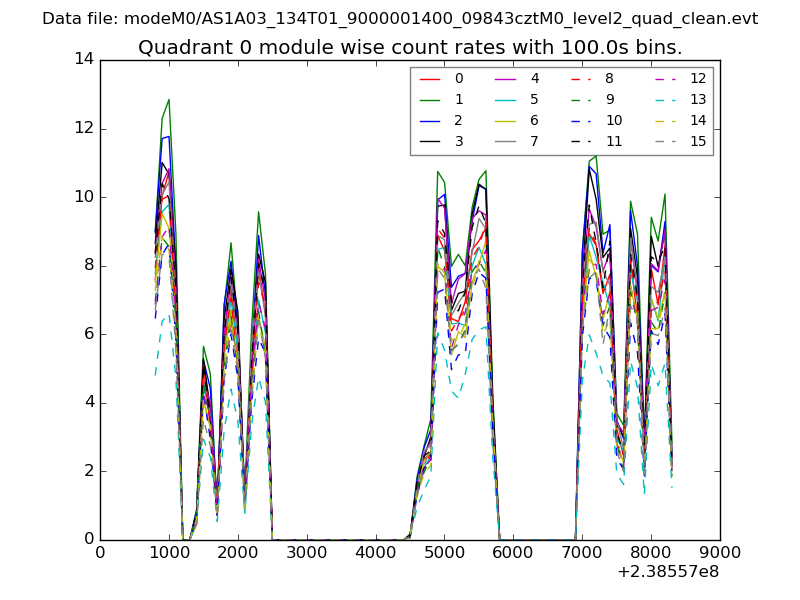 |
 |
| Module-wise count rates for Quadrant B Data is divided into 100 sec bins |
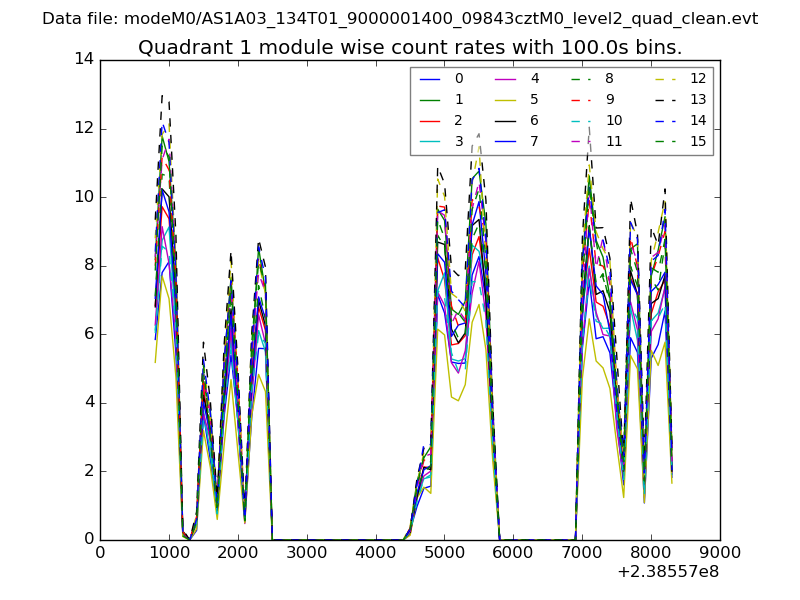 |
 |
| Module-wise count rates for Quadrant C Data is divided into 100 sec bins |
 |
 |
| Module-wise count rates for Quadrant D Data is divided into 100 sec bins |
 |
 |
| Parameter | Plot |
|---|---|
| CZT HV Monitor | 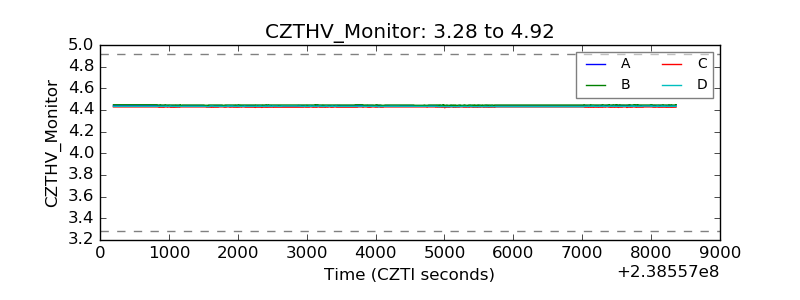 |
| D_VDD | 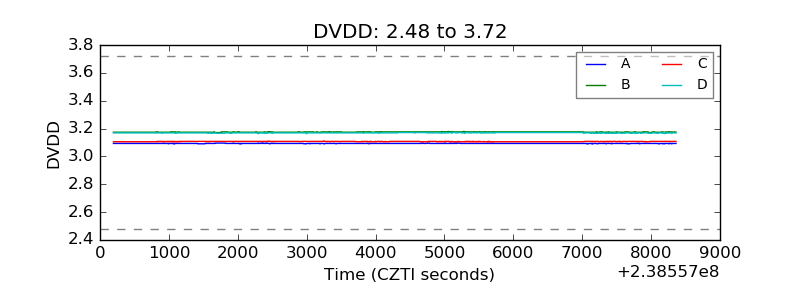 |
| Temperature 1 | 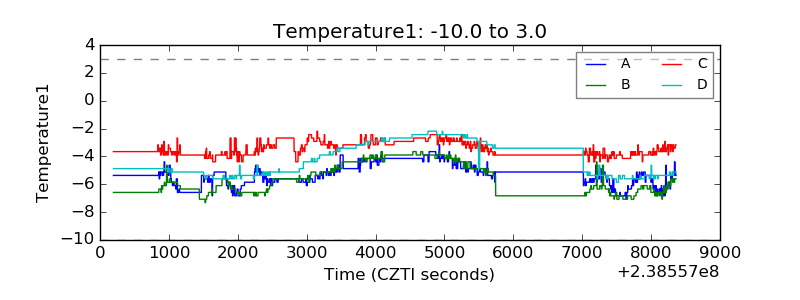 |
| Veto HV Monitor | 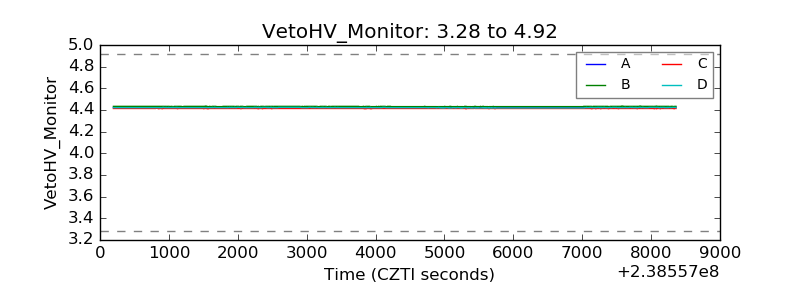 |
| Veto LLD |  |
| Alpha Counter | 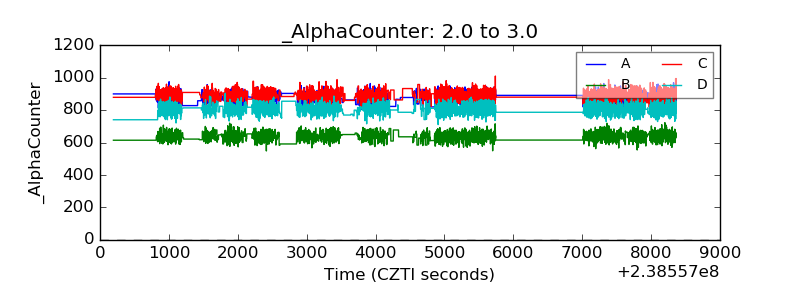 |
| _CPM_Rate | 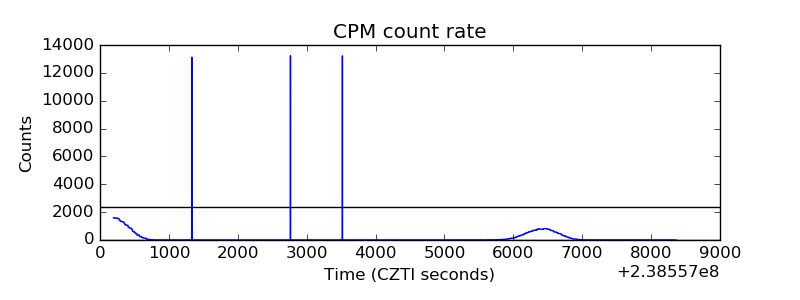 |
| CZT Counter | 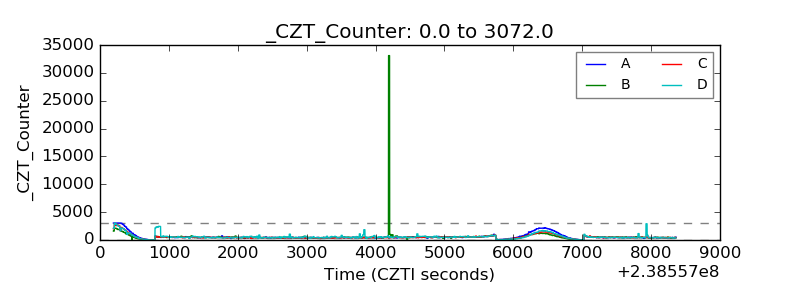 |
| +2.5 Volts monitor |  |
| +5 Volts monitor |  |
| _ROLL_ROT | 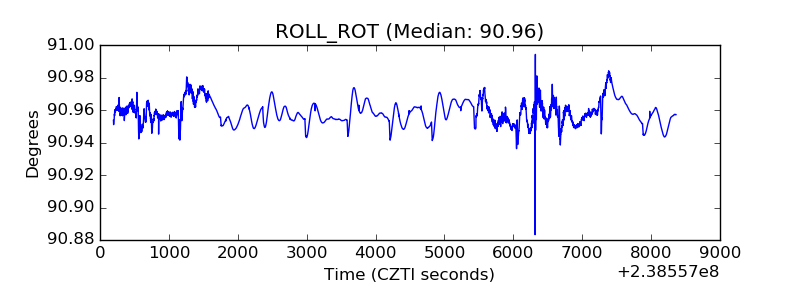 |
| _Roll_DEC | 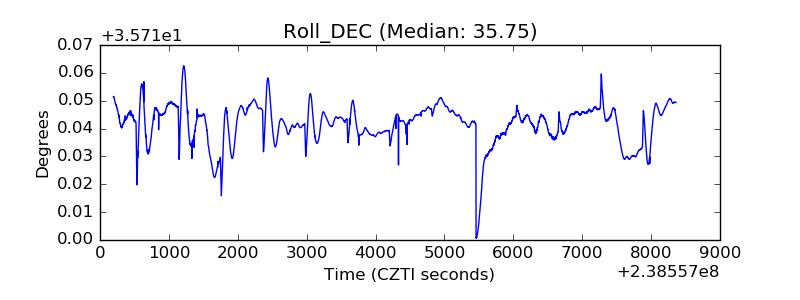 |
| _Roll_RA | 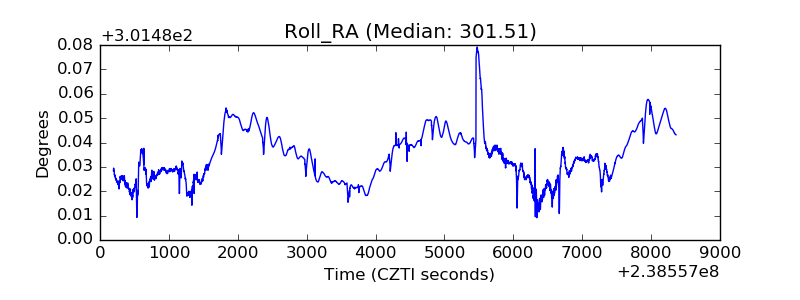 |
| Veto Counter | 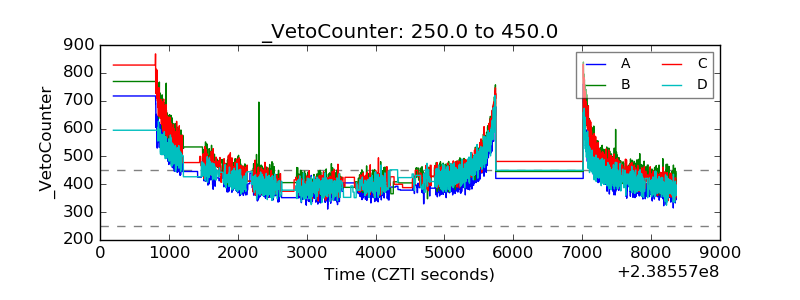 |