| Param | Original file | Final file |
|---|---|---|
| Filename | modeM0/AS1A03_134T01_9000001400_09844cztM0_level2.evt | modeM0/AS1A03_134T01_9000001400_09844cztM0_level2_quad_clean.evt |
| Size (bytes) | 702,002,880 | 127,134,720 |
| Size | 669.5 MB | 121.2 MB |
| Events in quadrant A | 4,847,829 | 794,762 |
| Events in quadrant B | 4,948,447 | 814,206 |
| Events in quadrant C | 4,682,175 | 787,576 |
| Events in quadrant D | 6,080,613 | 737,429 |
| Mode M0 | |||
|---|---|---|---|
| Quadrant | BADHDUFLAG | Total packets | Discarded packets |
| A | 0 | 21543 | 154 |
| B | 0 | 21584 | 125 |
| C | 0 | 21354 | 148 |
| D | 0 | 25430 | 153 |
| Mode SS | |||
|---|---|---|---|
| Quadrant | BADHDUFLAG | Total packets | Discarded packets |
| A | 0 | 212 | 2 |
| B | 0 | 212 | 0 |
| C | 0 | 212 | 0 |
| D | 0 | 212 | 4 |
| Mode M9 | |||
|---|---|---|---|
| Quadrant | BADHDUFLAG | Total packets | Discarded packets |
| A | 0 | 24 | 0 |
| B | 0 | 24 | 0 |
| C | 0 | 24 | 0 |
| D | 0 | 24 | 0 |
| Quadrant | Total seconds | Saturated seconds | Saturation percentage |
|---|---|---|---|
| A | 10337 | 55 | 0.532069% |
| B | 10351 | 64 | 0.618298% |
| C | 10339 | 19 | 0.183770% |
| D | 10342 | 284 | 2.746084% |
Noise dominated data is calculated using 1-second bins in cleaned event files. If a bin has >2000 counts, and if more than 50% of those come from <1% of pixels, then it is considered to be noise-dominated and hence unusable.
| Quadrant | # 1 sec bins | Bins with >0 counts | Bins with >2000 counts | High rate bins dominated by noise | Noise dominated (total time) | Noise dominated (detector-on time) | Marked lightcurve |
|---|---|---|---|---|---|---|---|
| A | 12792 | 10398 | 0 | 0 | 0.00% | 0.00% |  |
| B | 12792 | 10401 | 2 | 2 | 0.02% | 0.02% |  |
| C | 12792 | 10401 | 0 | 0 | 0.00% | 0.00% | 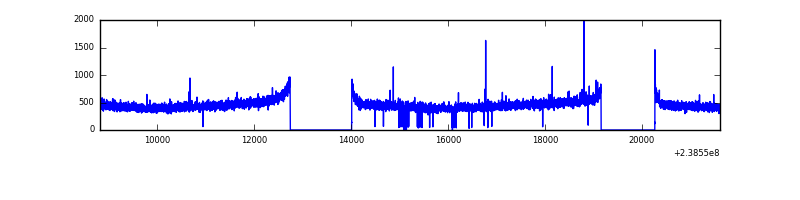 |
| D | 12792 | 10406 | 178 | 178 | 1.39% | 1.71% |  |
Top three noisy pixels from each quadrant. If the there are fewer than three noisy pixels in the level2.evt file, extra rows are filled as -1
| Pixel properties | Quadrant properties | ||||||
|---|---|---|---|---|---|---|---|
| Quadrant | DetID | PixID | Counts | Sigma | Mean | Median | Sigma |
| A | 14 | 111 | 61604 | 241.99 | 1239 | 1217 | 249.5 |
| A | 0 | 226 | 11335 | 40.55 | 1239 | 1217 | 249.5 |
| A | 12 | 194 | 9915 | 34.86 | 1239 | 1217 | 249.5 |
| B | 4 | 81 | 32493 | 134.2 | 1248 | 1219 | 233.0 |
| B | 4 | 173 | 32076 | 132.41 | 1248 | 1219 | 233.0 |
| B | 12 | 111 | 26743 | 109.52 | 1248 | 1219 | 233.0 |
| C | 13 | 61 | 8870 | 28.01 | 1194 | 1202 | 273.8 |
| C | 9 | 54 | 8465 | 26.53 | 1194 | 1202 | 273.8 |
| C | 10 | 22 | 7360 | 22.49 | 1194 | 1202 | 273.8 |
| D | 1 | 52 | 776048 | 2620.65 | 1169 | 1143 | 295.7 |
| D | 2 | 16 | 485715 | 1638.77 | 1169 | 1143 | 295.7 |
| D | 2 | 14 | 231964 | 780.61 | 1169 | 1143 | 295.7 |
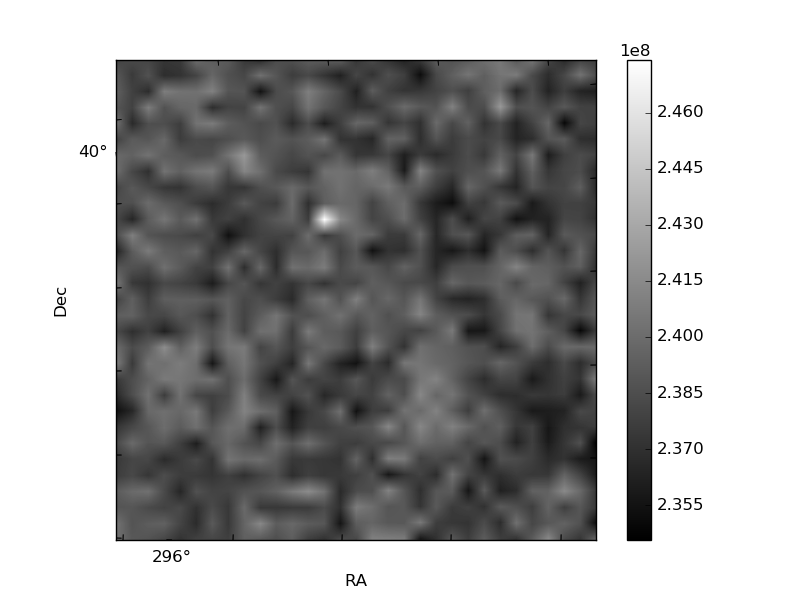
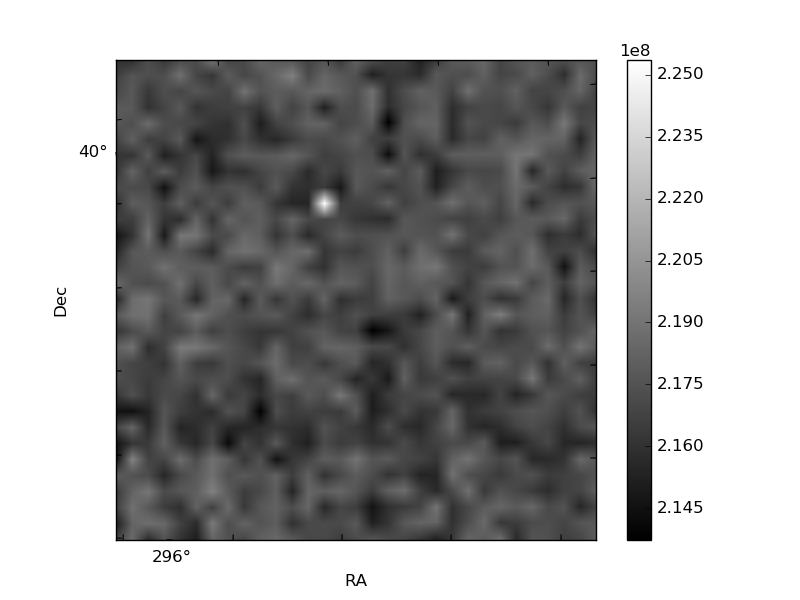
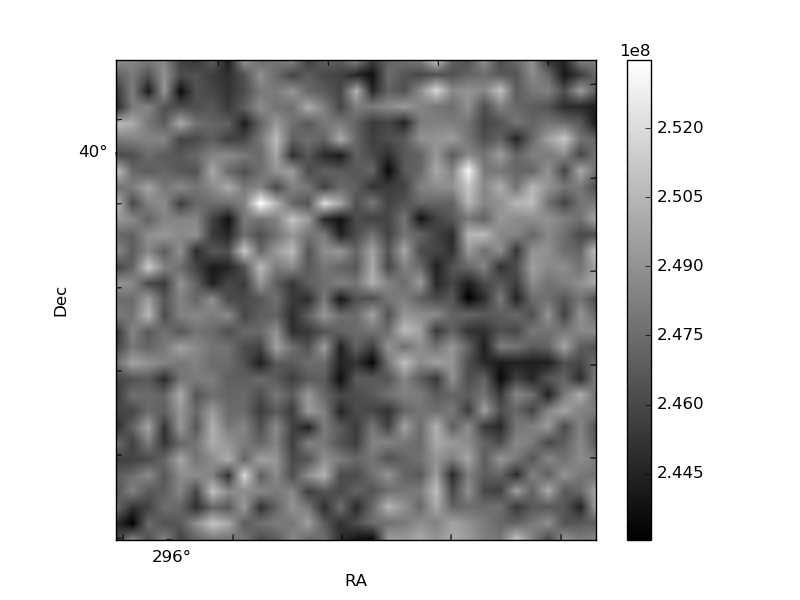
Histogram calculated using DETX and DETY for each event in the final _common_clean file
| Quadrant A | 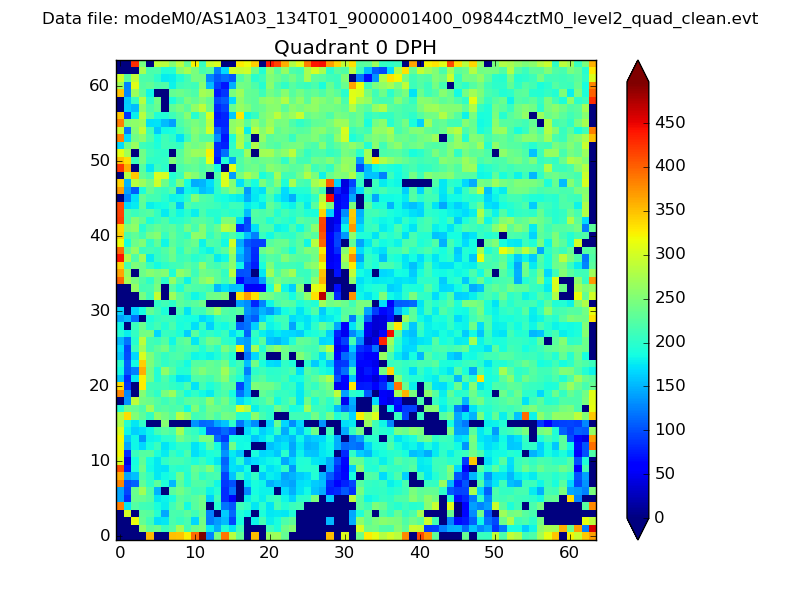 |
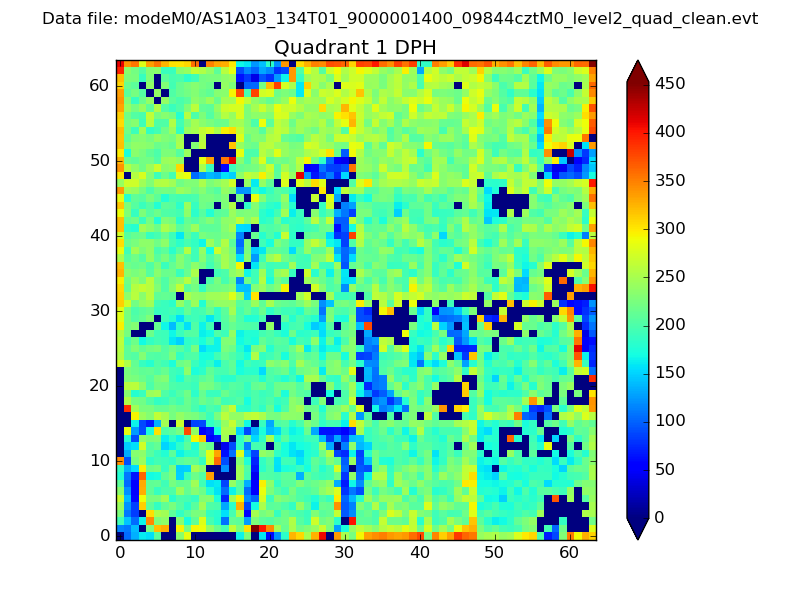 |
Quadrant B |
|---|---|---|---|
| Quadrant D | 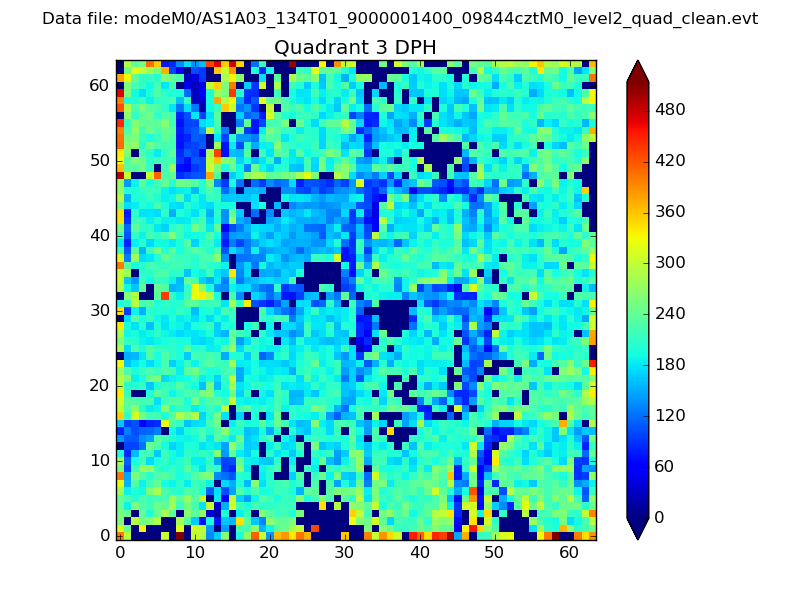 |
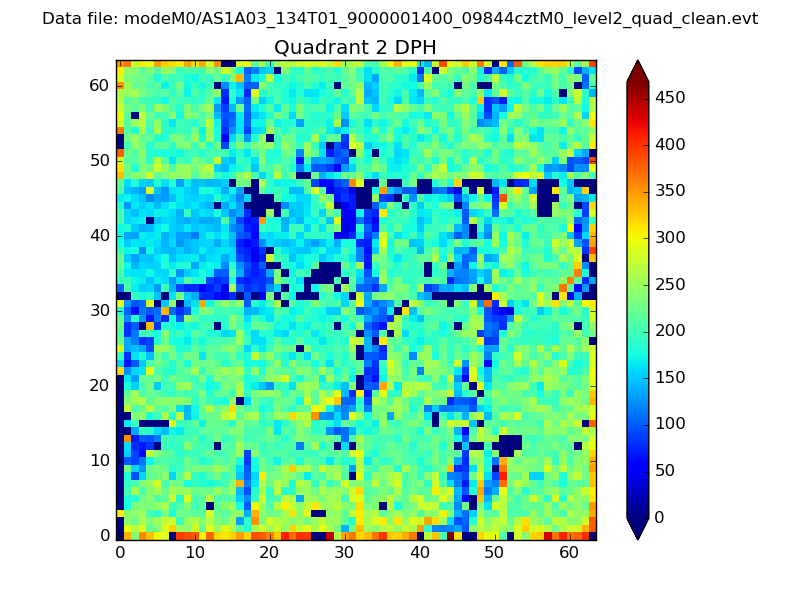 |
Quadrant C |
| Plot type | Count rate plots | Images |
|---|---|---|
| Comparison with Poisson distribution Blue bars denote a histogram of data divided into 1 sec bins. Red curve is a Poisson curve with rate = median count rate of data. |
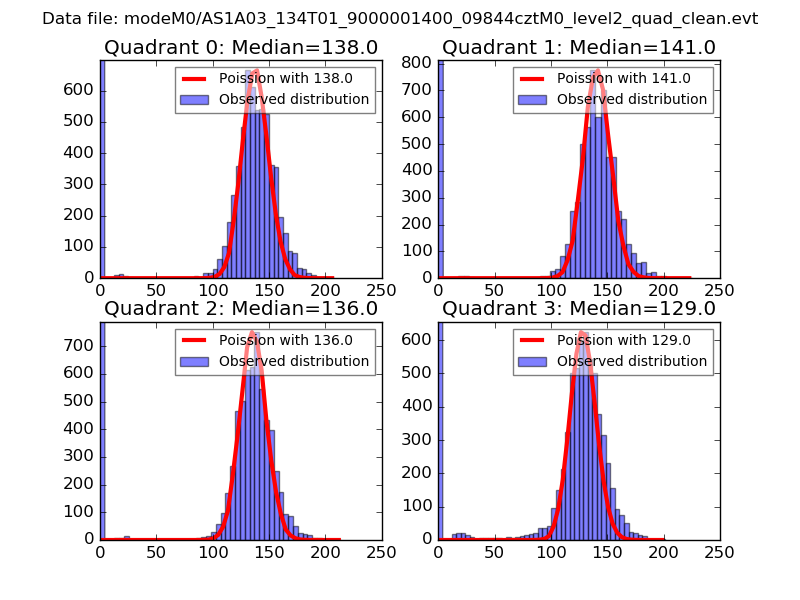 |
 |
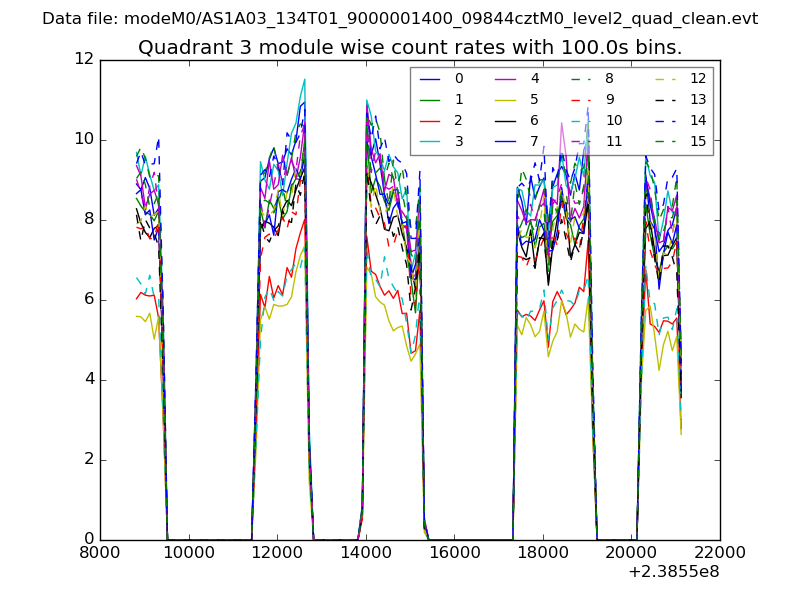
| Quadrant-wise count rates Data is divided into 100 sec bins |
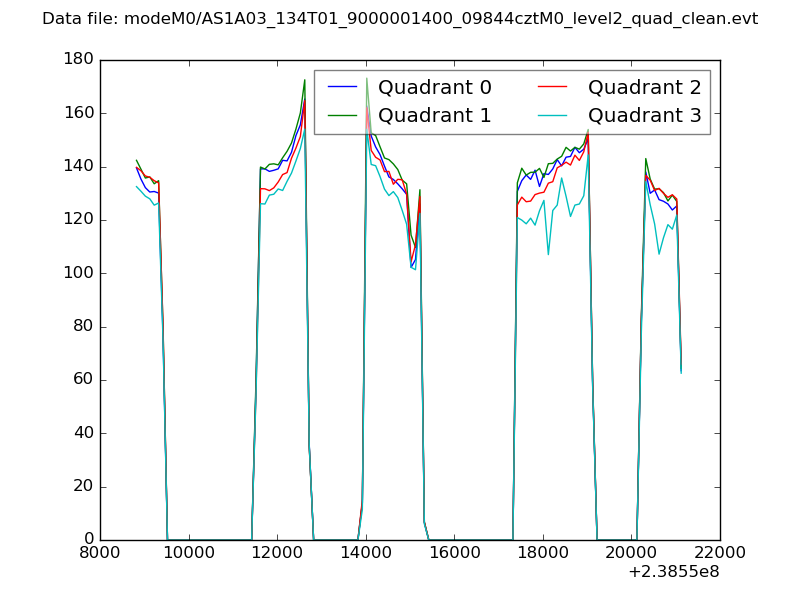 |
|
| Module-wise count rates for Quadrant A Data is divided into 100 sec bins |
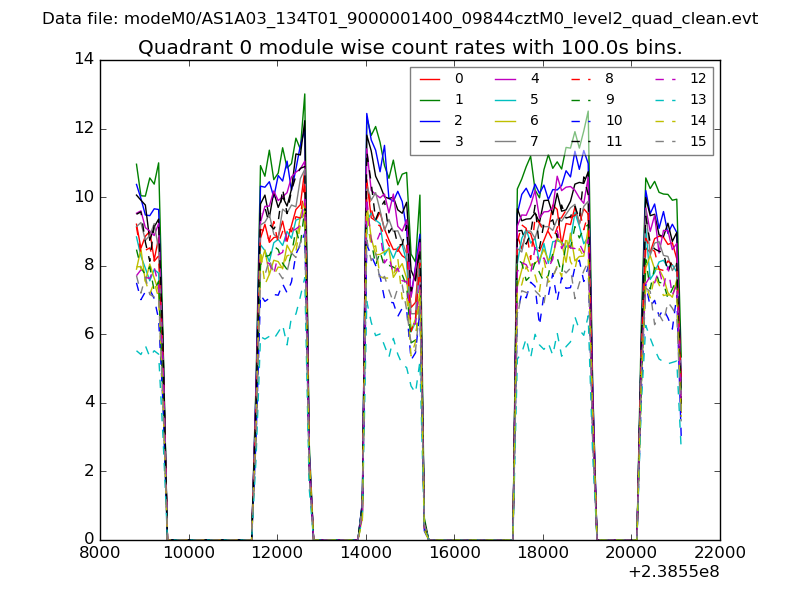 |
 |
| Module-wise count rates for Quadrant B Data is divided into 100 sec bins |
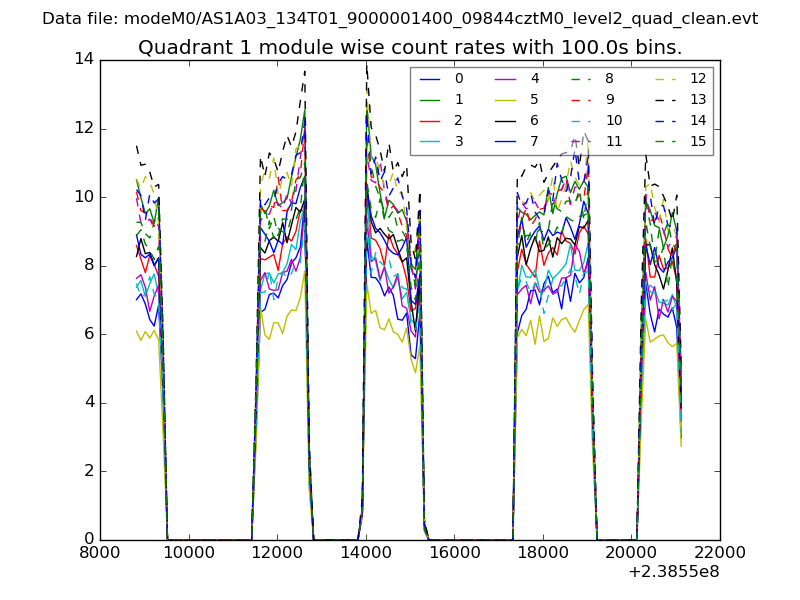 |
 |
| Module-wise count rates for Quadrant C Data is divided into 100 sec bins |
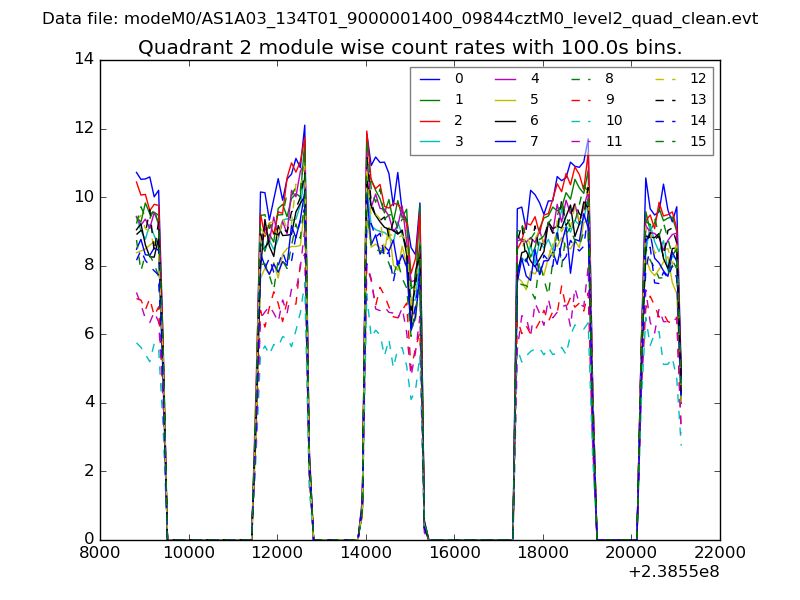 |
 |
| Module-wise count rates for Quadrant D Data is divided into 100 sec bins |
 |
 |
| Parameter | Plot |
|---|---|
| CZT HV Monitor | 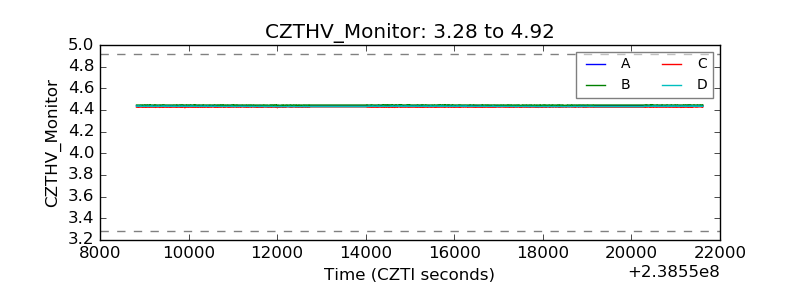 |
| D_VDD | 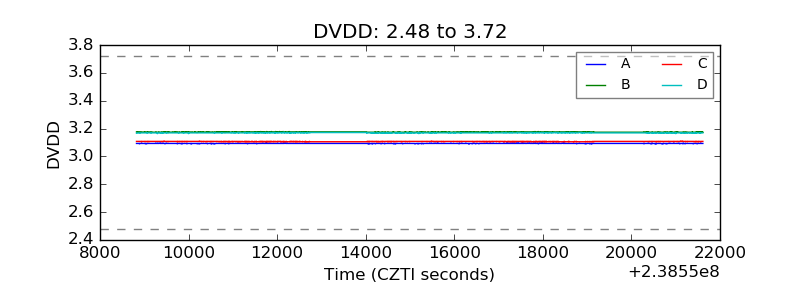 |
| Temperature 1 | 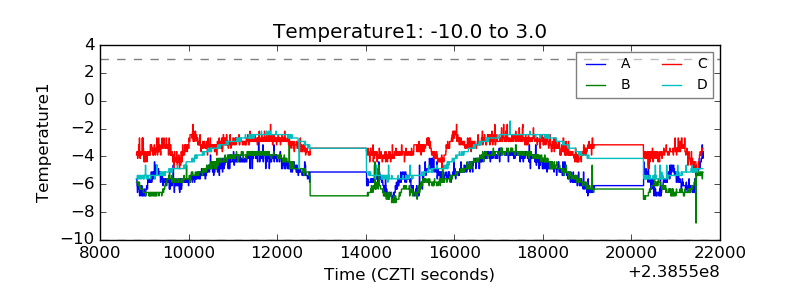 |
| Veto HV Monitor | 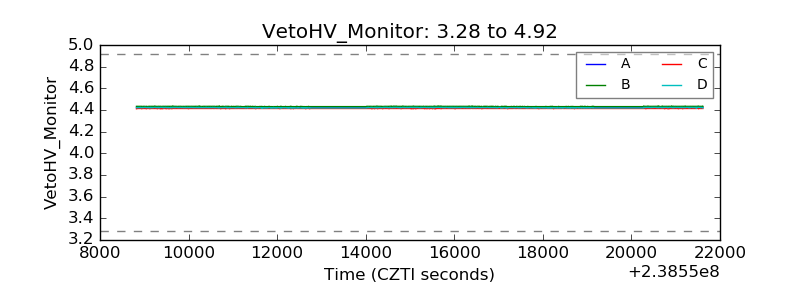 |
| Veto LLD | 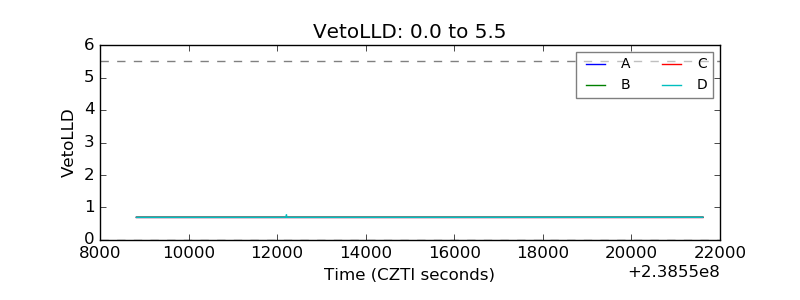 |
| Alpha Counter | 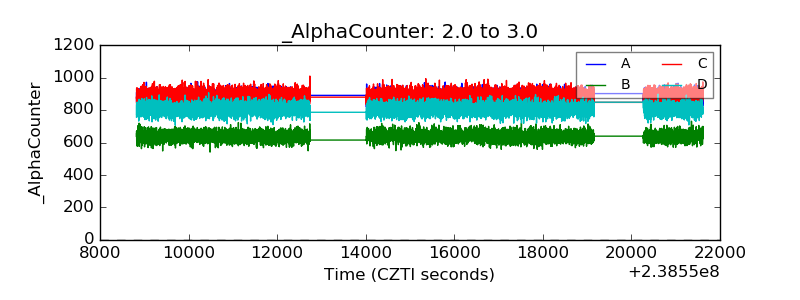 |
| _CPM_Rate | 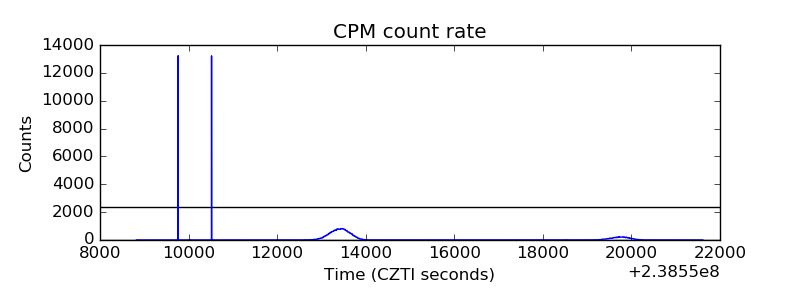 |
| CZT Counter | 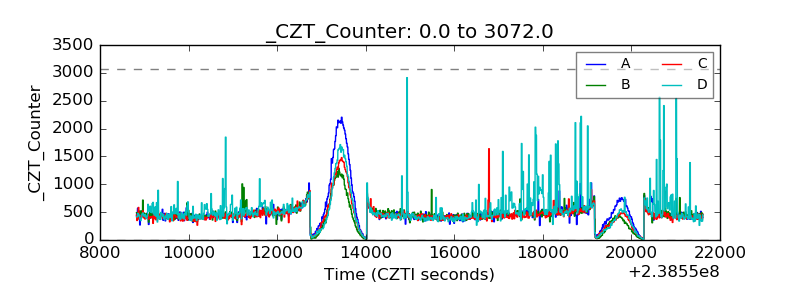 |
| +2.5 Volts monitor |  |
| +5 Volts monitor |  |
| _ROLL_ROT | 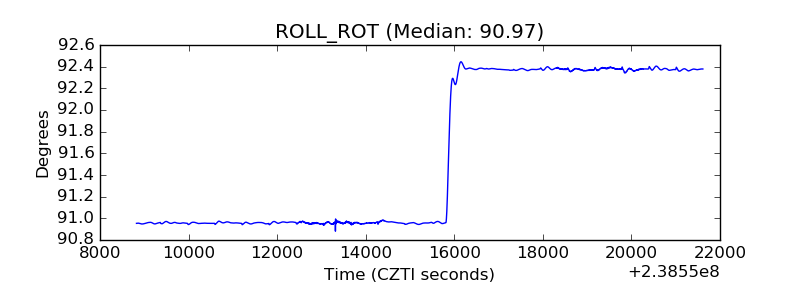 |
| _Roll_DEC | 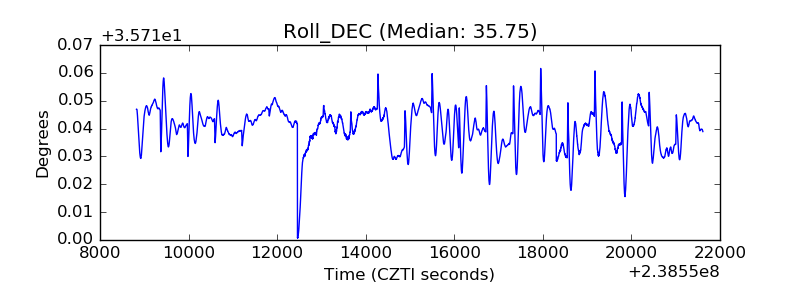 |
| _Roll_RA | 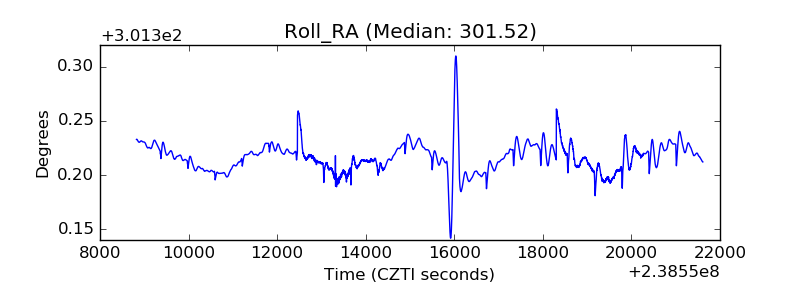 |
| Veto Counter | 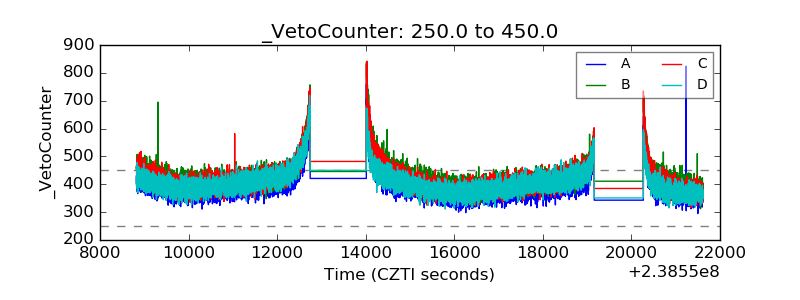 |