| Param | Original file | Final file |
|---|---|---|
| Filename | modeM0/AS1A03_134T01_9000001400_09850cztM0_level2.evt | modeM0/AS1A03_134T01_9000001400_09850cztM0_level2_quad_clean.evt |
| Size (bytes) | 898,813,440 | 169,562,880 |
| Size | 857.2 MB | 161.7 MB |
| Events in quadrant A | 6,042,752 | 1,073,684 |
| Events in quadrant B | 6,424,175 | 1,080,031 |
| Events in quadrant C | 6,005,621 | 1,051,550 |
| Events in quadrant D | 7,843,299 | 1,007,572 |
| Mode M0 | |||
|---|---|---|---|
| Quadrant | BADHDUFLAG | Total packets | Discarded packets |
| A | 0 | 27296 | 57 |
| B | 0 | 28050 | 51 |
| C | 0 | 27258 | 35 |
| D | 0 | 32561 | 87 |
| Mode SS | |||
|---|---|---|---|
| Quadrant | BADHDUFLAG | Total packets | Discarded packets |
| A | 0 | 274 | 2 |
| B | 0 | 274 | 2 |
| C | 0 | 274 | 0 |
| D | 0 | 274 | 0 |
| Mode M9 | |||
|---|---|---|---|
| Quadrant | BADHDUFLAG | Total packets | Discarded packets |
| A | 0 | 16 | 0 |
| B | 0 | 16 | 0 |
| C | 0 | 16 | 1 |
| D | 0 | 16 | 0 |
| Quadrant | Total seconds | Saturated seconds | Saturation percentage |
|---|---|---|---|
| A | 13353 | 211 | 1.580169% |
| B | 13358 | 228 | 1.706842% |
| C | 13363 | 188 | 1.406870% |
| D | 13350 | 464 | 3.475655% |
Noise dominated data is calculated using 1-second bins in cleaned event files. If a bin has >2000 counts, and if more than 50% of those come from <1% of pixels, then it is considered to be noise-dominated and hence unusable.
| Quadrant | # 1 sec bins | Bins with >0 counts | Bins with >2000 counts | High rate bins dominated by noise | Noise dominated (total time) | Noise dominated (detector-on time) | Marked lightcurve |
|---|---|---|---|---|---|---|---|
| A | 14973 | 13380 | 0 | 0 | 0.00% | 0.00% | 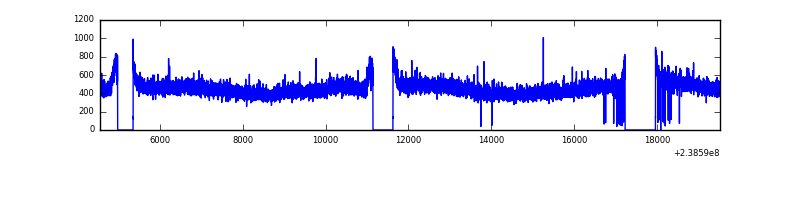 |
| B | 14973 | 13380 | 4 | 4 | 0.03% | 0.03% | 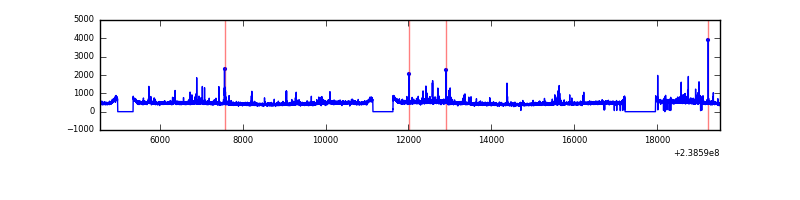 |
| C | 14973 | 13381 | 0 | 0 | 0.00% | 0.00% |  |
| D | 14973 | 13377 | 170 | 170 | 1.14% | 1.27% | 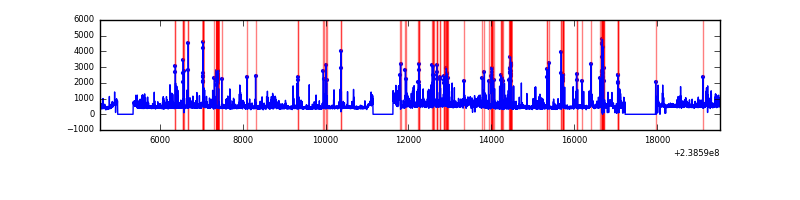 |
Top three noisy pixels from each quadrant. If the there are fewer than three noisy pixels in the level2.evt file, extra rows are filled as -1
| Pixel properties | Quadrant properties | ||||||
|---|---|---|---|---|---|---|---|
| Quadrant | DetID | PixID | Counts | Sigma | Mean | Median | Sigma |
| A | 0 | 226 | 14454 | 41.08 | 1569 | 1537 | 314.4 |
| A | 12 | 194 | 12625 | 35.27 | 1569 | 1537 | 314.4 |
| A | 3 | 137 | 7443 | 18.78 | 1569 | 1537 | 314.4 |
| B | 0 | 214 | 81591 | 268.82 | 1574 | 1535 | 297.8 |
| B | 0 | 229 | 58020 | 189.67 | 1574 | 1535 | 297.8 |
| B | 4 | 81 | 54286 | 177.13 | 1574 | 1535 | 297.8 |
| C | 10 | 22 | 15301 | 38.99 | 1528 | 1533 | 353.1 |
| C | 8 | 128 | 11835 | 29.17 | 1528 | 1533 | 353.1 |
| C | 13 | 61 | 11480 | 28.17 | 1528 | 1533 | 353.1 |
| D | 1 | 52 | 1344804 | 3476.76 | 1498 | 1466 | 386.4 |
| D | 12 | 233 | 332469 | 856.69 | 1498 | 1466 | 386.4 |
| D | 2 | 16 | 164246 | 421.3 | 1498 | 1466 | 386.4 |
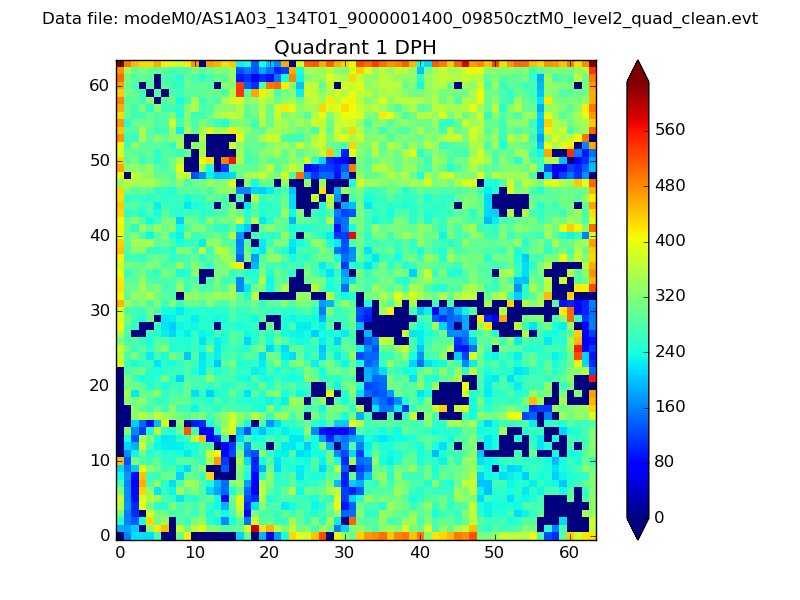
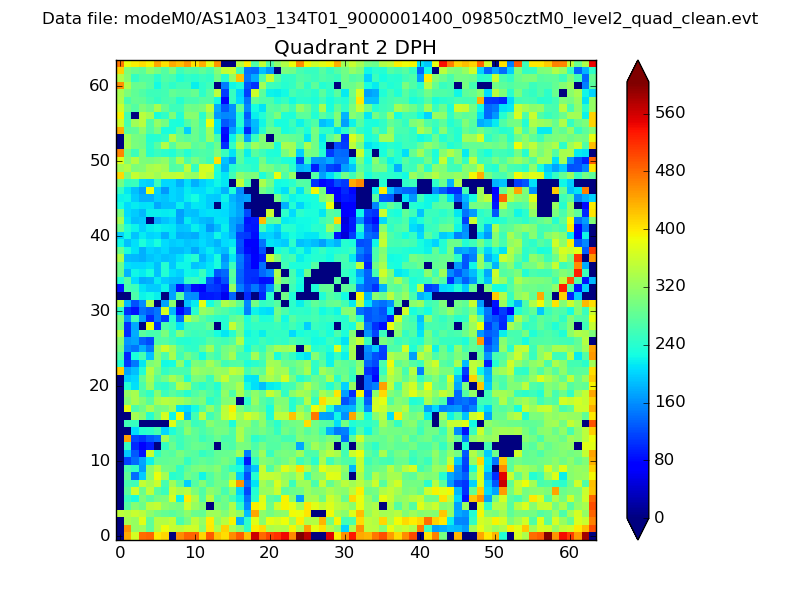
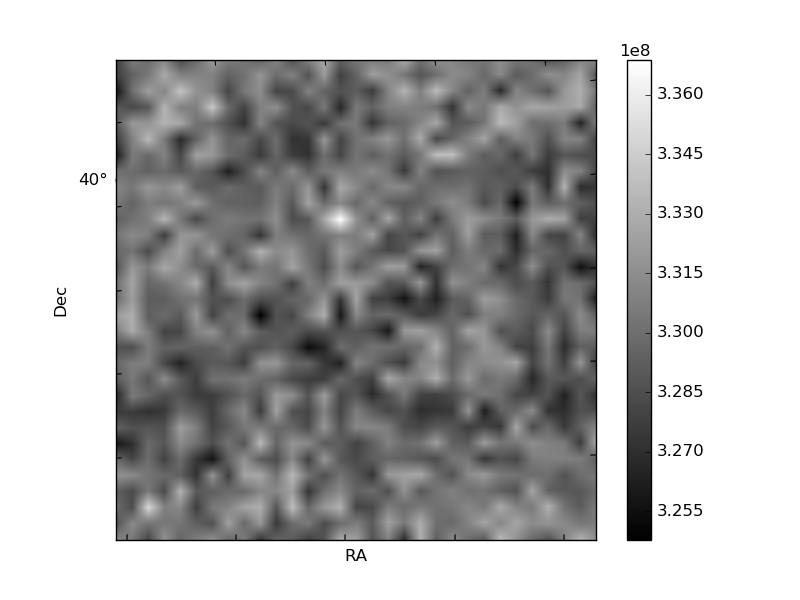
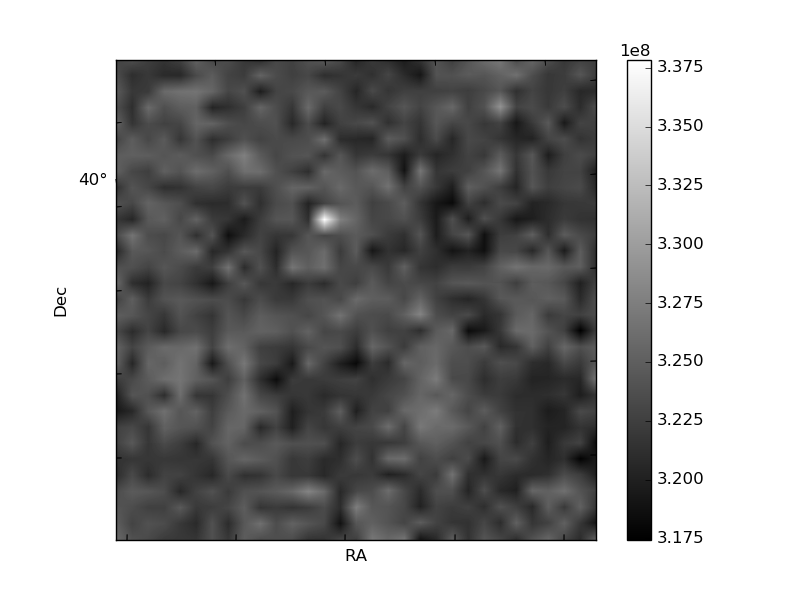
Histogram calculated using DETX and DETY for each event in the final _common_clean file
| Quadrant A |  |
 |
Quadrant B |
|---|---|---|---|
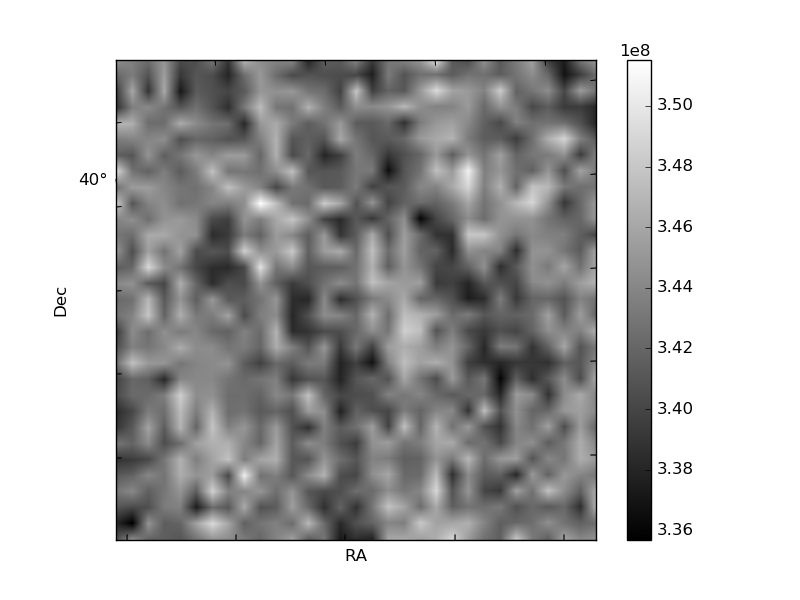
| Quadrant D | 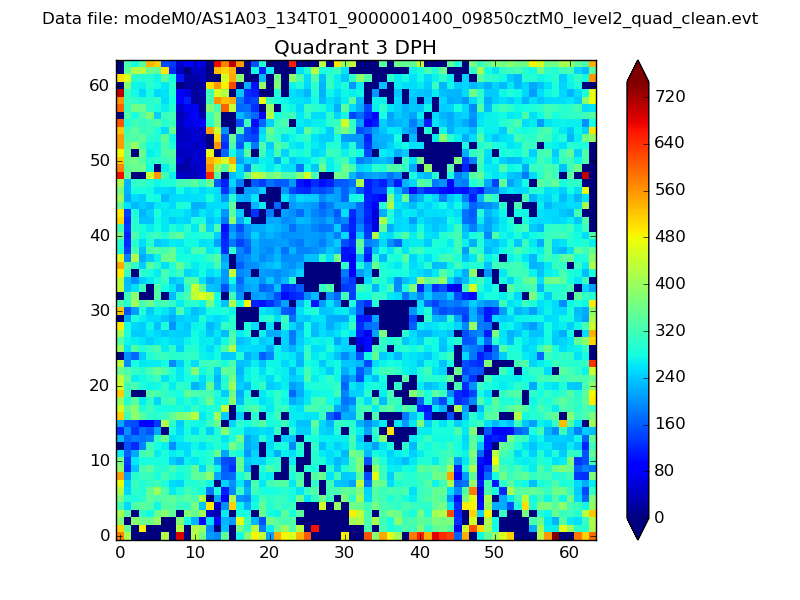 |
 |
Quadrant C |
| Plot type | Count rate plots | Images |
|---|---|---|
| Comparison with Poisson distribution Blue bars denote a histogram of data divided into 1 sec bins. Red curve is a Poisson curve with rate = median count rate of data. |
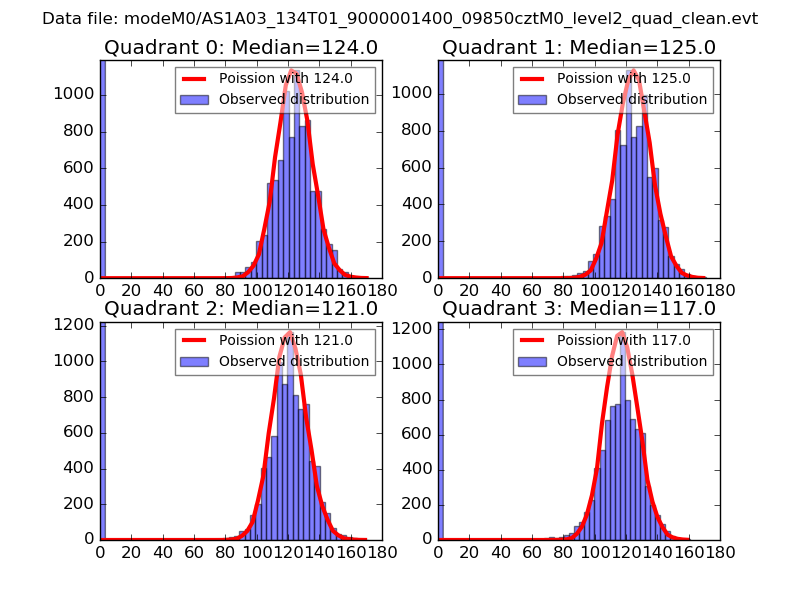 |
 |
| Quadrant-wise count rates Data is divided into 100 sec bins |
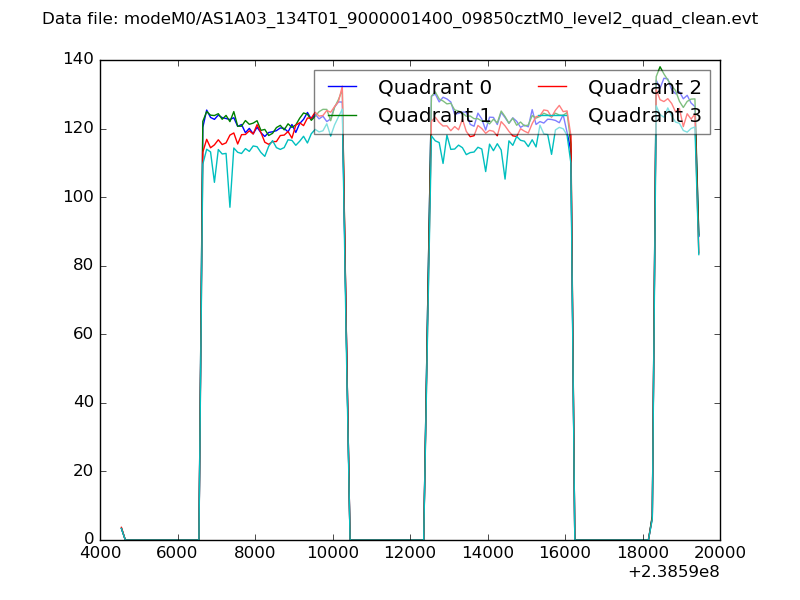 |
|
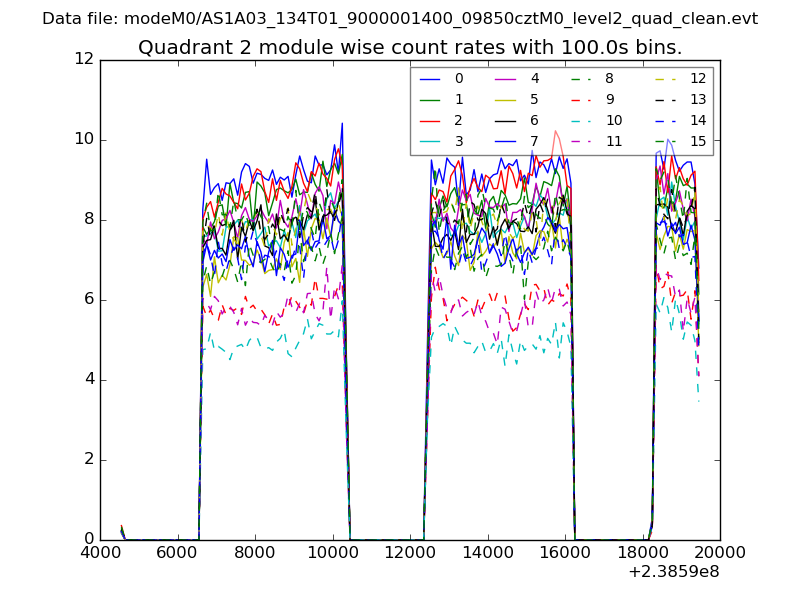
| Module-wise count rates for Quadrant A Data is divided into 100 sec bins |
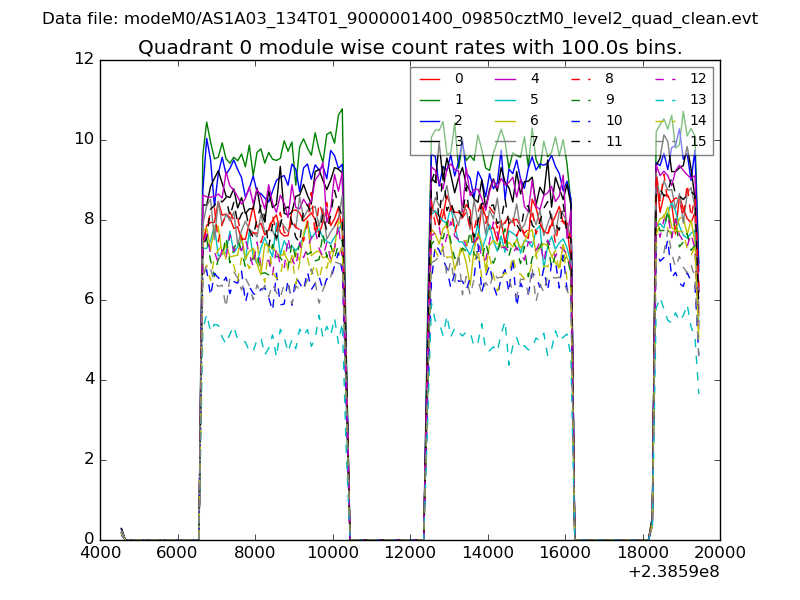 |
 |
| Module-wise count rates for Quadrant B Data is divided into 100 sec bins |
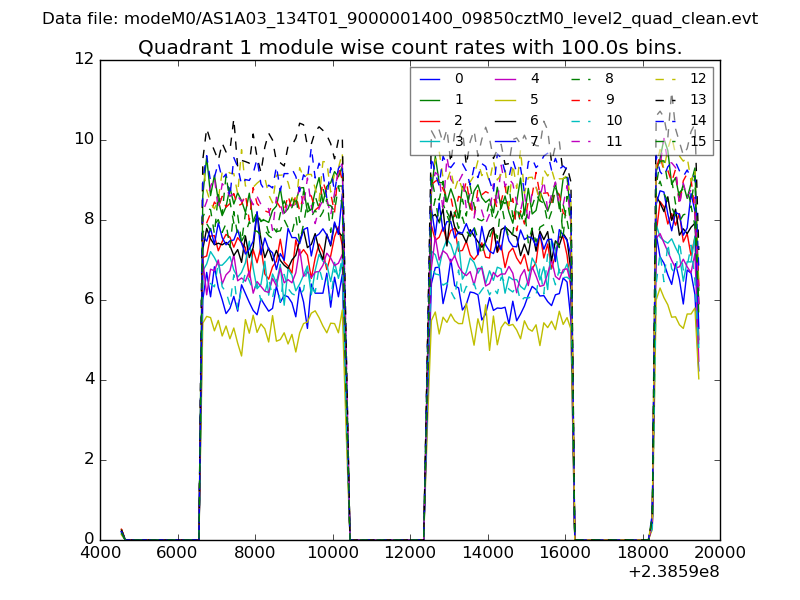 |
 |
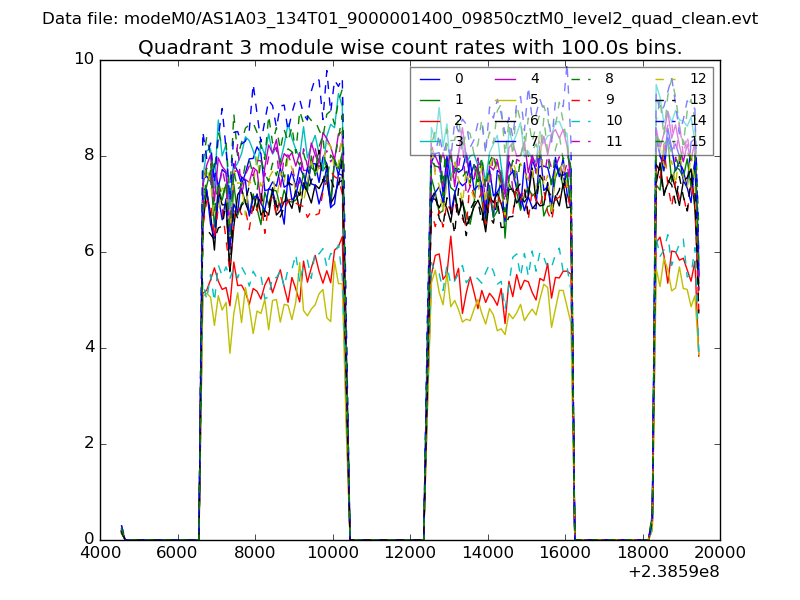
| Module-wise count rates for Quadrant C Data is divided into 100 sec bins |
 |
 |
| Module-wise count rates for Quadrant D Data is divided into 100 sec bins |
 |
 |
| Parameter | Plot |
|---|---|
| CZT HV Monitor | 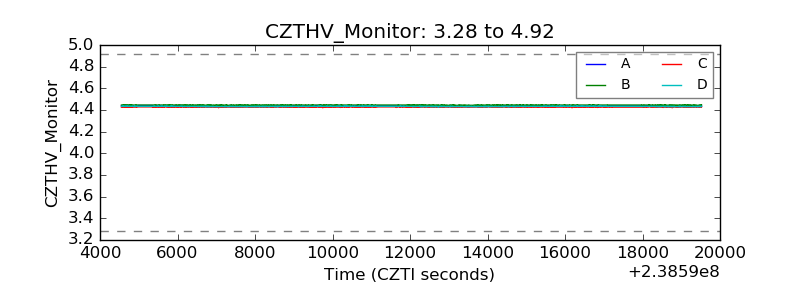 |
| D_VDD | 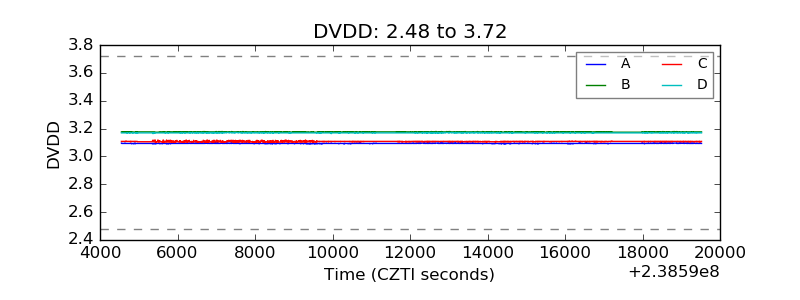 |
| Temperature 1 | 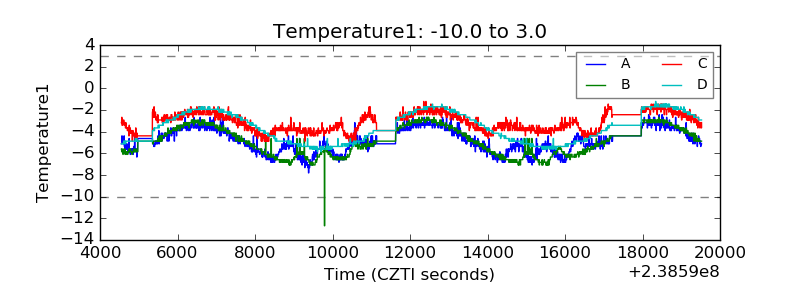 |
| Veto HV Monitor | 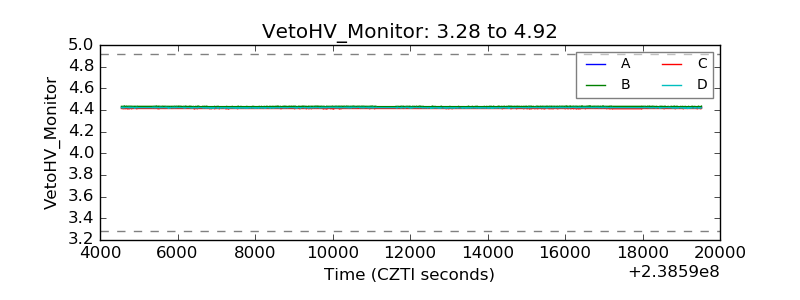 |
| Veto LLD | 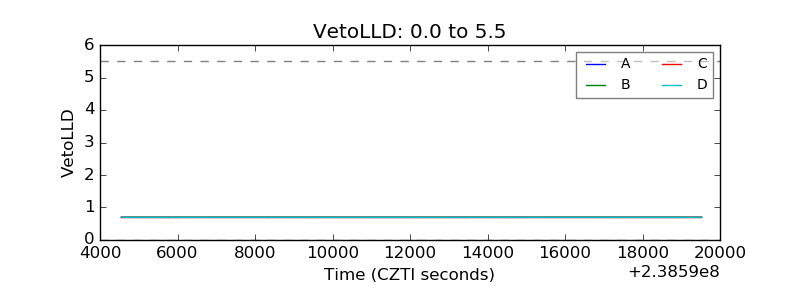 |
| Alpha Counter | 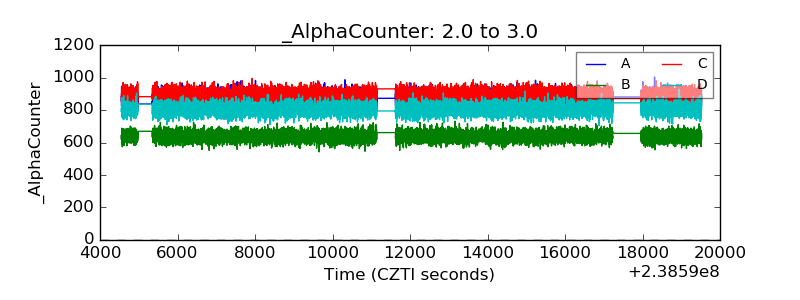 |
| _CPM_Rate | 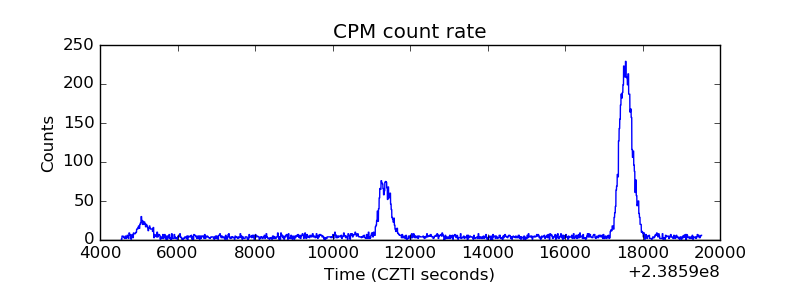 |
| CZT Counter | 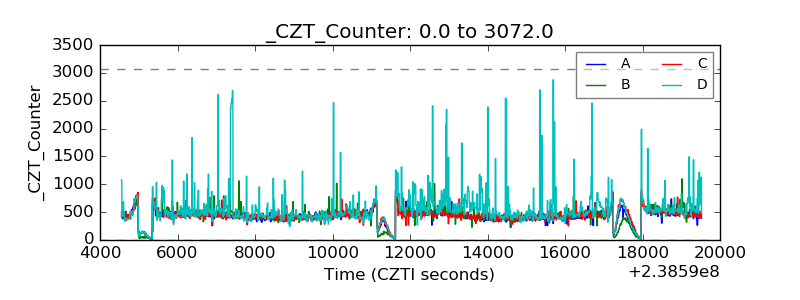 |
| +2.5 Volts monitor |  |
| +5 Volts monitor | 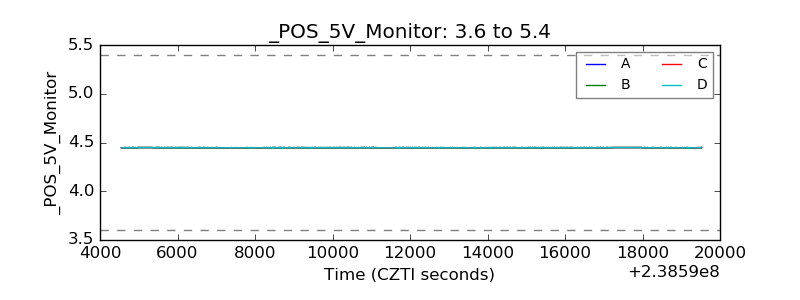 |
| _ROLL_ROT | 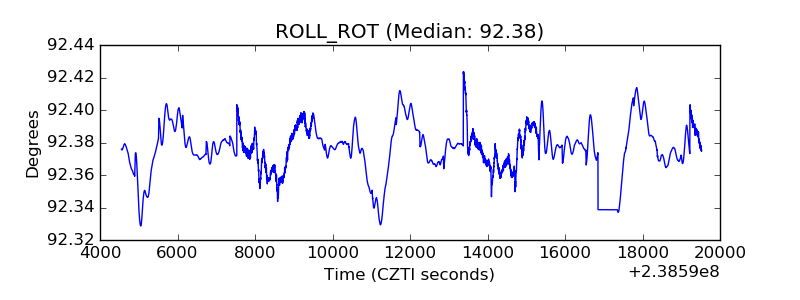 |
| _Roll_DEC | 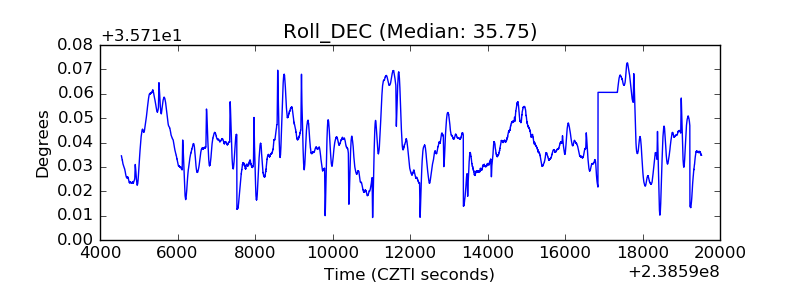 |
| _Roll_RA | 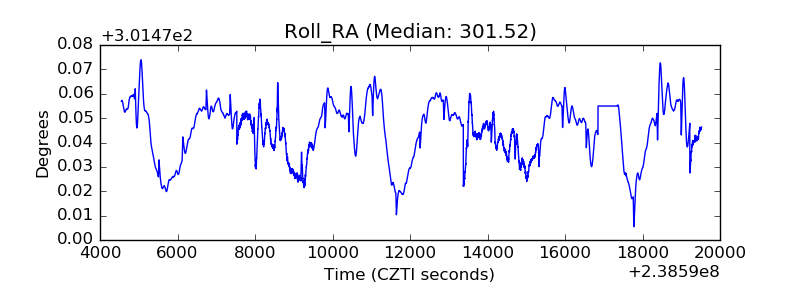 |
| Veto Counter | 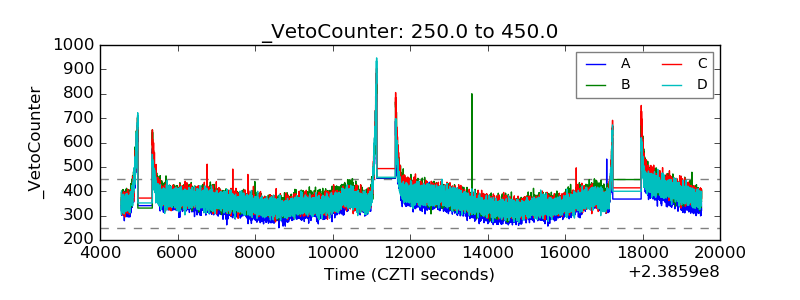 |