| Param | Original file | Final file |
|---|---|---|
| Filename | modeM0/AS1A03_134T01_9000001400_09851cztM0_level2.evt | modeM0/AS1A03_134T01_9000001400_09851cztM0_level2_quad_clean.evt |
| Size (bytes) | 429,730,560 | 98,605,440 |
| Size | 409.8 MB | 94.0 MB |
| Events in quadrant A | 2,910,397 | 645,326 |
| Events in quadrant B | 3,116,065 | 649,906 |
| Events in quadrant C | 2,969,270 | 634,882 |
| Events in quadrant D | 3,583,652 | 609,841 |
| Mode M0 | |||
|---|---|---|---|
| Quadrant | BADHDUFLAG | Total packets | Discarded packets |
| A | 0 | 13084 | 2 |
| B | 0 | 13638 | 9 |
| C | 0 | 13199 | 5 |
| D | 0 | 15015 | 15 |
| Mode SS | |||
|---|---|---|---|
| Quadrant | BADHDUFLAG | Total packets | Discarded packets |
| A | 0 | 130 | 0 |
| B | 0 | 130 | 0 |
| C | 0 | 130 | 0 |
| D | 0 | 130 | 0 |
| Mode M9 | |||
|---|---|---|---|
| Quadrant | BADHDUFLAG | Total packets | Discarded packets |
| A | 0 | 9 | 0 |
| B | 0 | 9 | 0 |
| C | 0 | 9 | 0 |
| D | 0 | 9 | 0 |
| Quadrant | Total seconds | Saturated seconds | Saturation percentage |
|---|---|---|---|
| A | 6401 | 34 | 0.531167% |
| B | 6397 | 55 | 0.859778% |
| C | 6399 | 41 | 0.640725% |
| D | 6396 | 109 | 1.704190% |
Noise dominated data is calculated using 1-second bins in cleaned event files. If a bin has >2000 counts, and if more than 50% of those come from <1% of pixels, then it is considered to be noise-dominated and hence unusable.
| Quadrant | # 1 sec bins | Bins with >0 counts | Bins with >2000 counts | High rate bins dominated by noise | Noise dominated (total time) | Noise dominated (detector-on time) | Marked lightcurve |
|---|---|---|---|---|---|---|---|
| A | 7316 | 6402 | 0 | 0 | 0.00% | 0.00% | 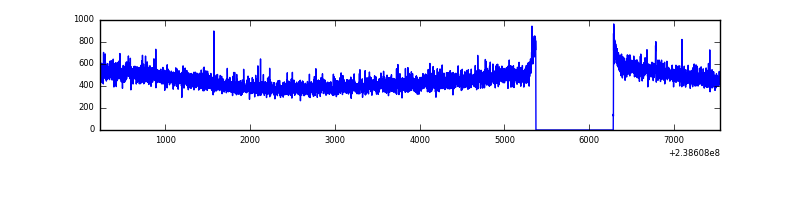 |
| B | 7316 | 6402 | 4 | 4 | 0.05% | 0.06% | 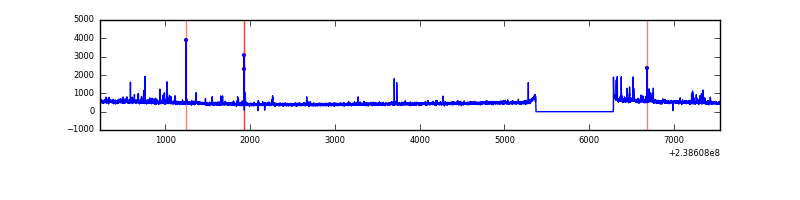 |
| C | 7316 | 6402 | 6 | 6 | 0.08% | 0.09% | 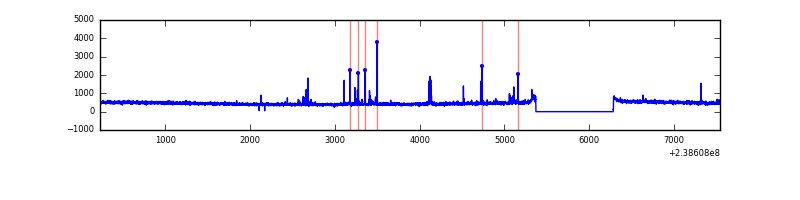 |
| D | 7316 | 6402 | 66 | 66 | 0.90% | 1.03% |  |
Top three noisy pixels from each quadrant. If the there are fewer than three noisy pixels in the level2.evt file, extra rows are filled as -1
| Pixel properties | Quadrant properties | ||||||
|---|---|---|---|---|---|---|---|
| Quadrant | DetID | PixID | Counts | Sigma | Mean | Median | Sigma |
| A | 0 | 226 | 6765 | 39.19 | 754 | 740 | 153.8 |
| A | 12 | 194 | 6018 | 34.33 | 754 | 740 | 153.8 |
| A | 8 | 4 | 3991 | 21.14 | 754 | 740 | 153.8 |
| B | 4 | 81 | 68352 | 472.7 | 755 | 736 | 143.0 |
| B | 0 | 214 | 63167 | 436.45 | 755 | 736 | 143.0 |
| B | 4 | 239 | 28569 | 194.58 | 755 | 736 | 143.0 |
| C | 4 | 254 | 84694 | 492.06 | 737 | 742 | 170.6 |
| C | 0 | 207 | 8481 | 45.36 | 737 | 742 | 170.6 |
| C | 13 | 61 | 5526 | 28.04 | 737 | 742 | 170.6 |
| D | 12 | 233 | 353146 | 1910.5 | 728 | 711 | 184.5 |
| D | 1 | 52 | 220981 | 1194.06 | 728 | 711 | 184.5 |
| D | 2 | 16 | 74635 | 400.73 | 728 | 711 | 184.5 |
Histogram calculated using DETX and DETY for each event in the final _common_clean file
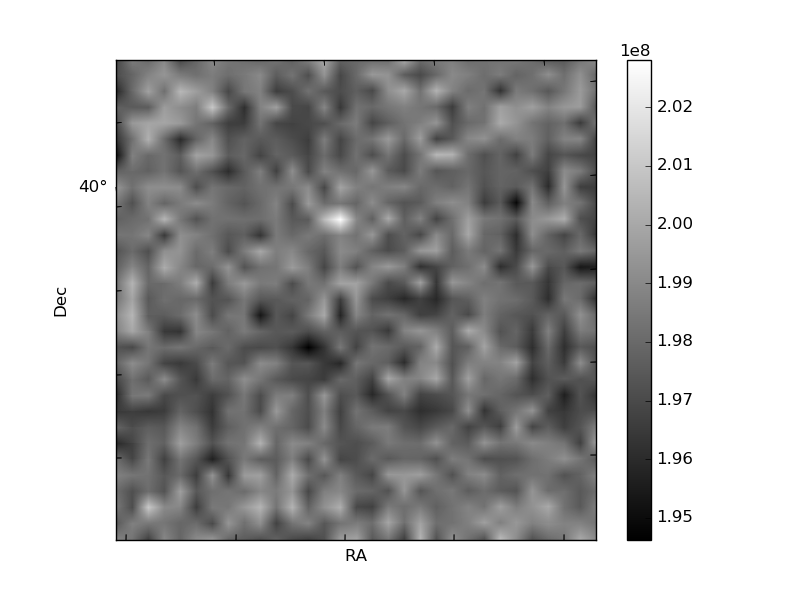
| Quadrant A |  |
 |
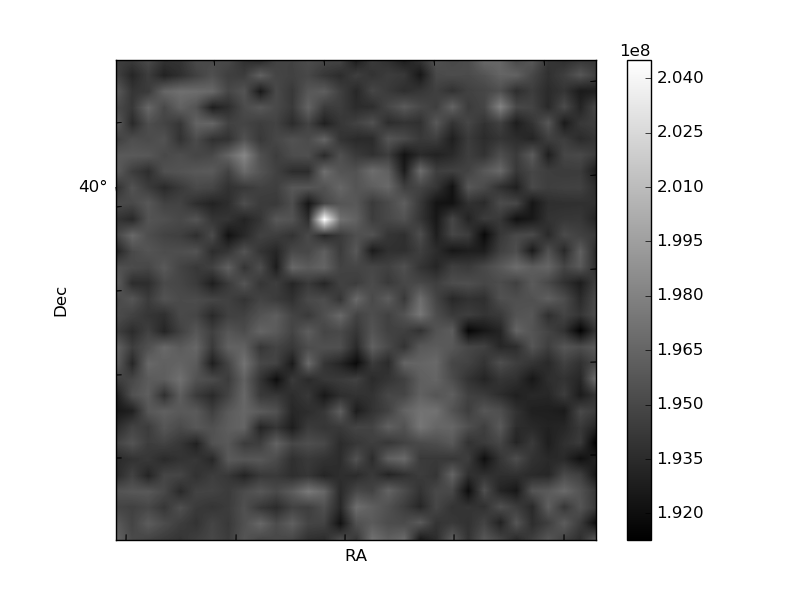
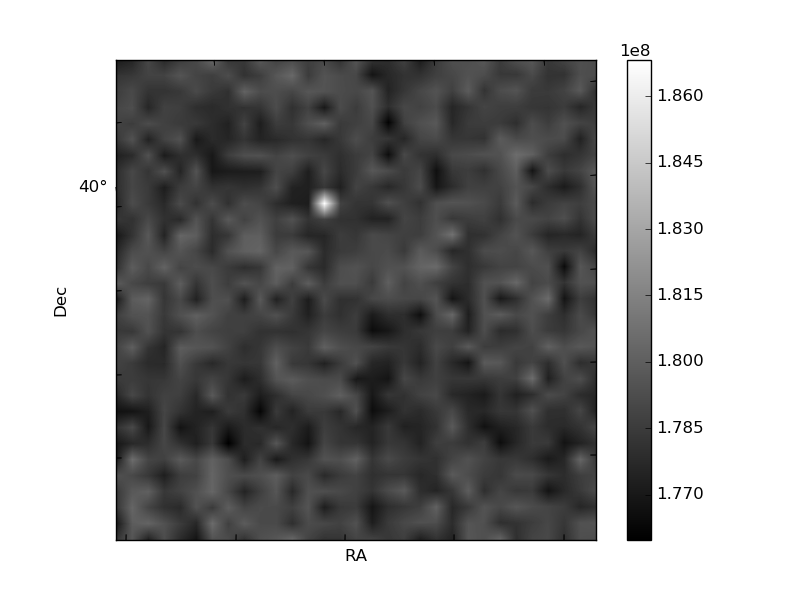
Quadrant B |
|---|---|---|---|
| Quadrant D | 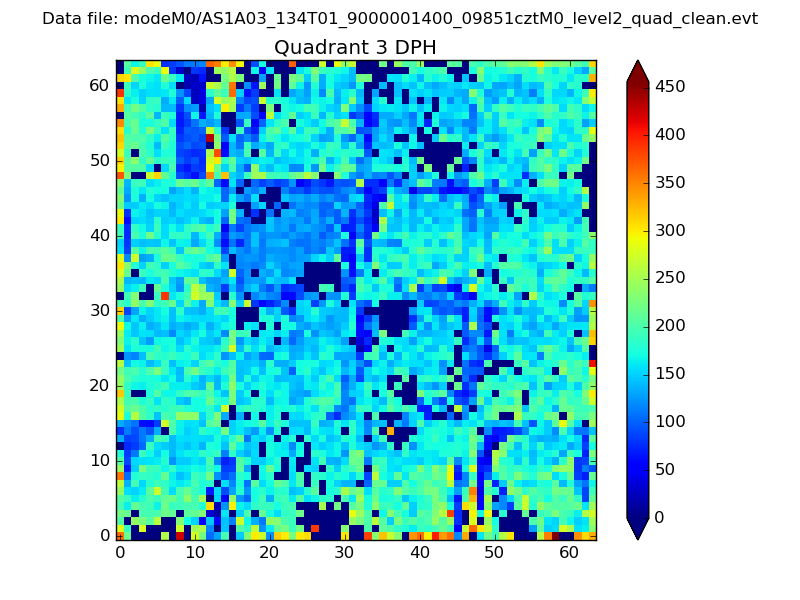 |
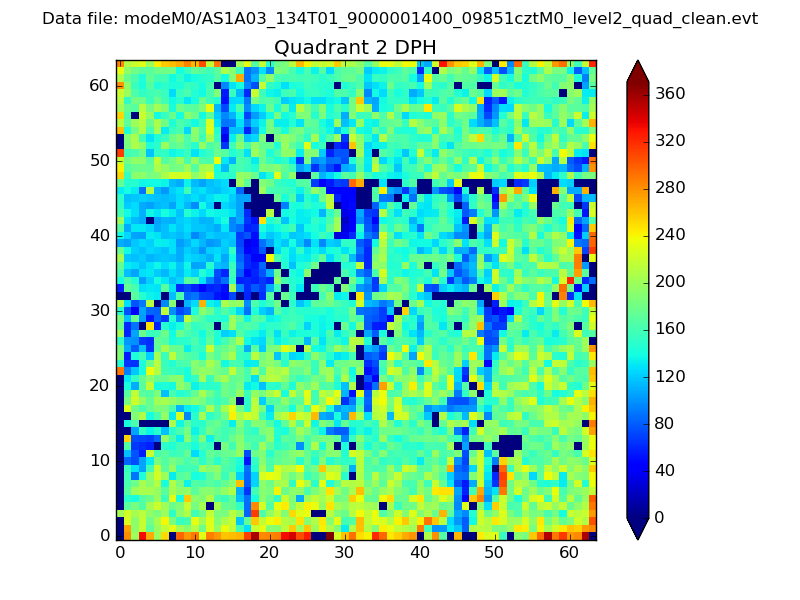 |
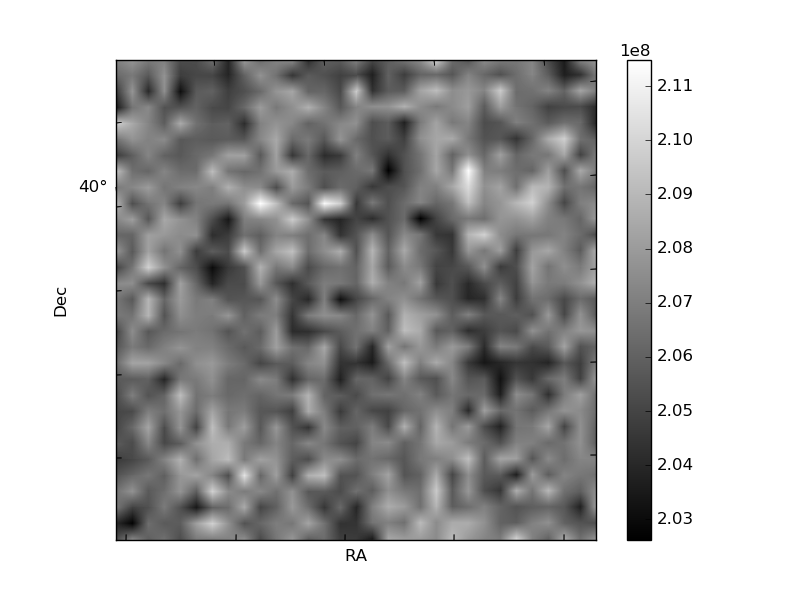
Quadrant C |
| Plot type | Count rate plots | Images |
|---|---|---|
| Comparison with Poisson distribution Blue bars denote a histogram of data divided into 1 sec bins. Red curve is a Poisson curve with rate = median count rate of data. |
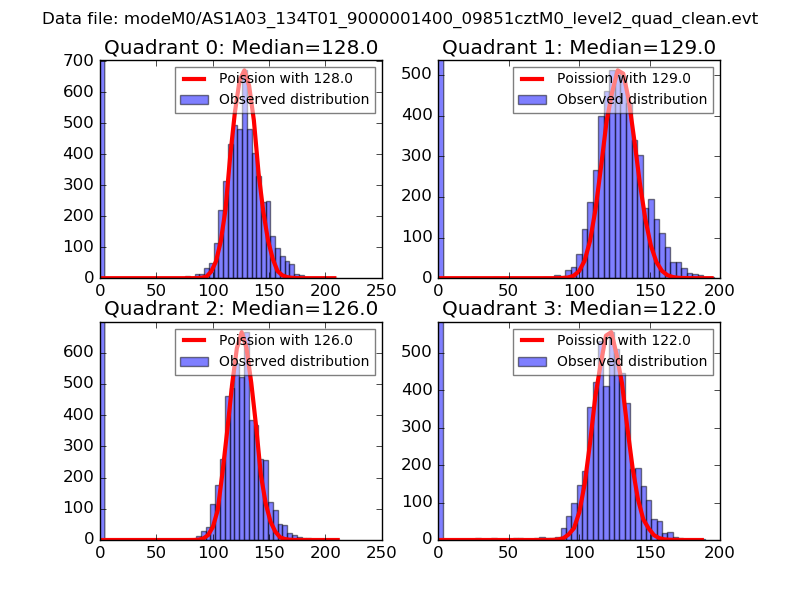 |
 |
| Quadrant-wise count rates Data is divided into 100 sec bins |
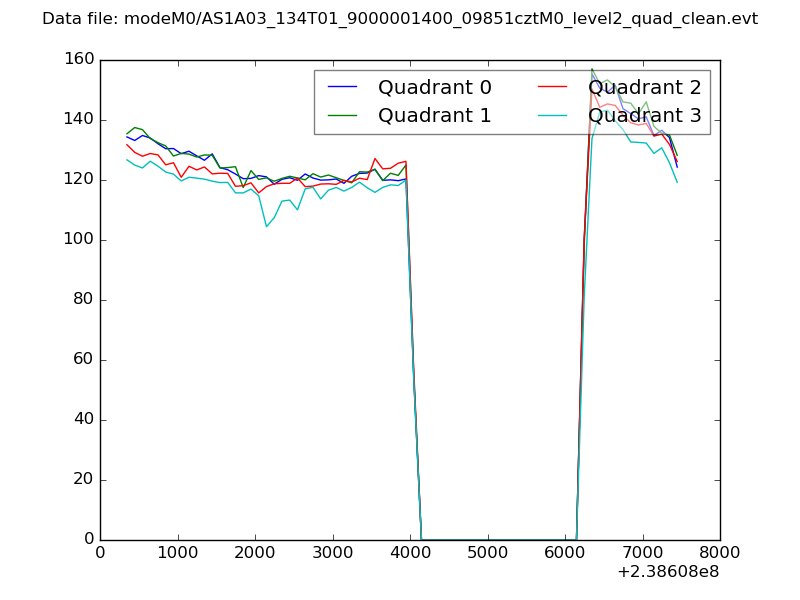 |
|
| Module-wise count rates for Quadrant A Data is divided into 100 sec bins |
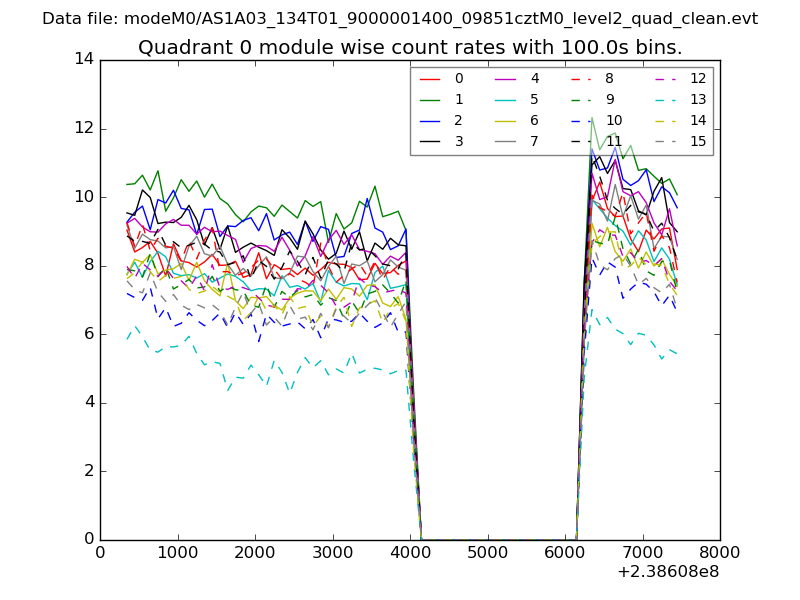 |
 |
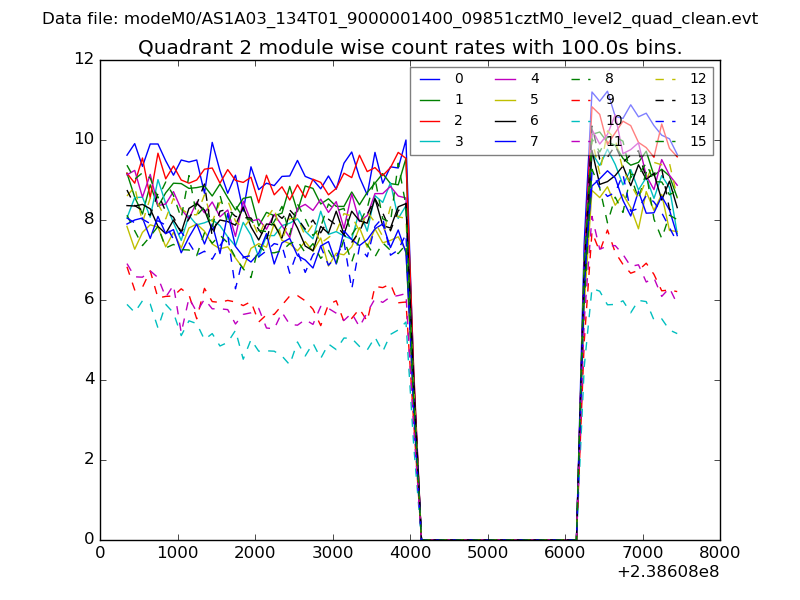
| Module-wise count rates for Quadrant B Data is divided into 100 sec bins |
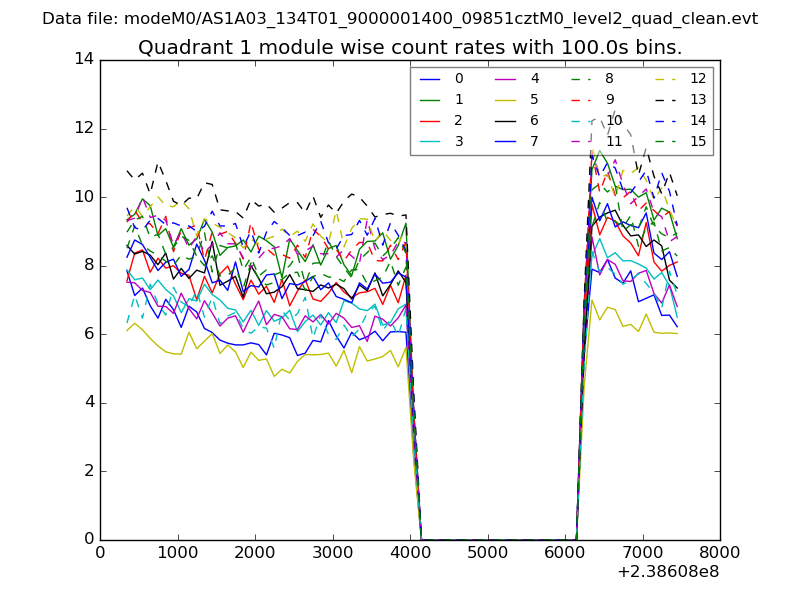 |
 |
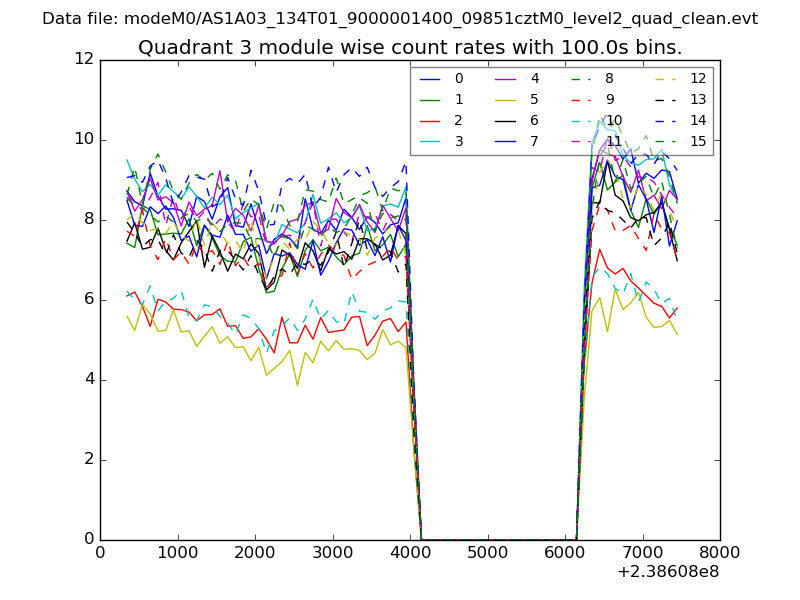
| Module-wise count rates for Quadrant C Data is divided into 100 sec bins |
 |
 |
| Module-wise count rates for Quadrant D Data is divided into 100 sec bins |
 |
 |
| Parameter | Plot |
|---|---|
| CZT HV Monitor | 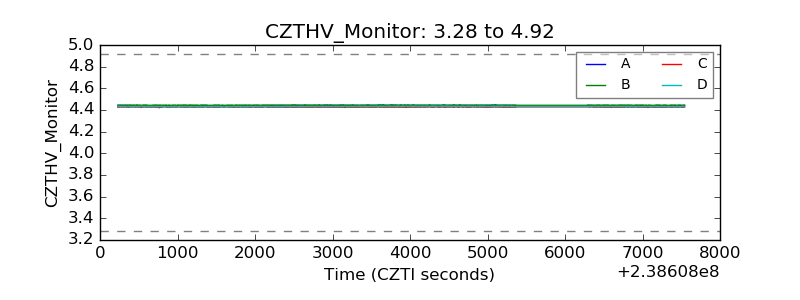 |
| D_VDD | 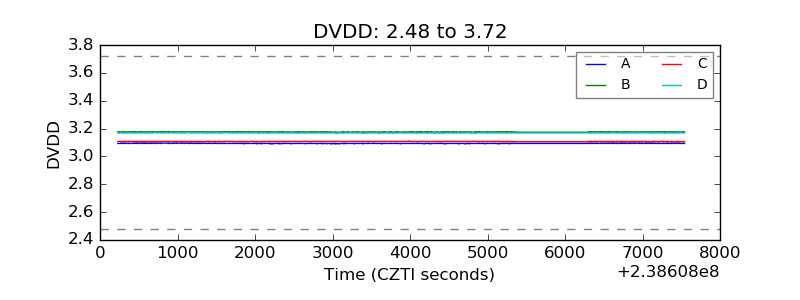 |
| Temperature 1 | 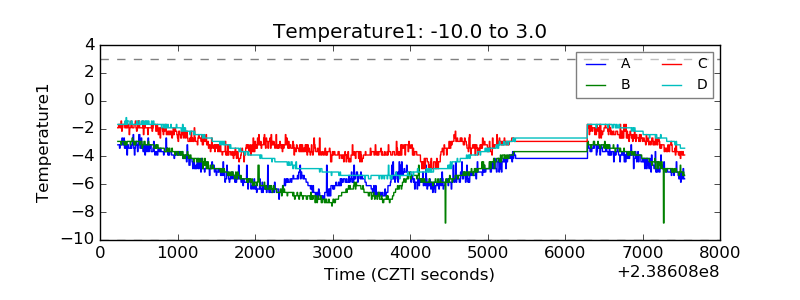 |
| Veto HV Monitor | 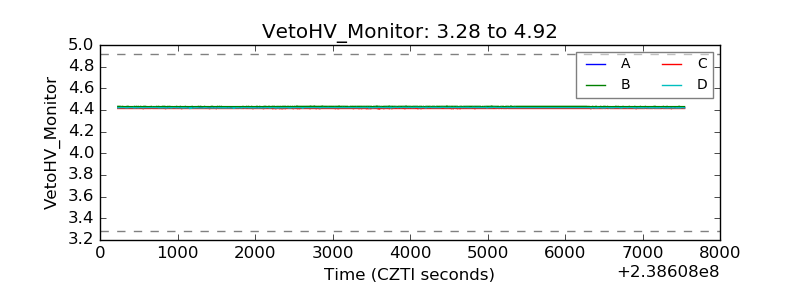 |
| Veto LLD | 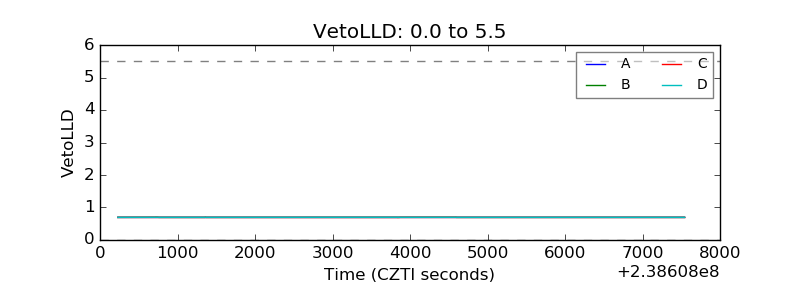 |
| Alpha Counter | 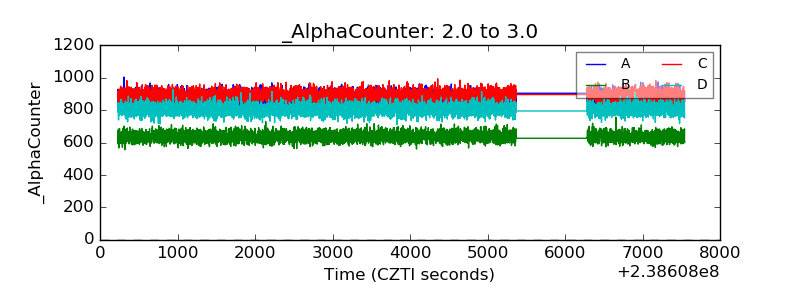 |
| _CPM_Rate | 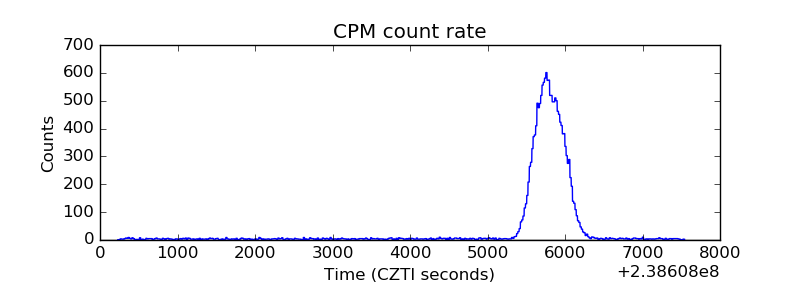 |
| CZT Counter | 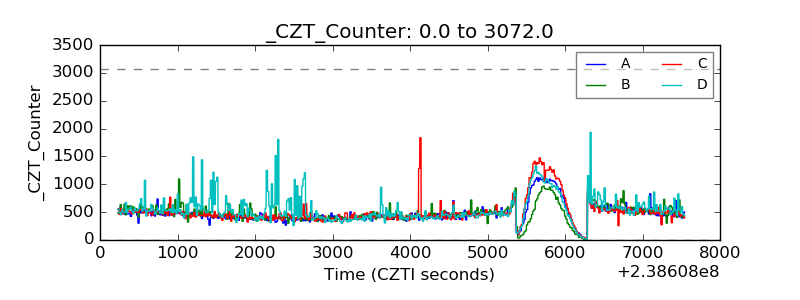 |
| +2.5 Volts monitor |  |
| +5 Volts monitor |  |
| _ROLL_ROT | 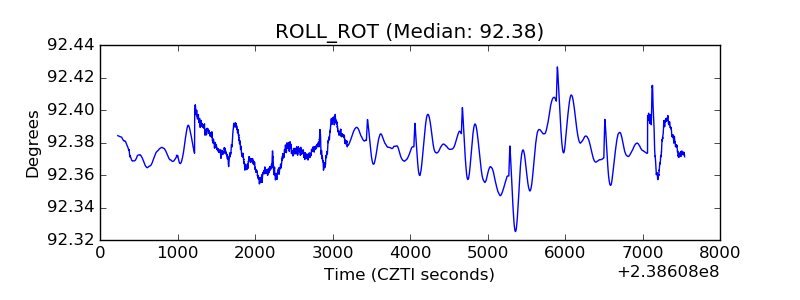 |
| _Roll_DEC | 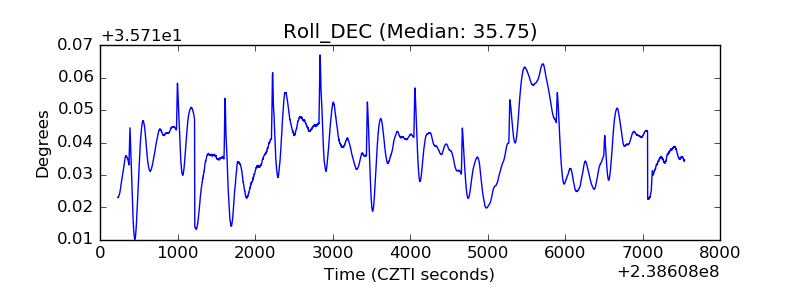 |
| _Roll_RA | 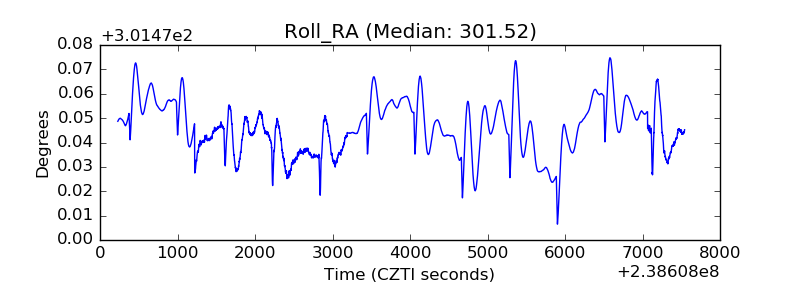 |
| Veto Counter | 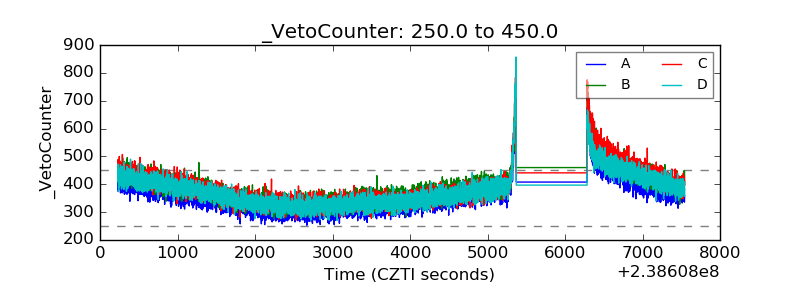 |