| Param | Original file | Final file |
|---|---|---|
| Filename | modeM0/AS1A03_134T01_9000001400_09852cztM0_level2.evt | modeM0/AS1A03_134T01_9000001400_09852cztM0_level2_quad_clean.evt |
| Size (bytes) | 172,759,680 | 49,334,400 |
| Size | 164.8 MB | 47.0 MB |
| Events in quadrant A | 1,140,111 | 333,416 |
| Events in quadrant B | 1,261,155 | 338,139 |
| Events in quadrant C | 1,162,540 | 329,013 |
| Events in quadrant D | 1,496,660 | 314,278 |
| Mode M0 | |||
|---|---|---|---|
| Quadrant | BADHDUFLAG | Total packets | Discarded packets |
| A | 0 | 5177 | 20 |
| B | 0 | 5498 | 15 |
| C | 0 | 5150 | 17 |
| D | 0 | 6154 | 30 |
| Mode SS | |||
|---|---|---|---|
| Quadrant | BADHDUFLAG | Total packets | Discarded packets |
| A | 0 | 50 | 0 |
| B | 0 | 50 | 0 |
| C | 0 | 50 | 0 |
| D | 0 | 50 | 0 |
| Mode M9 | |||
|---|---|---|---|
| Quadrant | BADHDUFLAG | Total packets | Discarded packets |
| A | 1 | 273359709408 | 0 |
| B | 1 | -1 | -1 |
| C | 1 | -1 | -1 |
| D | 1 | -1 | -1 |
| Quadrant | Total seconds | Saturated seconds | Saturation percentage |
|---|---|---|---|
| A | 2490 | 8 | 0.321285% |
| B | 2493 | 24 | 0.962696% |
| C | 2491 | 2 | 0.080289% |
| D | 2487 | 38 | 1.527945% |
Noise dominated data is calculated using 1-second bins in cleaned event files. If a bin has >2000 counts, and if more than 50% of those come from <1% of pixels, then it is considered to be noise-dominated and hence unusable.
| Quadrant | # 1 sec bins | Bins with >0 counts | Bins with >2000 counts | High rate bins dominated by noise | Noise dominated (total time) | Noise dominated (detector-on time) | Marked lightcurve |
|---|---|---|---|---|---|---|---|
| A | 2499 | 2499 | 0 | 0 | 0.00% | 0.00% | 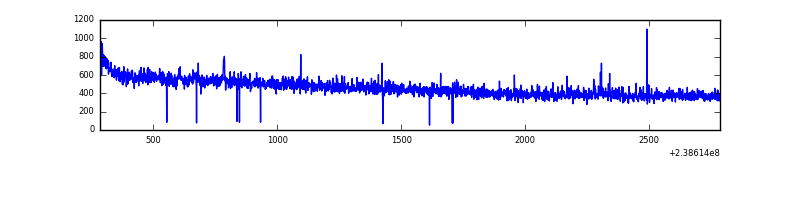 |
| B | 2499 | 2499 | 3 | 3 | 0.12% | 0.12% | 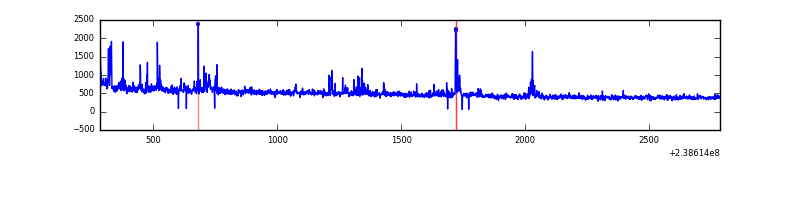 |
| C | 2499 | 2498 | 1 | 1 | 0.04% | 0.04% | 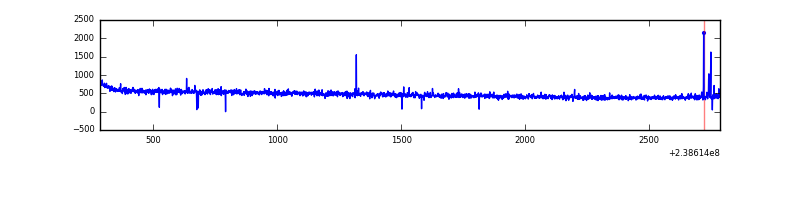 |
| D | 2499 | 2499 | 30 | 30 | 1.20% | 1.20% | 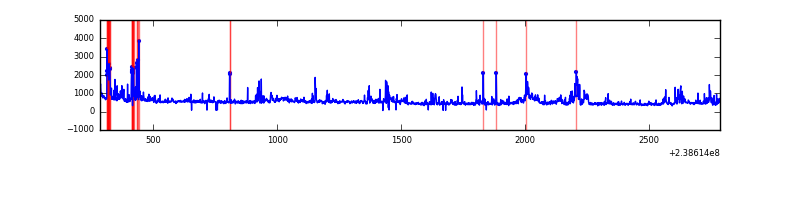 |
Top three noisy pixels from each quadrant. If the there are fewer than three noisy pixels in the level2.evt file, extra rows are filled as -1
| Pixel properties | Quadrant properties | ||||||
|---|---|---|---|---|---|---|---|
| Quadrant | DetID | PixID | Counts | Sigma | Mean | Median | Sigma |
| A | 13 | 248 | 2918 | 42.66 | 294 | 289 | 61.6 |
| A | 0 | 226 | 2601 | 37.52 | 294 | 289 | 61.6 |
| A | 12 | 194 | 2374 | 33.83 | 294 | 289 | 61.6 |
| B | 4 | 81 | 53698 | 930.01 | 297 | 290 | 57.4 |
| B | 0 | 214 | 33346 | 575.62 | 297 | 290 | 57.4 |
| B | 0 | 230 | 11442 | 194.19 | 297 | 290 | 57.4 |
| C | 0 | 207 | 11613 | 163.85 | 293 | 296 | 69.1 |
| C | 4 | 254 | 6027 | 82.98 | 293 | 296 | 69.1 |
| C | 13 | 61 | 2149 | 26.83 | 293 | 296 | 69.1 |
| D | 1 | 52 | 259450 | 3598.57 | 287 | 280 | 72.0 |
| D | 12 | 233 | 80449 | 1113.15 | 287 | 280 | 72.0 |
| D | 8 | 195 | 27571 | 378.94 | 287 | 280 | 72.0 |
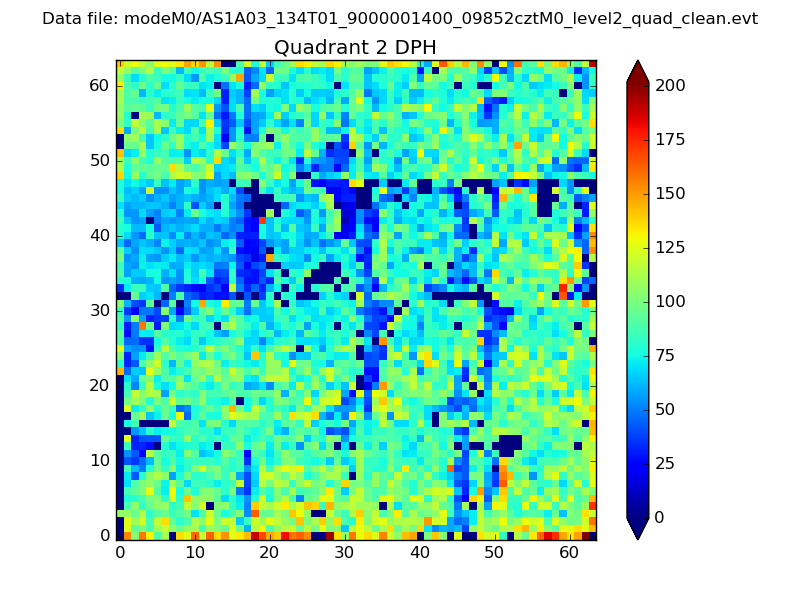
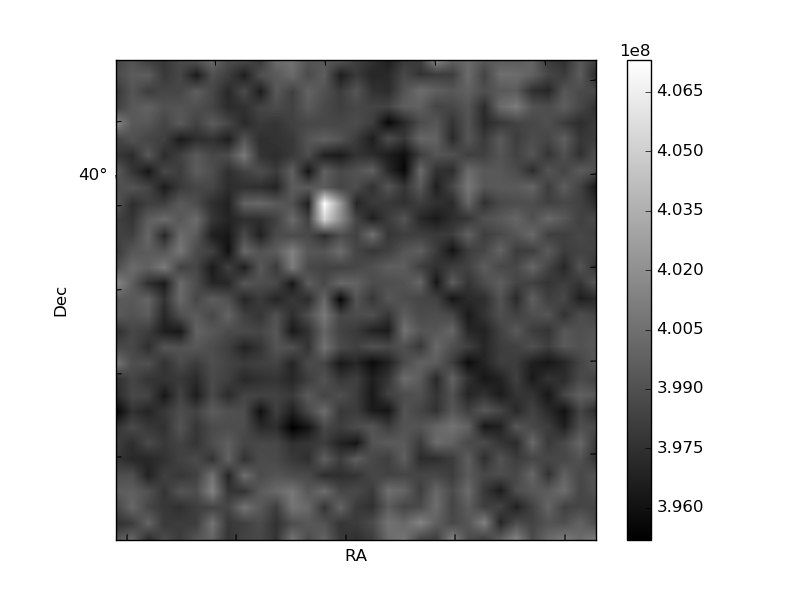
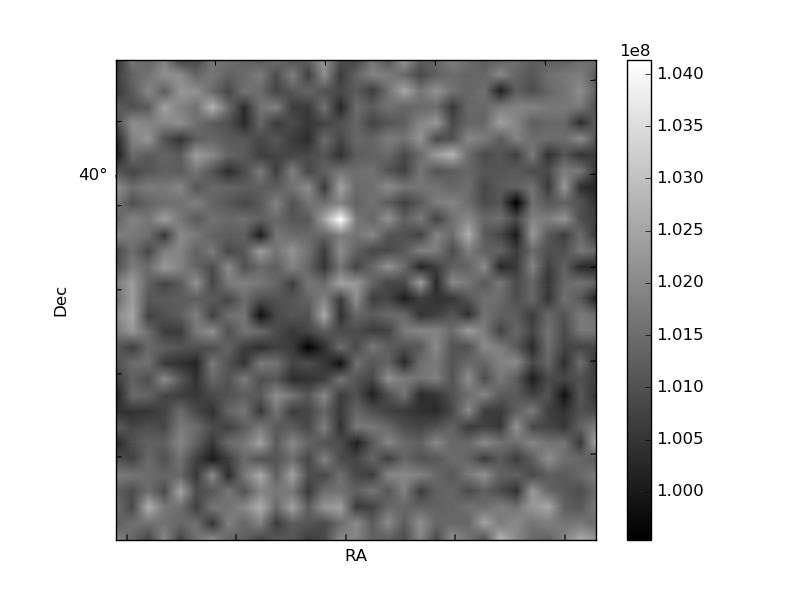
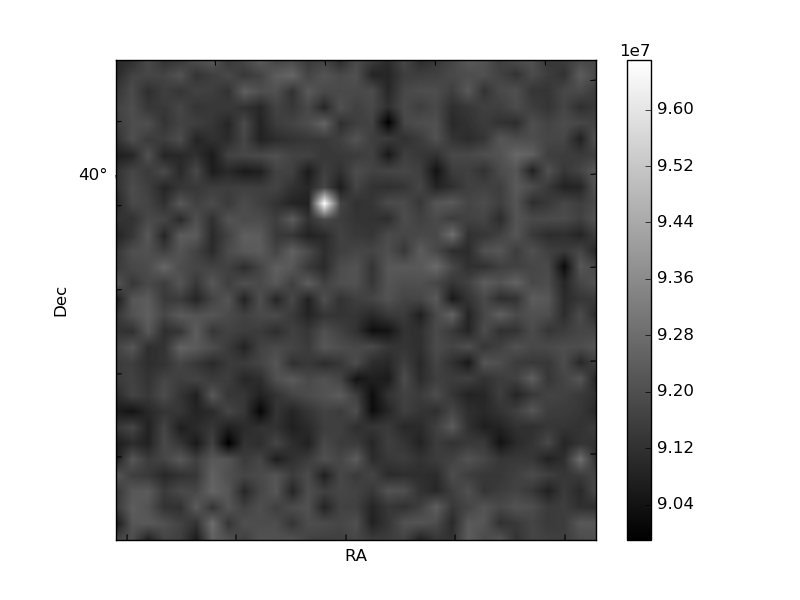
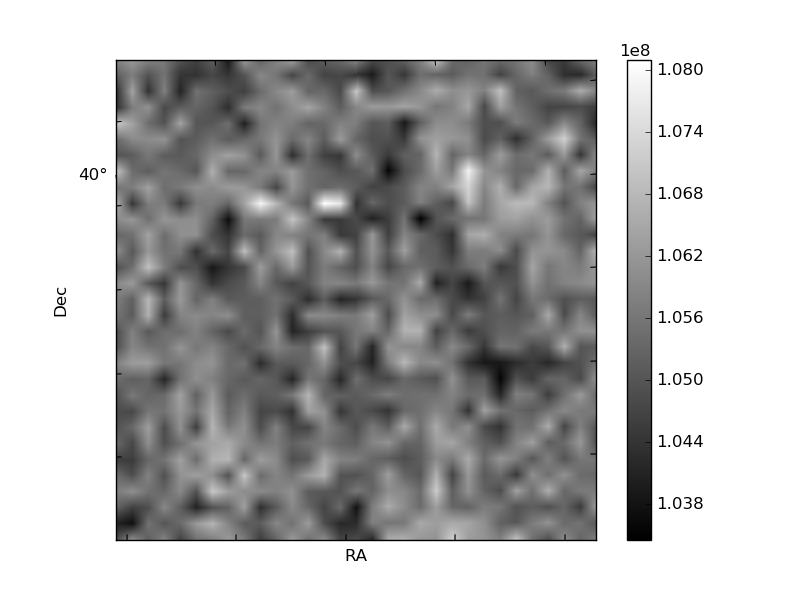
Histogram calculated using DETX and DETY for each event in the final _common_clean file
| Quadrant A | 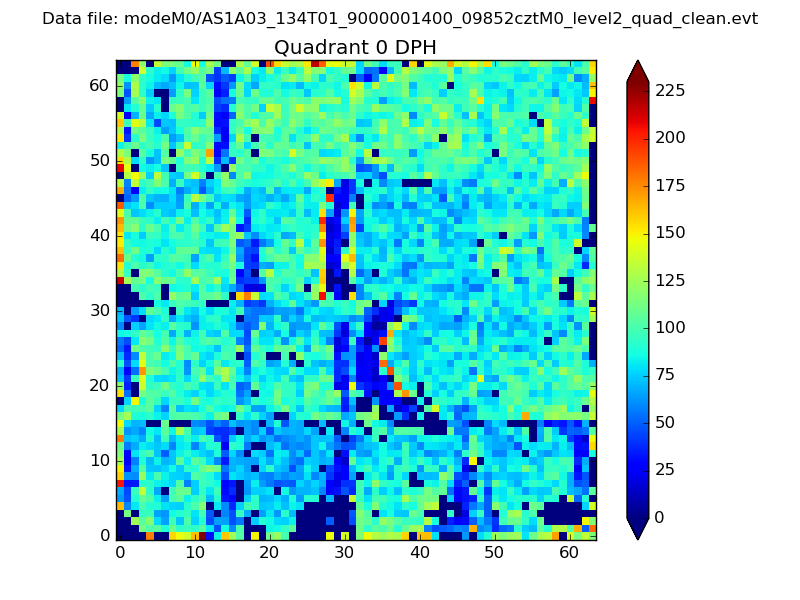 |
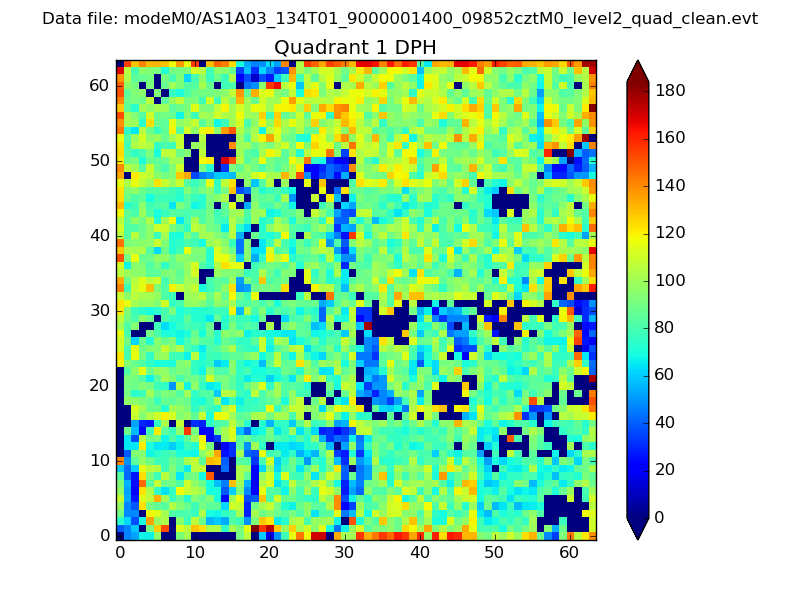 |
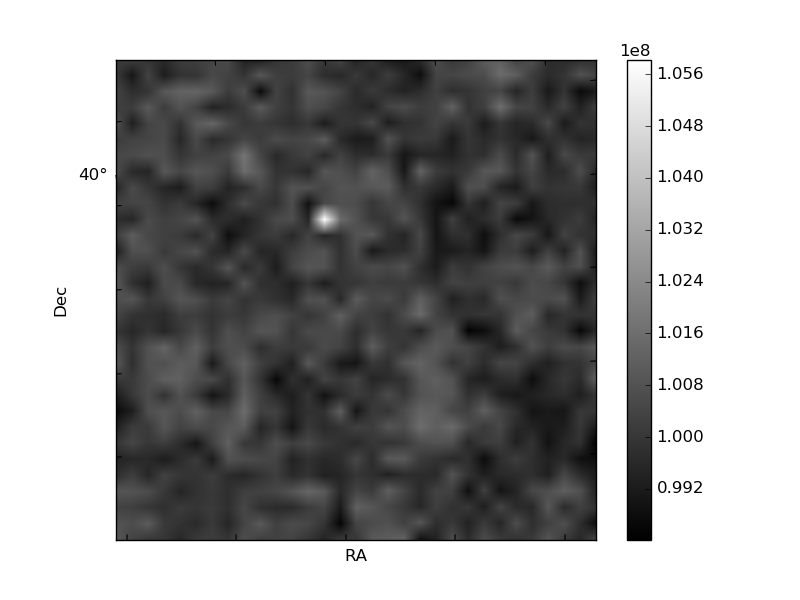
Quadrant B |
|---|---|---|---|
| Quadrant D | 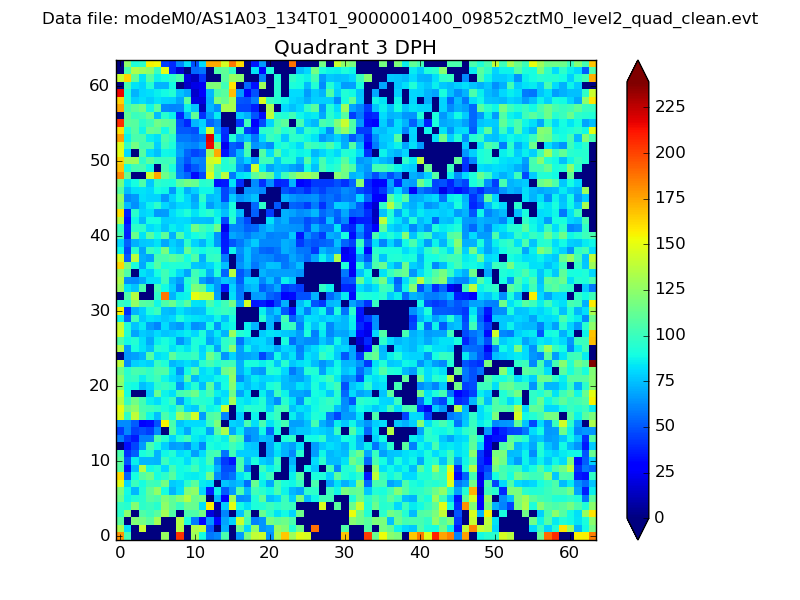 |
 |
Quadrant C |
| Plot type | Count rate plots | Images |
|---|---|---|
| Comparison with Poisson distribution Blue bars denote a histogram of data divided into 1 sec bins. Red curve is a Poisson curve with rate = median count rate of data. |
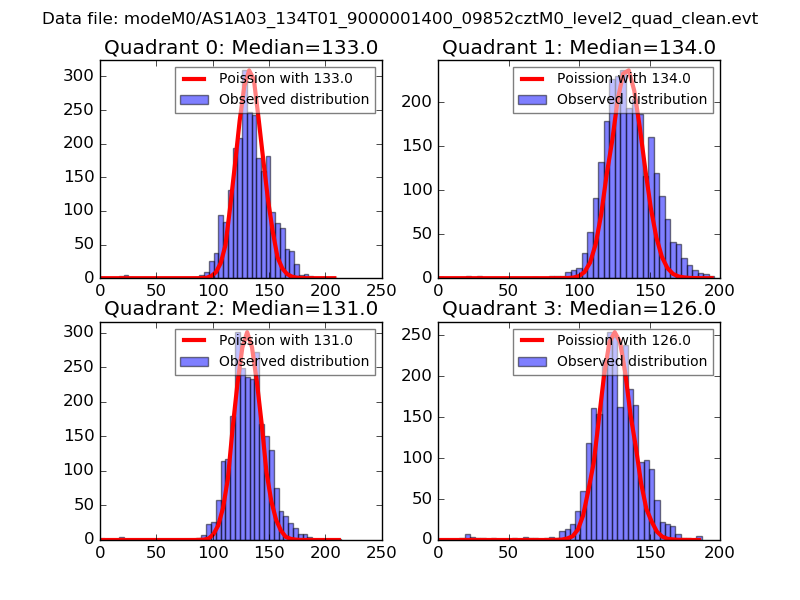 |
 |
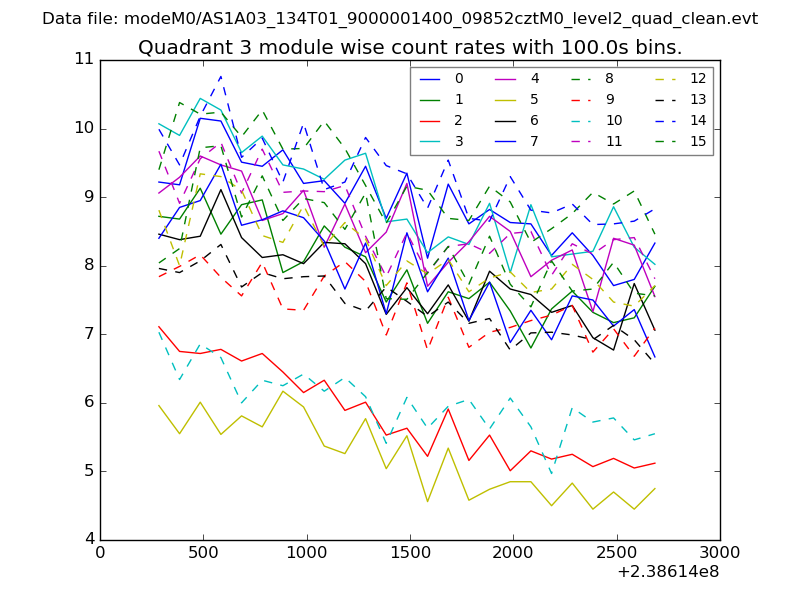
| Quadrant-wise count rates Data is divided into 100 sec bins |
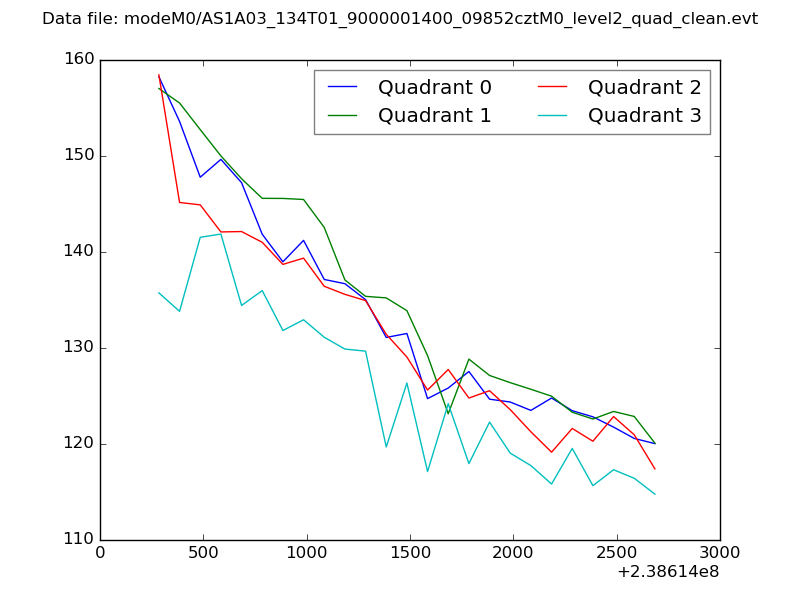 |
|
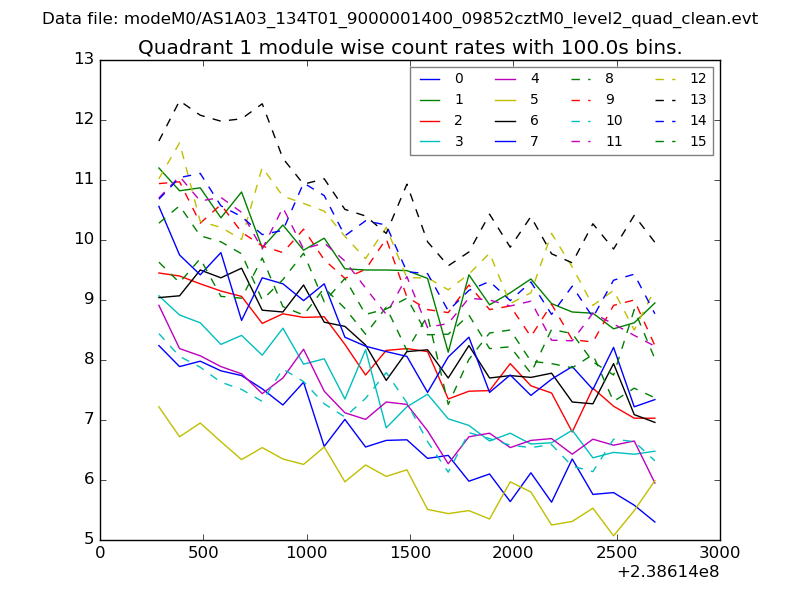
| Module-wise count rates for Quadrant A Data is divided into 100 sec bins |
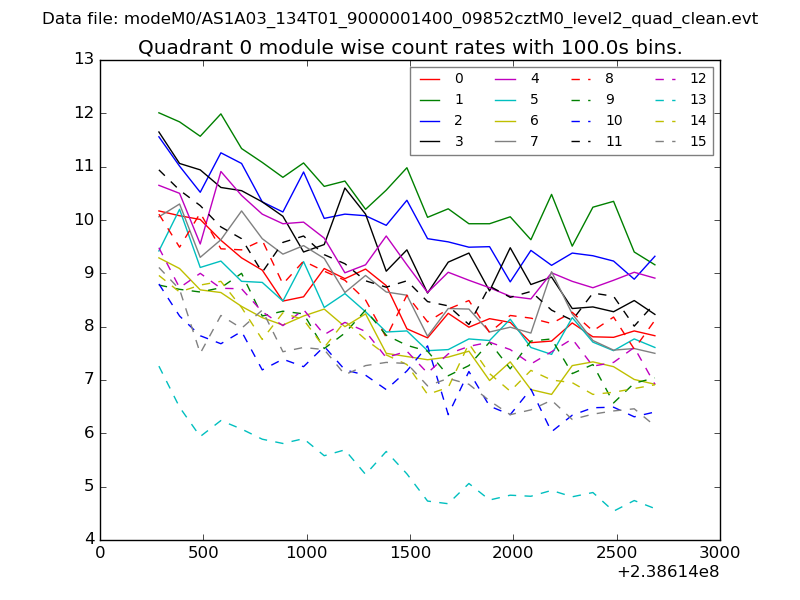 |
 |
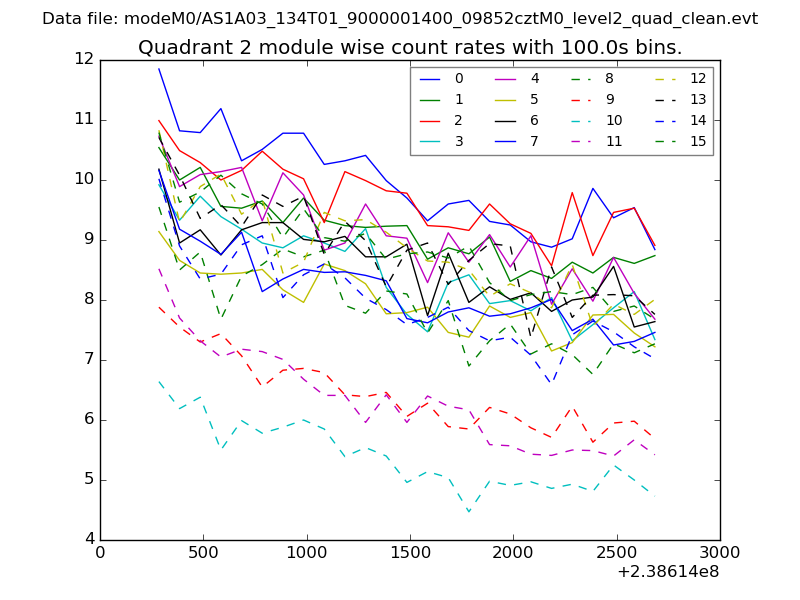
| Module-wise count rates for Quadrant B Data is divided into 100 sec bins |
 |
 |
| Module-wise count rates for Quadrant C Data is divided into 100 sec bins |
 |
 |
| Module-wise count rates for Quadrant D Data is divided into 100 sec bins |
 |
 |
| Parameter | Plot |
|---|---|
| CZT HV Monitor | 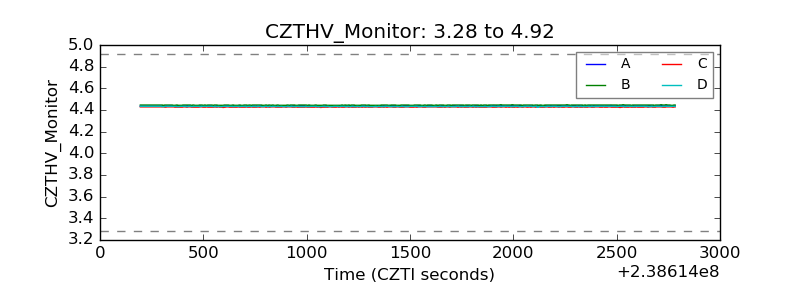 |
| D_VDD | 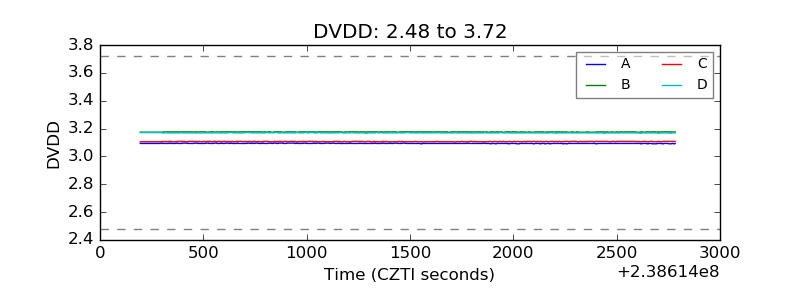 |
| Temperature 1 | 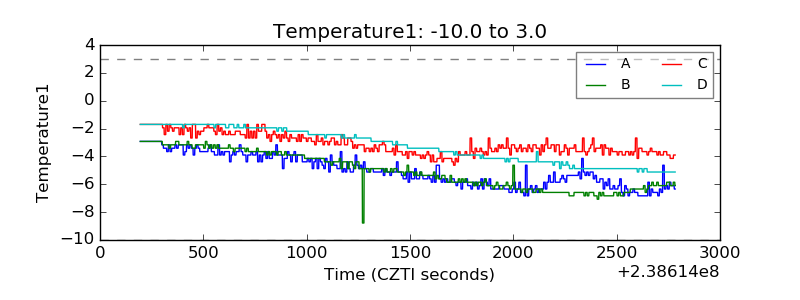 |
| Veto HV Monitor | 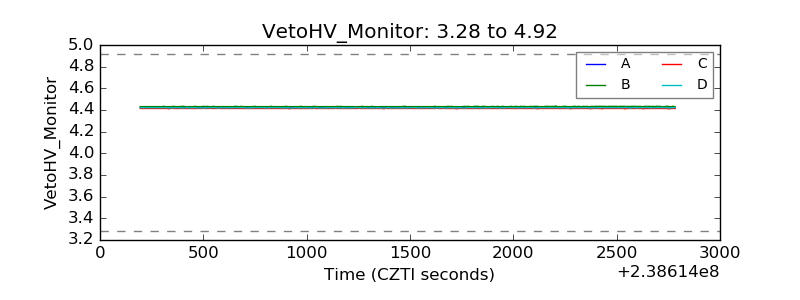 |
| Veto LLD | 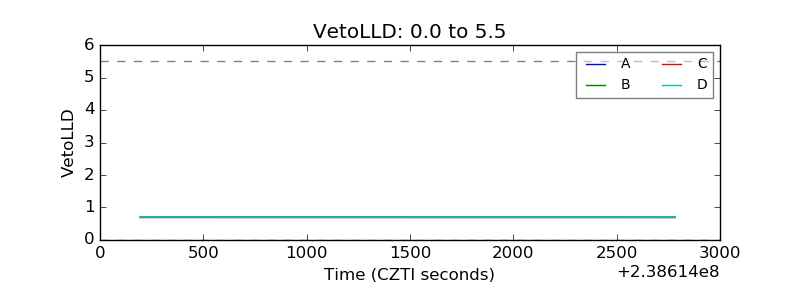 |
| Alpha Counter | 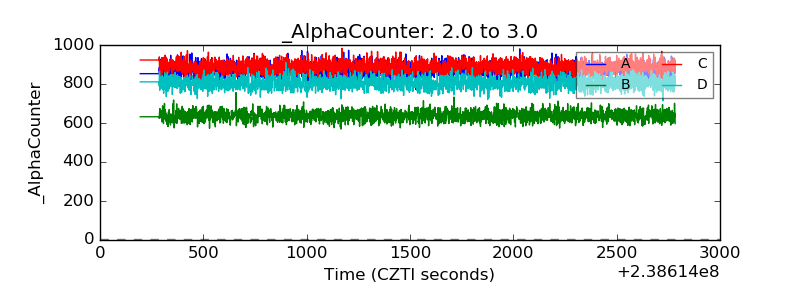 |
| _CPM_Rate | 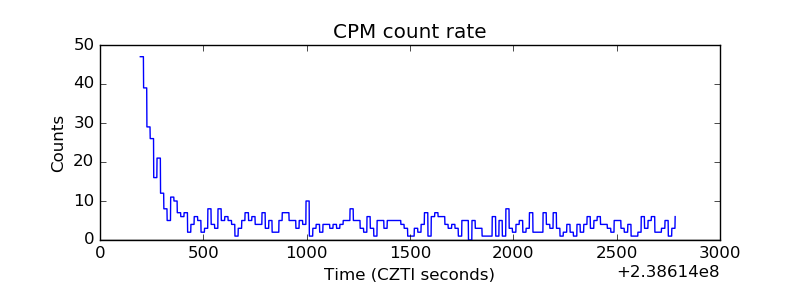 |
| CZT Counter | 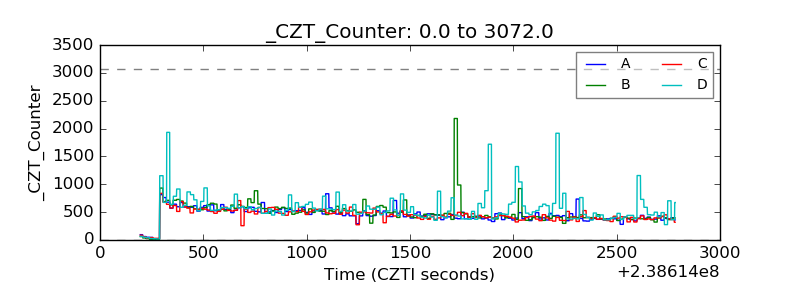 |
| +2.5 Volts monitor |  |
| +5 Volts monitor |  |
| _ROLL_ROT | 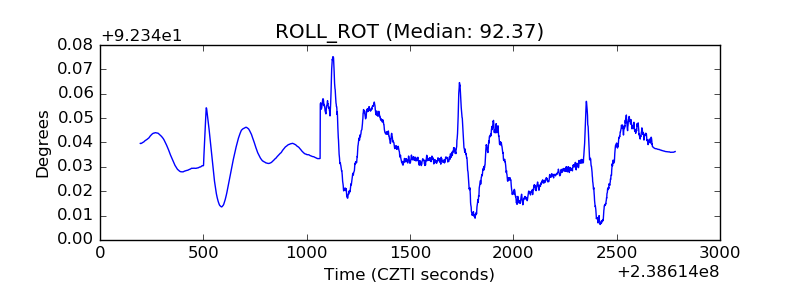 |
| _Roll_DEC | 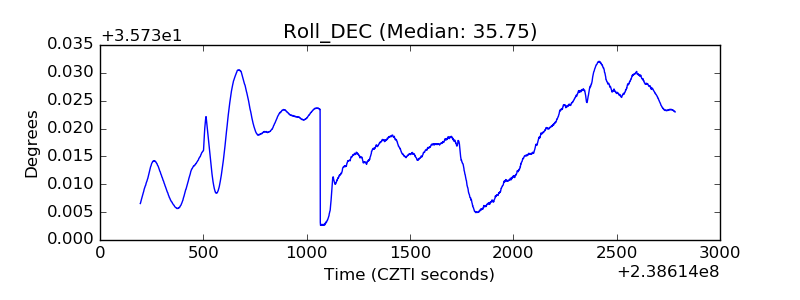 |
| _Roll_RA | 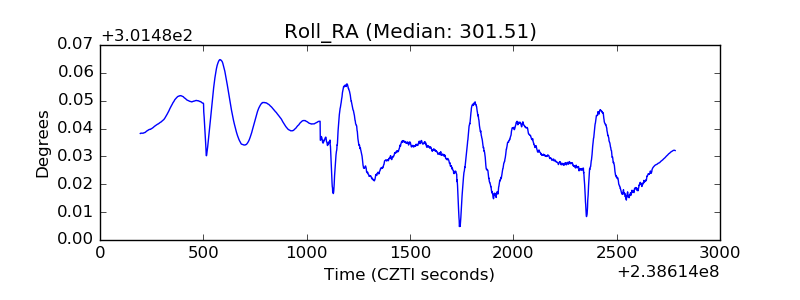 |
| Veto Counter | 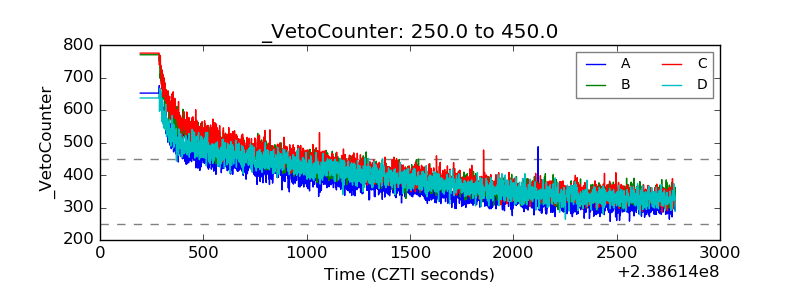 |