| Param | Original file | Final file |
|---|---|---|
| Filename | modeM0/AS1A03_117T06_9000001404cztM0_level2.fits | modeM0/AS1A03_117T06_9000001404cztM0_level2_quad_clean.evt |
| Size (bytes) | 36,201,600 | 23,944,320 |
| Size | 34.5 MB | 22.8 MB |
| Events in quadrant A | 214,092 | 118,490 |
| Events in quadrant B | 210,952 | 121,446 |
| Events in quadrant C | 212,542 | 110,400 |
| Events in quadrant D | 187,142 | 102,383 |
| Mode M9 | |||
|---|---|---|---|
| Quadrant | BADHDUFLAG | Total packets | Discarded packets |
| A | 0 | 282 | 0 |
| B | 0 | 282 | 0 |
| C | 0 | 278 | 0 |
| D | 0 | 280 | 0 |
| Mode M0 | |||
|---|---|---|---|
| Quadrant | BADHDUFLAG | Total packets | Discarded packets |
| A | 0 | 8322 | 0 |
| B | 0 | 8318 | 0 |
| C | 0 | 8361 | 0 |
| D | 0 | 8348 | 0 |
| Mode SS | |||
|---|---|---|---|
| Quadrant | BADHDUFLAG | Total packets | Discarded packets |
| A | 0 | 80 | 0 |
| B | 0 | 80 | 0 |
| C | 0 | 78 | 0 |
| D | 0 | 80 | 0 |
| Quadrant | Total seconds | Saturated seconds | Saturation percentage |
|---|---|---|---|
| A | 3825 | 244 | 6.379085% |
| B | 3848 | 247 | 6.418919% |
| C | 3830 | 151 | 3.942559% |
| D | 3824 | 169 | 4.419456% |
Noise dominated data is calculated using 1-second bins in cleaned event files. If a bin has >2000 counts, and if more than 50% of those come from <1% of pixels, then it is considered to be noise-dominated and hence unusable.
| Quadrant | # 1 sec bins | Bins with >0 counts | Bins with >2000 counts | High rate bins dominated by noise | Noise dominated (total time) | Noise dominated (detector-on time) | Marked lightcurve |
|---|---|---|---|---|---|---|---|
| A | 3927 | 3909 | 0 | 0 | 0.00% | 0.00% |  |
| B | 3927 | 3911 | 0 | 0 | 0.00% | 0.00% |  |
| C | 3927 | 3902 | 0 | 0 | 0.00% | 0.00% |  |
| D | 3927 | 3899 | 0 | 0 | 0.00% | 0.00% |  |
Top three noisy pixels from each quadrant. If the there are fewer than three noisy pixels in the level2.evt file, extra rows are filled as -1
| Pixel properties | Quadrant properties | ||||||
|---|---|---|---|---|---|---|---|
| Quadrant | DetID | PixID | Counts | Sigma | Mean | Median | Sigma |
| A | 7 | 110 | 197 | 8.79 | 55 | 52 | 16.5 |
| A | 0 | 29 | 192 | 8.49 | 55 | 52 | 16.5 |
| A | 14 | 188 | 192 | 8.49 | 55 | 52 | 16.5 |
| B | 2 | 9 | 174 | 8.84 | 55 | 52 | 13.8 |
| B | 12 | 226 | 168 | 8.41 | 55 | 52 | 13.8 |
| B | 10 | 225 | 150 | 7.1 | 55 | 52 | 13.8 |
| C | 9 | 233 | 165 | 6.77 | 56 | 52 | 16.7 |
| C | 3 | 158 | 163 | 6.65 | 56 | 52 | 16.7 |
| C | 12 | 16 | 153 | 6.05 | 56 | 52 | 16.7 |
| D | 1 | 31 | 136 | 5.41 | 53 | 47 | 16.4 |
| D | 15 | 225 | 133 | 5.23 | 53 | 47 | 16.4 |
| D | 3 | 30 | 132 | 5.17 | 53 | 47 | 16.4 |
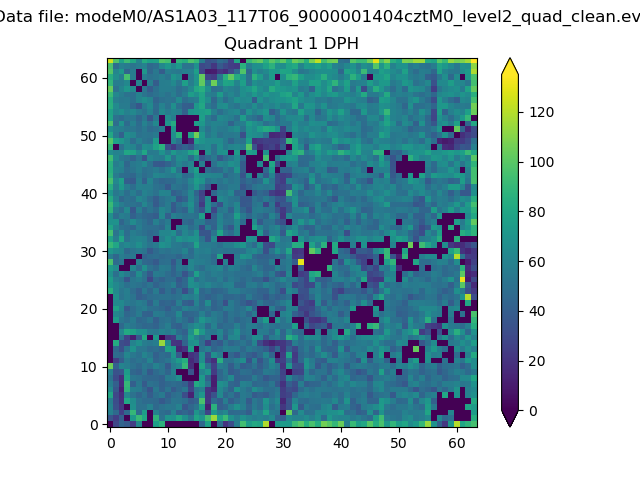
Histogram calculated using DETX and DETY for each event in the final _common_clean file
| Quadrant A |  |
 |
Quadrant B |
|---|---|---|---|
| Quadrant D | 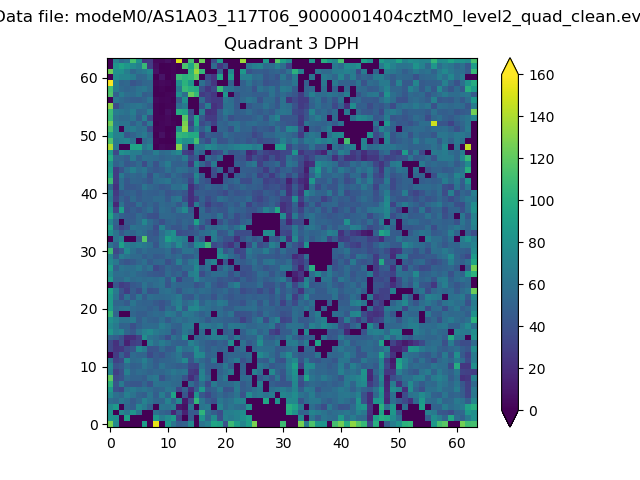 |
 |
Quadrant C |
| Plot type | Count rate plots | Images |
|---|---|---|
| Comparison with Poisson distribution Blue bars denote a histogram of data divided into 1 sec bins. Red curve is a Poisson curve with rate = median count rate of data. |
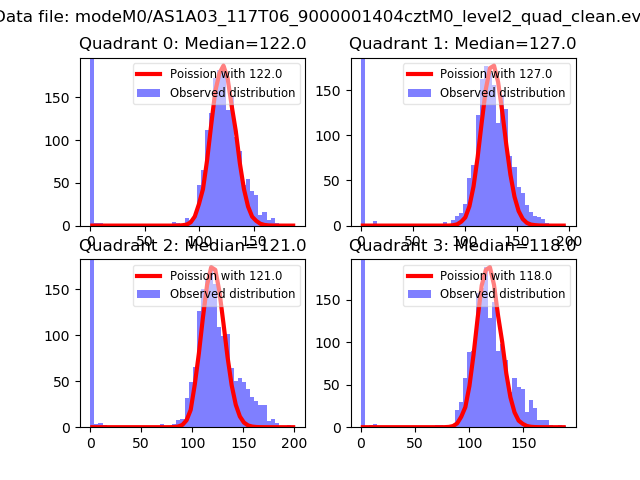 |
 |
| Quadrant-wise count rates Data is divided into 100 sec bins |
 |
|
| Module-wise count rates for Quadrant A Data is divided into 100 sec bins |
 |
 |
| Module-wise count rates for Quadrant B Data is divided into 100 sec bins |
 |
 |
| Module-wise count rates for Quadrant C Data is divided into 100 sec bins |
 |
 |
| Module-wise count rates for Quadrant D Data is divided into 100 sec bins |
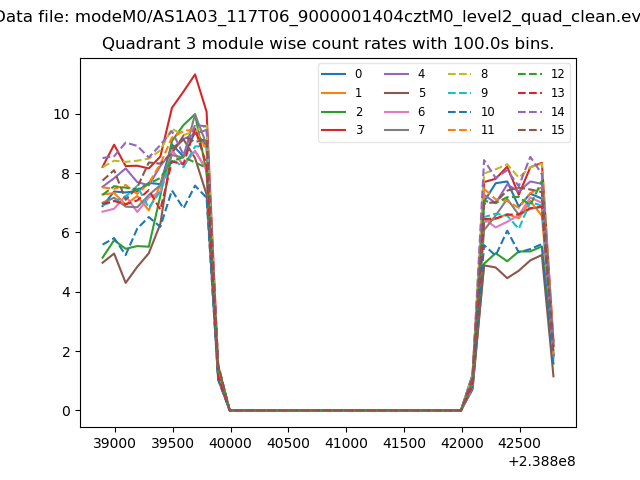 |
 |
| Parameter | Plot |
|---|---|
| CZT HV Monitor |  |
| D_VDD | 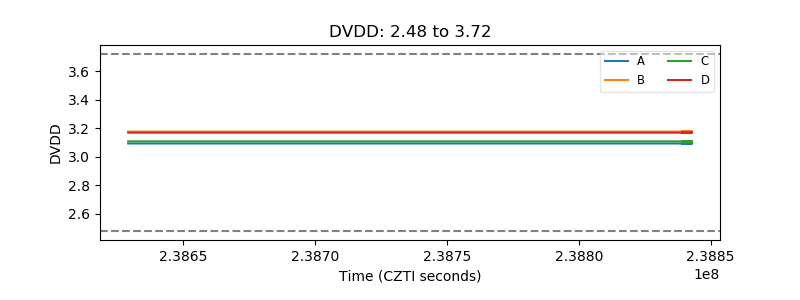 |
| Temperature 1 |  |
| Veto HV Monitor |  |
| Veto LLD |  |
| Alpha Counter |  |
| _CPM_Rate |  |
| CZT Counter | 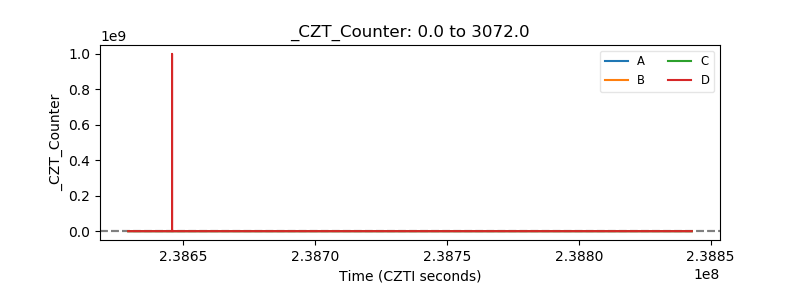 |
| +2.5 Volts monitor |  |
| +5 Volts monitor |  |
| _ROLL_ROT | 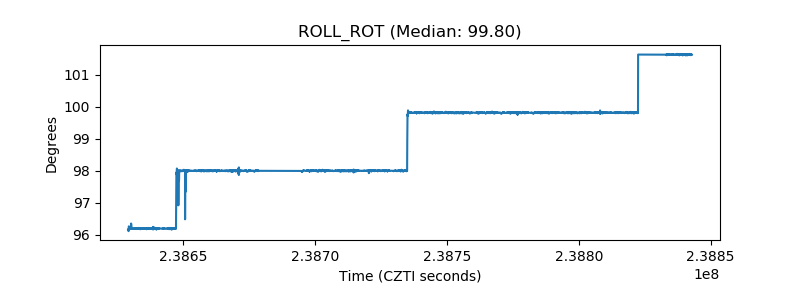 |
| _Roll_DEC |  |
| _Roll_RA | 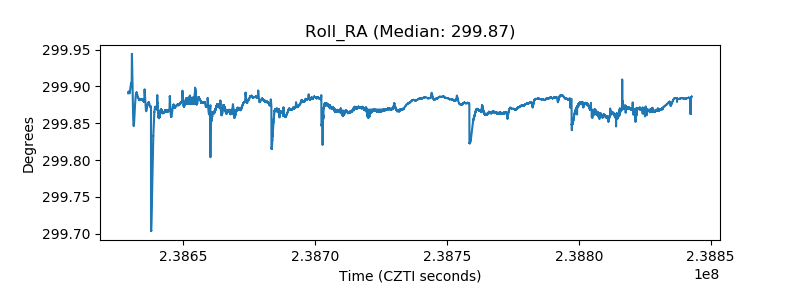 |
| Veto Counter | 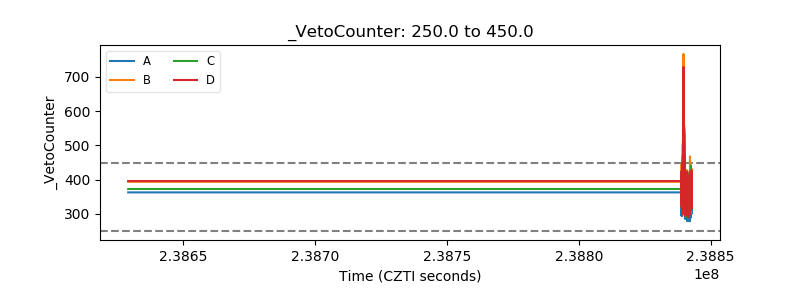 |