| Param | Original file | Final file |
|---|---|---|
| Filename | modeM0/AS1A03_117T06_9000001404_09855cztM0_level2.evt | modeM0/AS1A03_117T06_9000001404_09855cztM0_level2_quad_clean.evt |
| Size (bytes) | 291,461,760 | 44,807,040 |
| Size | 278.0 MB | 42.7 MB |
| Events in quadrant A | 1,994,119 | 267,729 |
| Events in quadrant B | 2,038,395 | 279,738 |
| Events in quadrant C | 2,434,428 | 267,385 |
| Events in quadrant D | 2,080,537 | 253,052 |
| Mode M9 | |||
|---|---|---|---|
| Quadrant | BADHDUFLAG | Total packets | Discarded packets |
| A | 0 | 12 | 0 |
| B | 0 | 12 | 0 |
| C | 0 | 12 | 0 |
| D | 0 | 12 | 0 |
| Mode M0 | |||
|---|---|---|---|
| Quadrant | BADHDUFLAG | Total packets | Discarded packets |
| A | 0 | 8588 | 27 |
| B | 0 | 8677 | 28 |
| C | 0 | 9984 | 44 |
| D | 0 | 9089 | 25 |
| Mode SS | |||
|---|---|---|---|
| Quadrant | BADHDUFLAG | Total packets | Discarded packets |
| A | 0 | 84 | 0 |
| B | 0 | 84 | 0 |
| C | 0 | 84 | 0 |
| D | 0 | 84 | 0 |
| Quadrant | Total seconds | Saturated seconds | Saturation percentage |
|---|---|---|---|
| A | 4092 | 57 | 1.392962% |
| B | 4092 | 57 | 1.392962% |
| C | 4088 | 129 | 3.155577% |
| D | 4093 | 64 | 1.563645% |
Noise dominated data is calculated using 1-second bins in cleaned event files. If a bin has >2000 counts, and if more than 50% of those come from <1% of pixels, then it is considered to be noise-dominated and hence unusable.
| Quadrant | # 1 sec bins | Bins with >0 counts | Bins with >2000 counts | High rate bins dominated by noise | Noise dominated (total time) | Noise dominated (detector-on time) | Marked lightcurve |
|---|---|---|---|---|---|---|---|
| A | 5345 | 4104 | 0 | 0 | 0.00% | 0.00% | 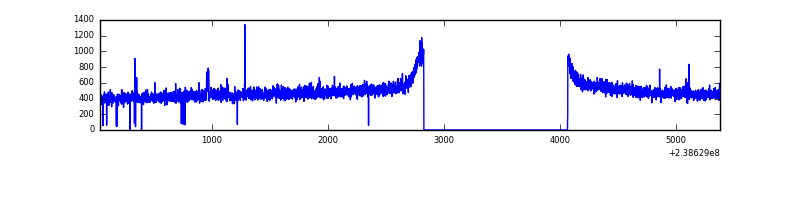 |
| B | 5345 | 4106 | 1 | 1 | 0.02% | 0.02% | 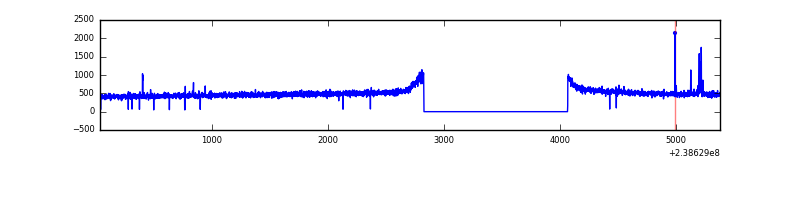 |
| C | 5345 | 4106 | 62 | 62 | 1.16% | 1.51% | 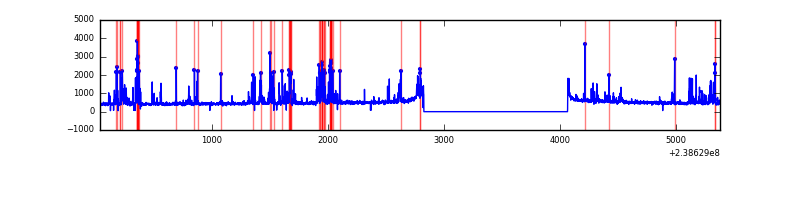 |
| D | 5345 | 4106 | 22 | 22 | 0.41% | 0.54% |  |
Top three noisy pixels from each quadrant. If the there are fewer than three noisy pixels in the level2.evt file, extra rows are filled as -1
| Pixel properties | Quadrant properties | ||||||
|---|---|---|---|---|---|---|---|
| Quadrant | DetID | PixID | Counts | Sigma | Mean | Median | Sigma |
| A | 4 | 2 | 6521 | 57.16 | 513 | 503 | 105.3 |
| A | 1 | 162 | 5465 | 47.13 | 513 | 503 | 105.3 |
| A | 0 | 226 | 4703 | 39.9 | 513 | 503 | 105.3 |
| B | 4 | 81 | 21142 | 207.48 | 518 | 506 | 99.5 |
| B | 12 | 111 | 11513 | 110.67 | 518 | 506 | 99.5 |
| B | 11 | 111 | 9435 | 89.77 | 518 | 506 | 99.5 |
| C | 4 | 254 | 487661 | 4217.41 | 496 | 500 | 115.5 |
| C | 14 | 234 | 5290 | 41.47 | 496 | 500 | 115.5 |
| C | 13 | 61 | 3761 | 28.23 | 496 | 500 | 115.5 |
| D | 12 | 233 | 103488 | 801.77 | 492 | 481 | 128.5 |
| D | 1 | 52 | 73964 | 571.96 | 492 | 481 | 128.5 |
| D | 2 | 234 | 12798 | 95.87 | 492 | 481 | 128.5 |
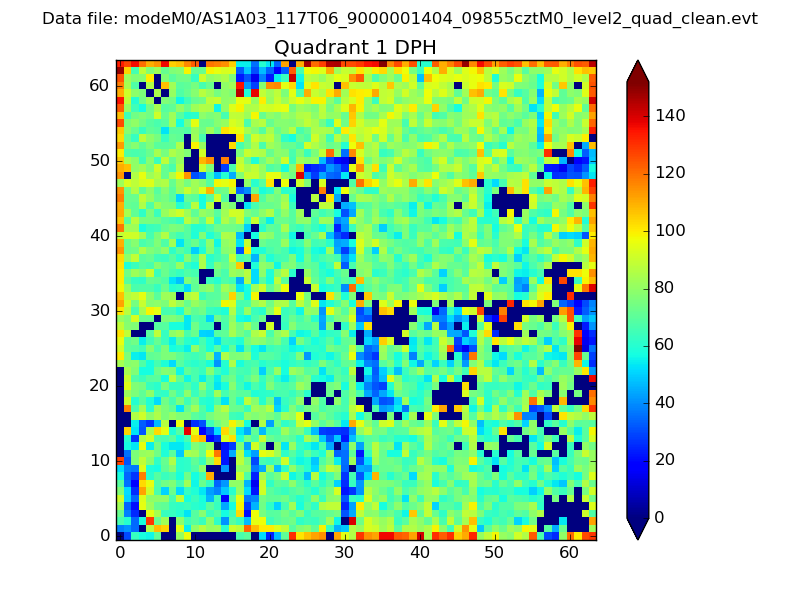
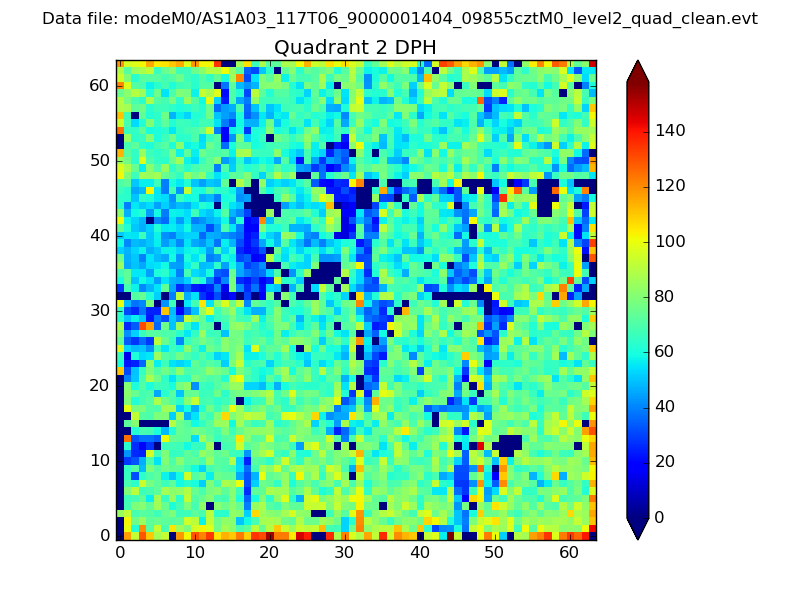
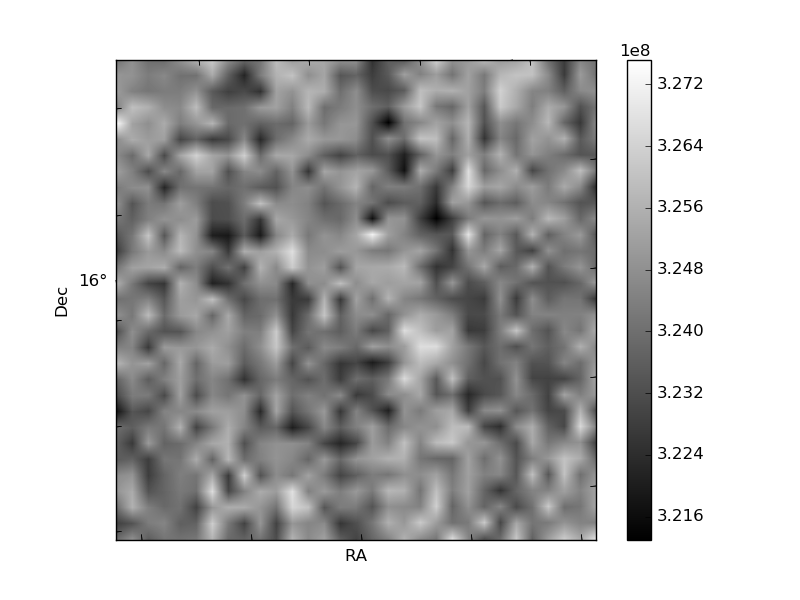
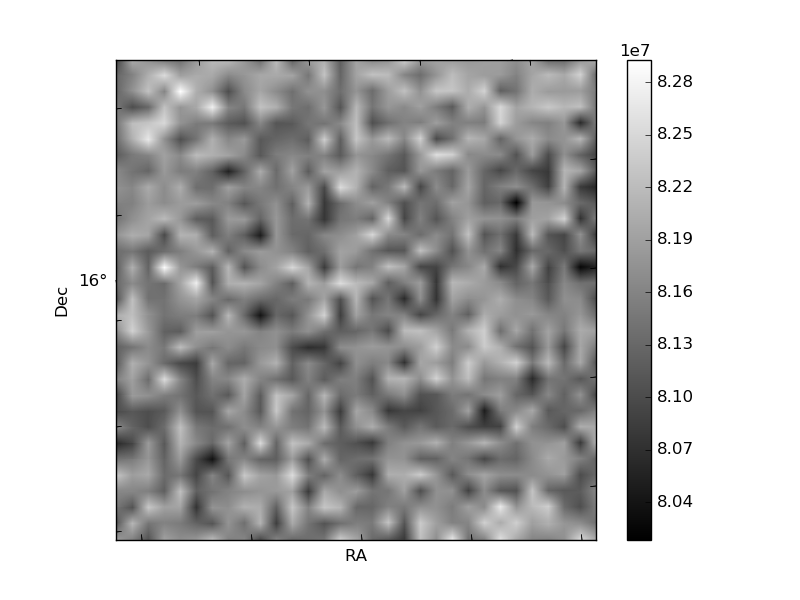
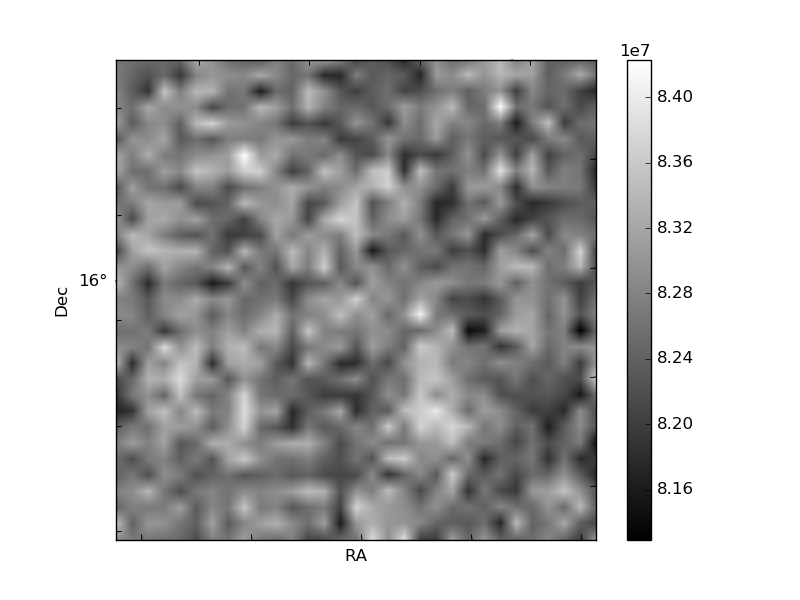
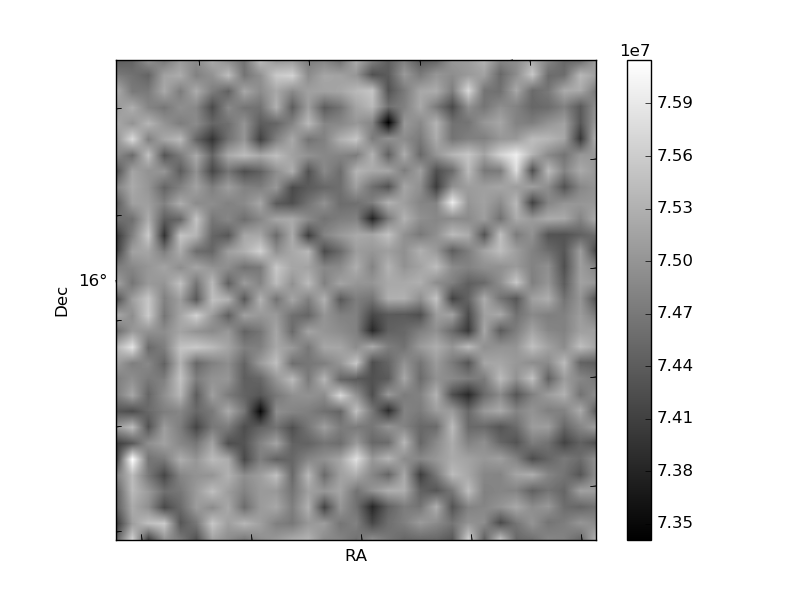
Histogram calculated using DETX and DETY for each event in the final _common_clean file
| Quadrant A | 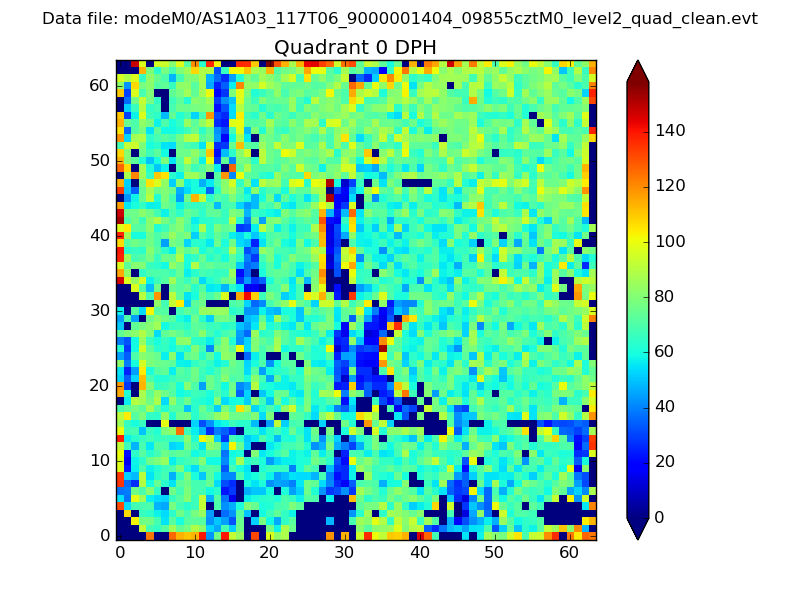 |
 |
Quadrant B |
|---|---|---|---|
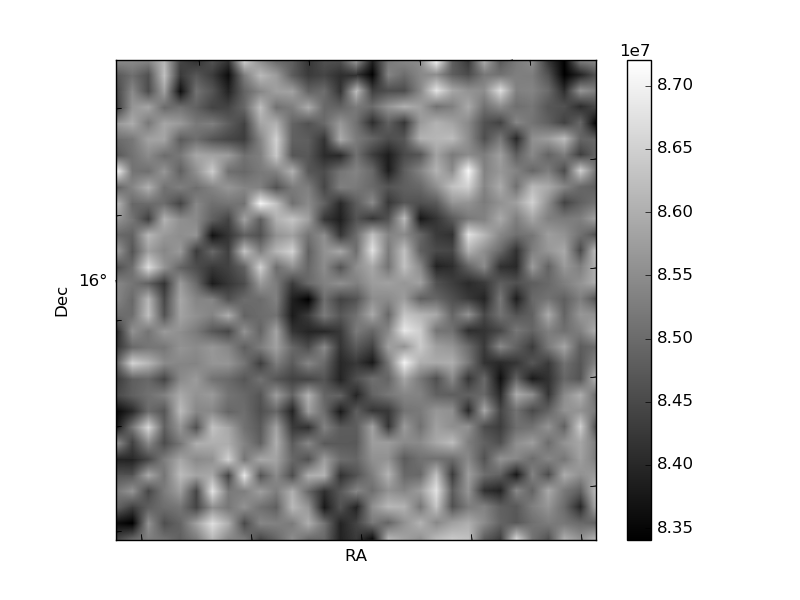
| Quadrant D | 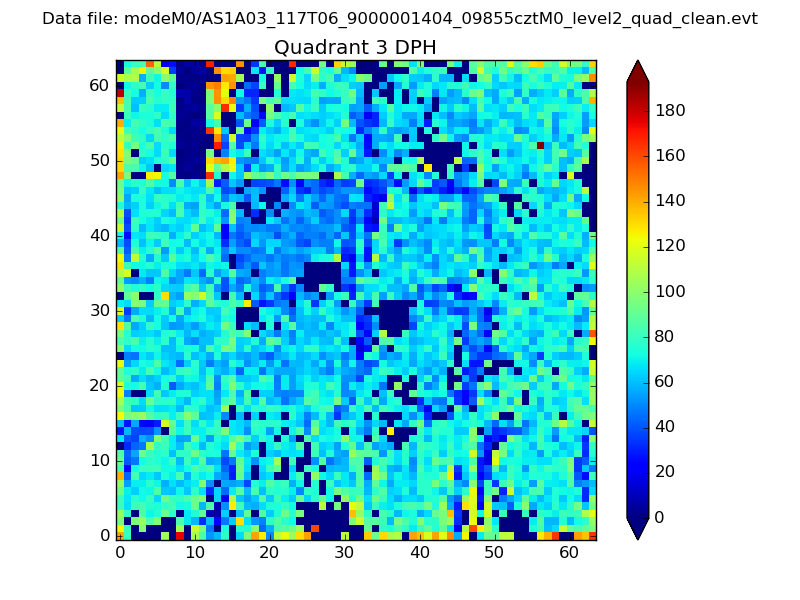 |
 |
Quadrant C |
| Plot type | Count rate plots | Images |
|---|---|---|
| Comparison with Poisson distribution Blue bars denote a histogram of data divided into 1 sec bins. Red curve is a Poisson curve with rate = median count rate of data. |
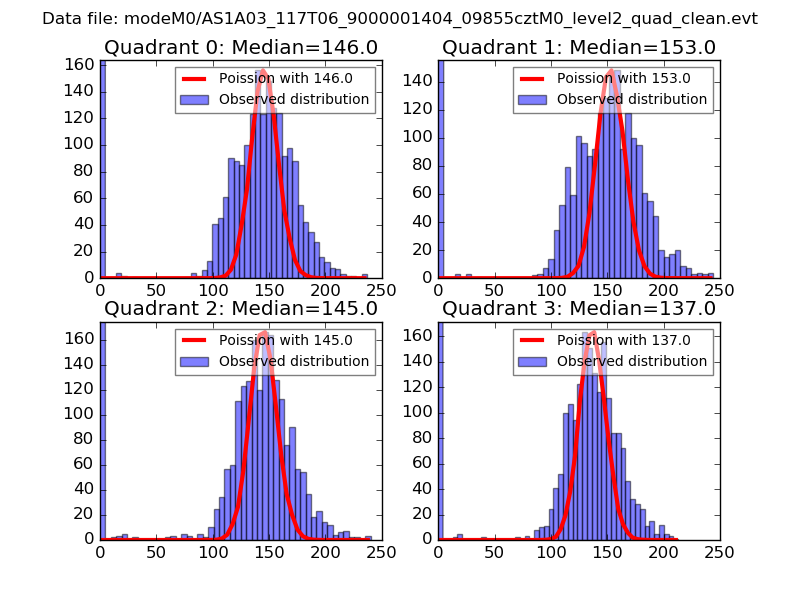 |
 |
| Quadrant-wise count rates Data is divided into 100 sec bins |
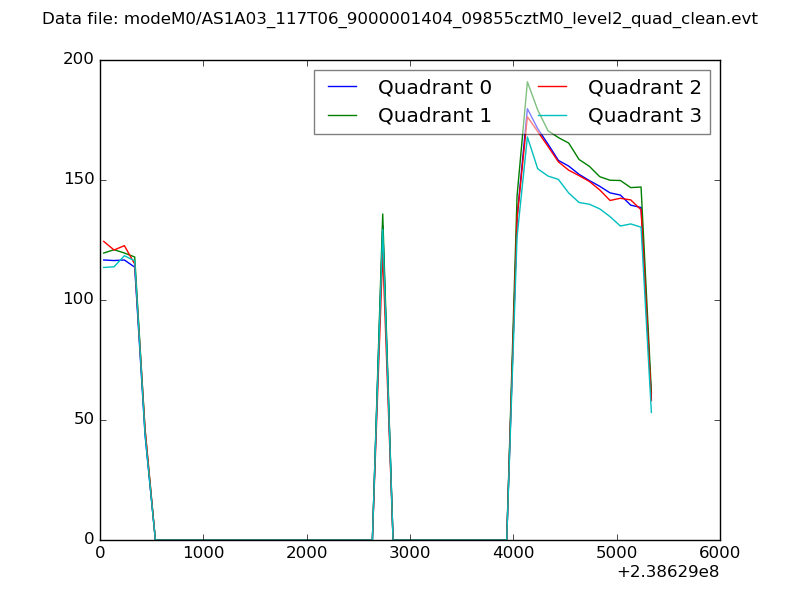 |
|
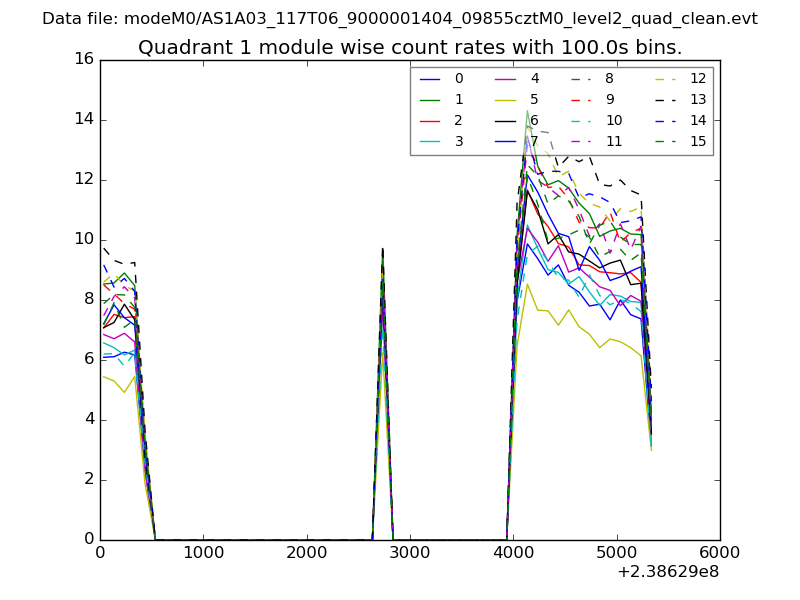
| Module-wise count rates for Quadrant A Data is divided into 100 sec bins |
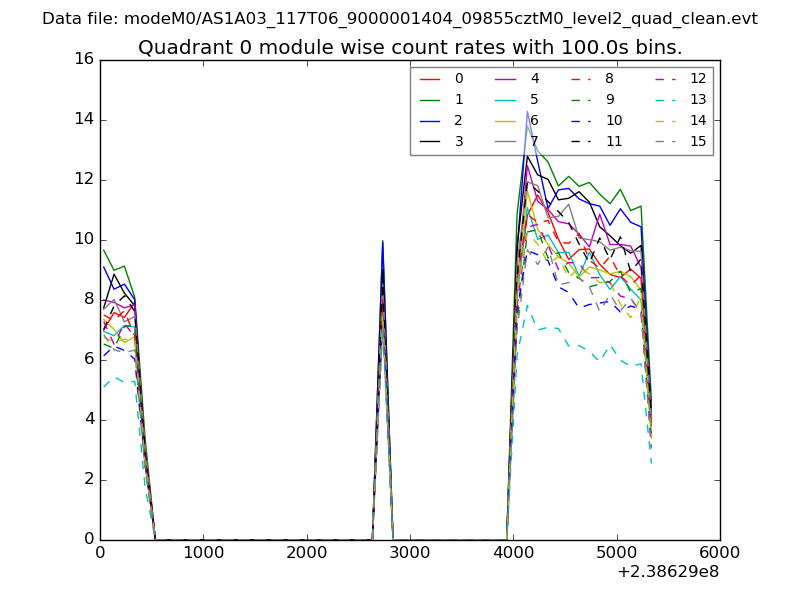 |
 |
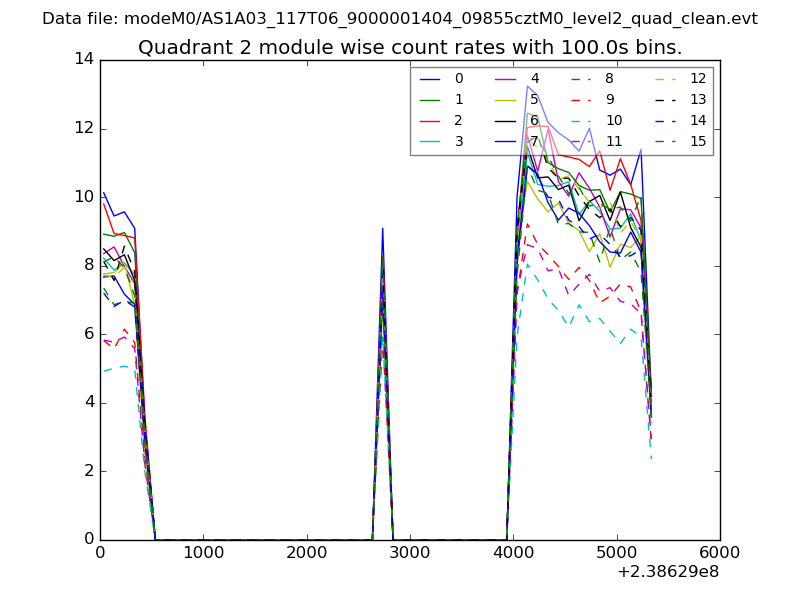
| Module-wise count rates for Quadrant B Data is divided into 100 sec bins |
 |
 |
| Module-wise count rates for Quadrant C Data is divided into 100 sec bins |
 |
 |
| Module-wise count rates for Quadrant D Data is divided into 100 sec bins |
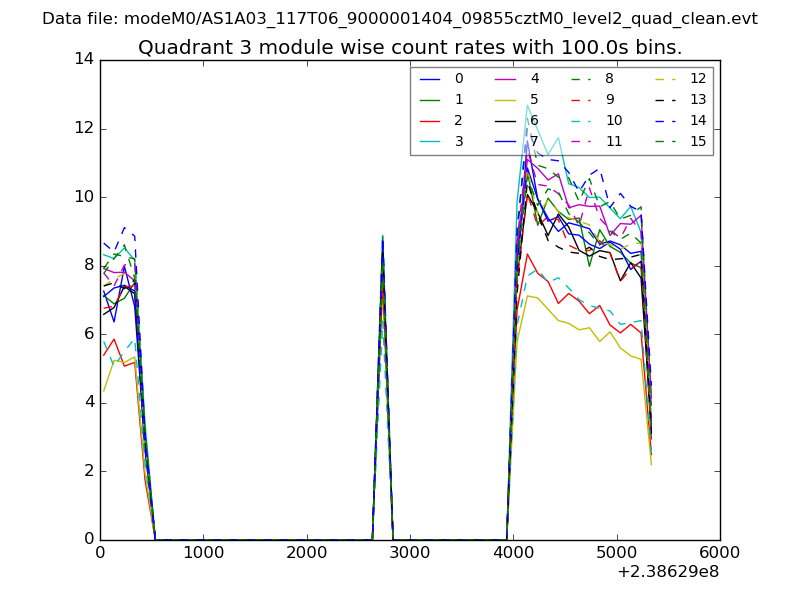 |
 |
| Parameter | Plot |
|---|---|
| CZT HV Monitor | 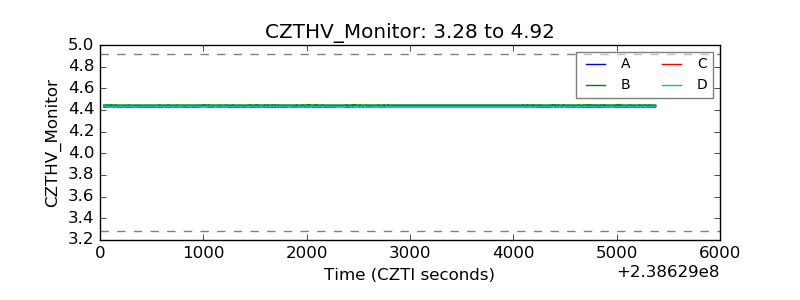 |
| D_VDD | 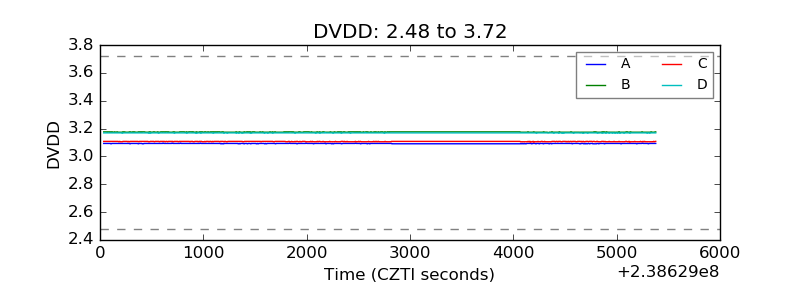 |
| Temperature 1 | 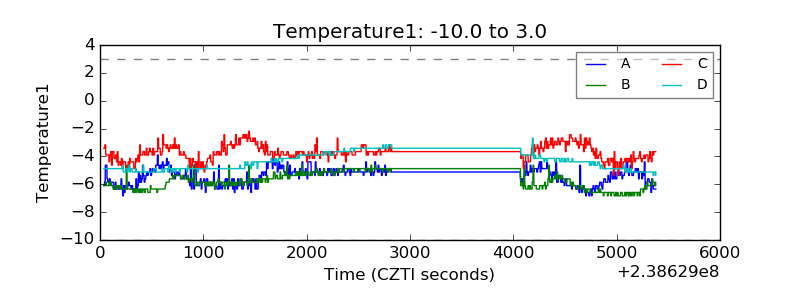 |
| Veto HV Monitor | 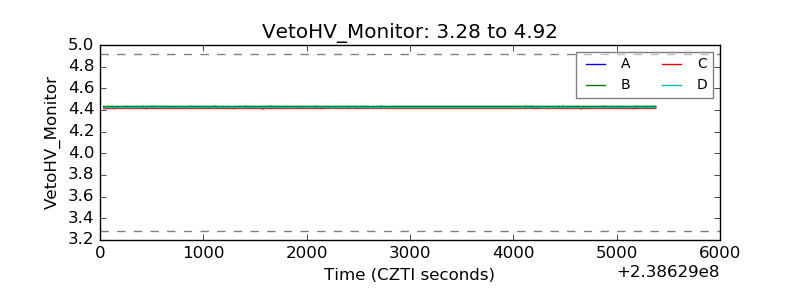 |
| Veto LLD | 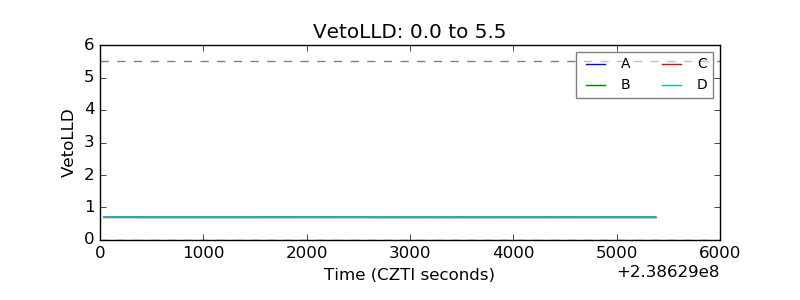 |
| Alpha Counter | 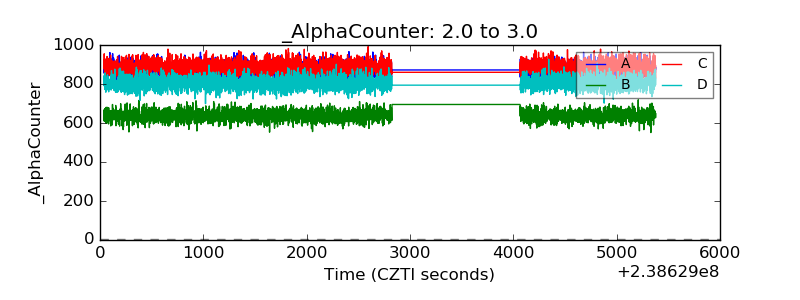 |
| _CPM_Rate | 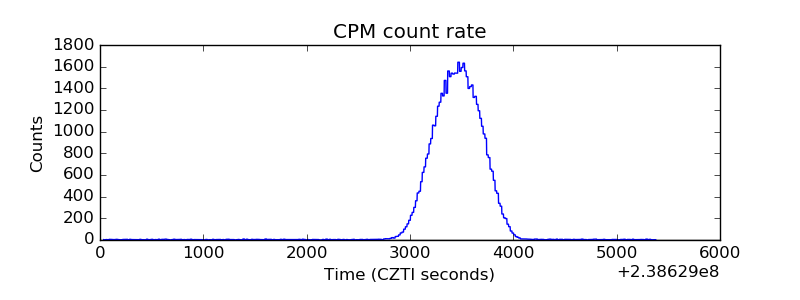 |
| CZT Counter | 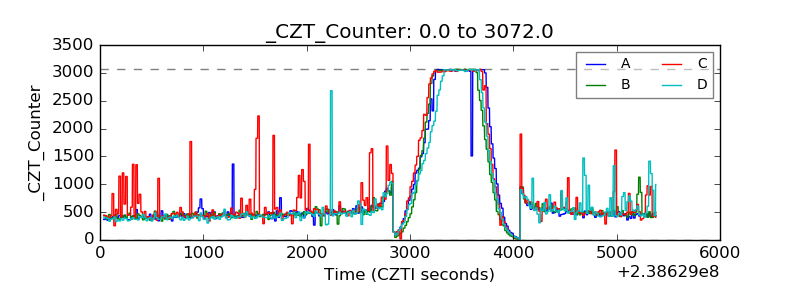 |
| +2.5 Volts monitor |  |
| +5 Volts monitor | 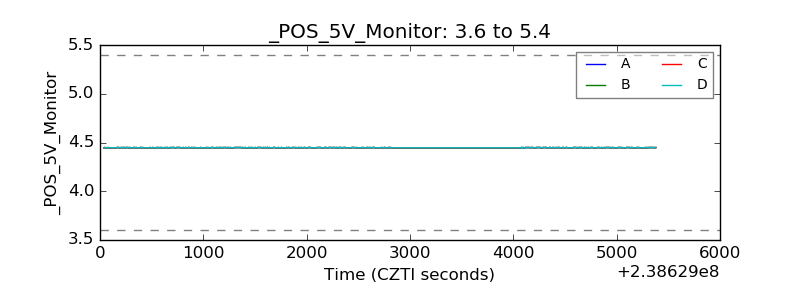 |
| _ROLL_ROT | 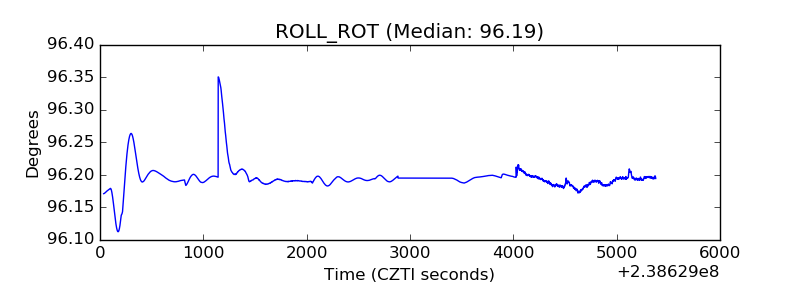 |
| _Roll_DEC | 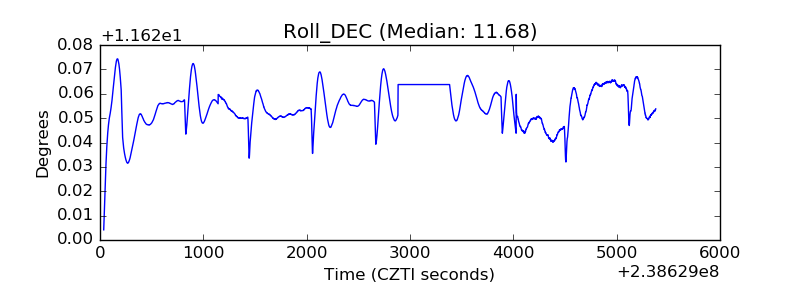 |
| _Roll_RA | 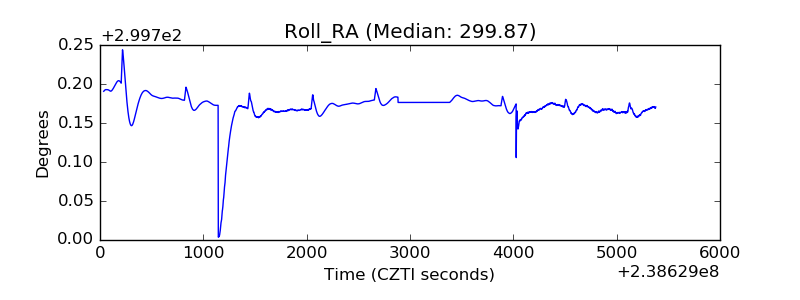 |
| Veto Counter | 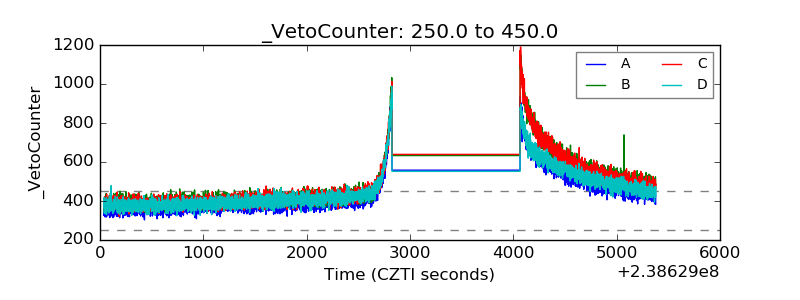 |