| Param | Original file | Final file |
|---|---|---|
| Filename | modeM0/AS1A03_117T06_9000001404_09856cztM0_level2.evt | modeM0/AS1A03_117T06_9000001404_09856cztM0_level2_quad_clean.evt |
| Size (bytes) | 598,849,920 | 100,592,640 |
| Size | 571.1 MB | 95.9 MB |
| Events in quadrant A | 4,117,578 | 619,859 |
| Events in quadrant B | 4,317,480 | 640,505 |
| Events in quadrant C | 4,863,982 | 604,571 |
| Events in quadrant D | 4,253,699 | 584,783 |
| Mode M9 | |||
|---|---|---|---|
| Quadrant | BADHDUFLAG | Total packets | Discarded packets |
| A | 0 | 26 | 1 |
| B | 0 | 26 | 0 |
| C | 0 | 26 | 2 |
| D | 0 | 26 | 2 |
| Mode M0 | |||
|---|---|---|---|
| Quadrant | BADHDUFLAG | Total packets | Discarded packets |
| A | 0 | 19139 | 1363 |
| B | 0 | 19703 | 1451 |
| C | 0 | 21737 | 1528 |
| D | 0 | 20143 | 1593 |
| Mode SS | |||
|---|---|---|---|
| Quadrant | BADHDUFLAG | Total packets | Discarded packets |
| A | 0 | 188 | 10 |
| B | 0 | 188 | 4 |
| C | 0 | 188 | 14 |
| D | 0 | 188 | 14 |
| Quadrant | Total seconds | Saturated seconds | Saturation percentage |
|---|---|---|---|
| A | 8600 | 77 | 0.895349% |
| B | 8578 | 106 | 1.235719% |
| C | 8569 | 256 | 2.987513% |
| D | 8570 | 90 | 1.050175% |
Noise dominated data is calculated using 1-second bins in cleaned event files. If a bin has >2000 counts, and if more than 50% of those come from <1% of pixels, then it is considered to be noise-dominated and hence unusable.
| Quadrant | # 1 sec bins | Bins with >0 counts | Bins with >2000 counts | High rate bins dominated by noise | Noise dominated (total time) | Noise dominated (detector-on time) | Marked lightcurve |
|---|---|---|---|---|---|---|---|
| A | 11811 | 8964 | 0 | 0 | 0.00% | 0.00% |  |
| B | 11811 | 8947 | 17 | 17 | 0.14% | 0.19% |  |
| C | 11811 | 8968 | 132 | 132 | 1.12% | 1.47% | 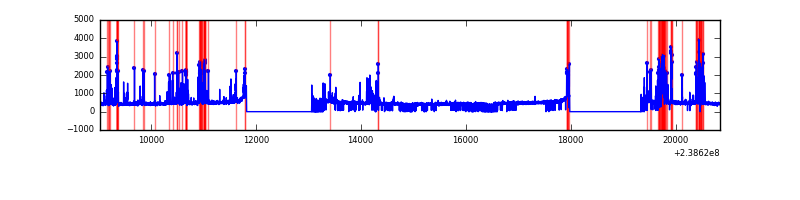 |
| D | 11811 | 8957 | 30 | 30 | 0.25% | 0.33% |  |
Top three noisy pixels from each quadrant. If the there are fewer than three noisy pixels in the level2.evt file, extra rows are filled as -1
| Pixel properties | Quadrant properties | ||||||
|---|---|---|---|---|---|---|---|
| Quadrant | DetID | PixID | Counts | Sigma | Mean | Median | Sigma |
| A | 4 | 2 | 10269 | 43.03 | 1064 | 1044 | 214.4 |
| A | 0 | 226 | 9790 | 40.79 | 1064 | 1044 | 214.4 |
| A | 12 | 194 | 8449 | 34.54 | 1064 | 1044 | 214.4 |
| B | 4 | 81 | 165068 | 816.53 | 1068 | 1046 | 200.9 |
| B | 12 | 111 | 23817 | 113.36 | 1068 | 1046 | 200.9 |
| B | 11 | 111 | 19255 | 90.65 | 1068 | 1046 | 200.9 |
| C | 4 | 254 | 879519 | 3729.59 | 1018 | 1028 | 235.5 |
| C | 13 | 61 | 7658 | 28.15 | 1018 | 1028 | 235.5 |
| C | 14 | 67 | 6297 | 22.37 | 1018 | 1028 | 235.5 |
| D | 12 | 233 | 127391 | 486.07 | 1009 | 989 | 260.0 |
| D | 1 | 52 | 114017 | 434.65 | 1009 | 989 | 260.0 |
| D | 2 | 16 | 74755 | 283.66 | 1009 | 989 | 260.0 |
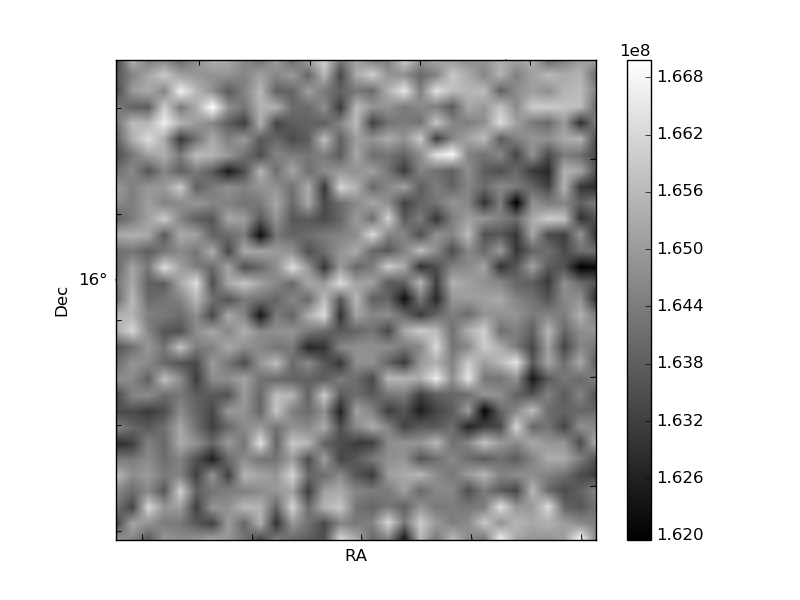
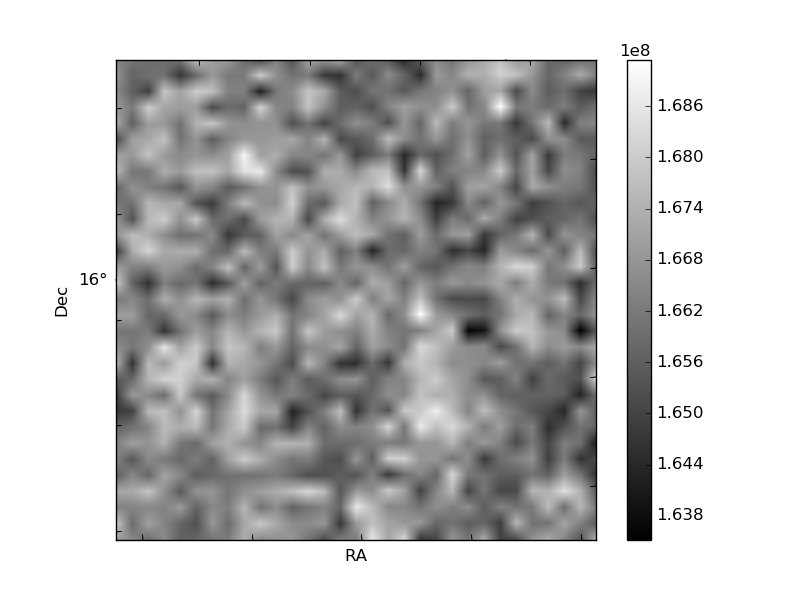
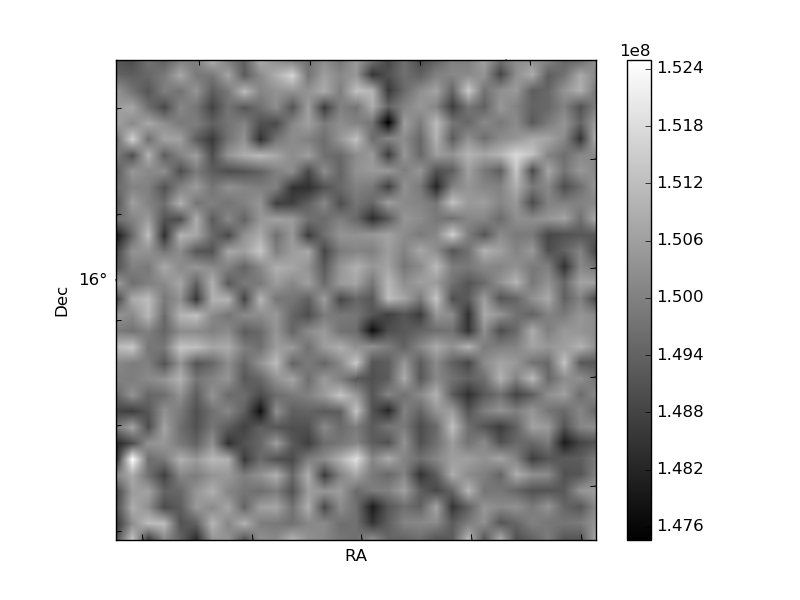
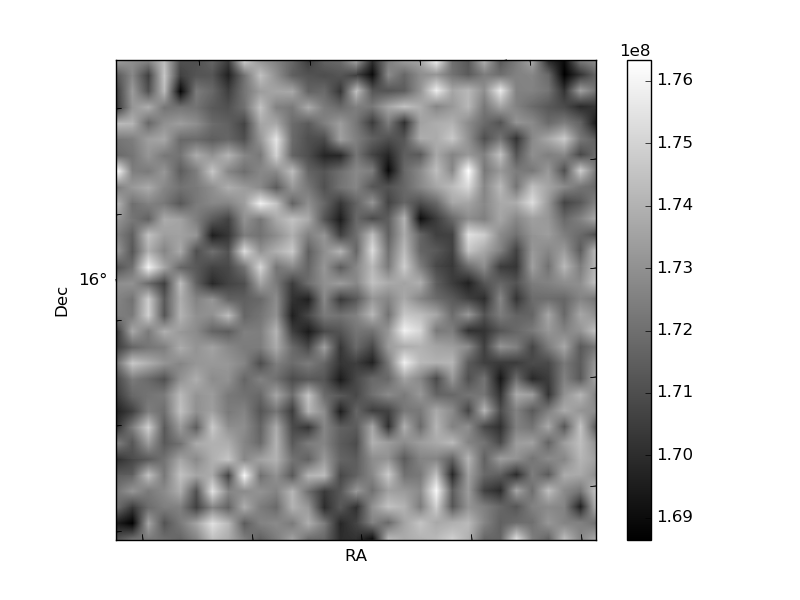
Histogram calculated using DETX and DETY for each event in the final _common_clean file
| Quadrant A |  |
 |
Quadrant B |
|---|---|---|---|
| Quadrant D |  |
 |
Quadrant C |
| Plot type | Count rate plots | Images |
|---|---|---|
| Comparison with Poisson distribution Blue bars denote a histogram of data divided into 1 sec bins. Red curve is a Poisson curve with rate = median count rate of data. |
 |
 |
| Quadrant-wise count rates Data is divided into 100 sec bins |
 |
|
| Module-wise count rates for Quadrant A Data is divided into 100 sec bins |
 |
 |
| Module-wise count rates for Quadrant B Data is divided into 100 sec bins |
 |
 |
| Module-wise count rates for Quadrant C Data is divided into 100 sec bins |
 |
 |
| Module-wise count rates for Quadrant D Data is divided into 100 sec bins |
 |
 |
| Parameter | Plot |
|---|---|
| CZT HV Monitor |  |
| D_VDD | 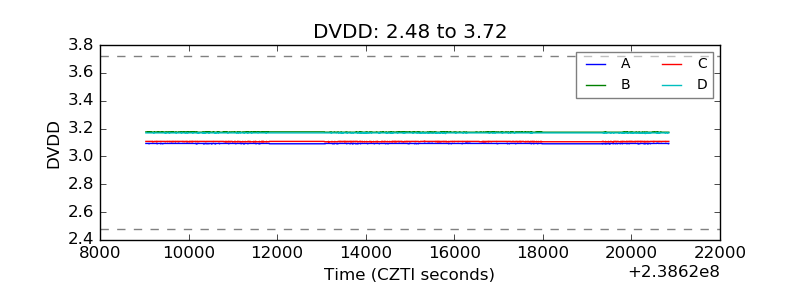 |
| Temperature 1 |  |
| Veto HV Monitor |  |
| Veto LLD |  |
| Alpha Counter |  |
| _CPM_Rate |  |
| CZT Counter |  |
| +2.5 Volts monitor |  |
| +5 Volts monitor |  |
| _ROLL_ROT |  |
| _Roll_DEC |  |
| _Roll_RA |  |
| Veto Counter |  |