| Param | Original file | Final file |
|---|---|---|
| Filename | modeM0/AS1A03_117T06_9000001404_09857cztM0_level2.evt | modeM0/AS1A03_117T06_9000001404_09857cztM0_level2_quad_clean.evt |
| Size (bytes) | 315,829,440 | 64,834,560 |
| Size | 301.2 MB | 61.8 MB |
| Events in quadrant A | 2,193,880 | 416,345 |
| Events in quadrant B | 2,277,504 | 430,869 |
| Events in quadrant C | 2,463,313 | 397,214 |
| Events in quadrant D | 2,316,592 | 396,891 |
| Mode M9 | |||
|---|---|---|---|
| Quadrant | BADHDUFLAG | Total packets | Discarded packets |
| A | 0 | 19 | 2 |
| B | 0 | 19 | 3 |
| C | 0 | 19 | 4 |
| D | 0 | 20 | 6 |
| Mode M0 | |||
|---|---|---|---|
| Quadrant | BADHDUFLAG | Total packets | Discarded packets |
| A | 0 | 13009 | 3493 |
| B | 0 | 13354 | 3676 |
| C | 0 | 15072 | 4755 |
| D | 0 | 13968 | 4011 |
| Mode SS | |||
|---|---|---|---|
| Quadrant | BADHDUFLAG | Total packets | Discarded packets |
| A | 0 | 128 | 38 |
| B | 0 | 127 | 27 |
| C | 0 | 128 | 24 |
| D | 0 | 128 | 36 |
| Quadrant | Total seconds | Saturated seconds | Saturation percentage |
|---|---|---|---|
| A | 4601 | 23 | 0.499891% |
| B | 4578 | 34 | 0.742682% |
| C | 4463 | 76 | 1.702890% |
| D | 4563 | 53 | 1.161517% |
Noise dominated data is calculated using 1-second bins in cleaned event files. If a bin has >2000 counts, and if more than 50% of those come from <1% of pixels, then it is considered to be noise-dominated and hence unusable.
| Quadrant | # 1 sec bins | Bins with >0 counts | Bins with >2000 counts | High rate bins dominated by noise | Noise dominated (total time) | Noise dominated (detector-on time) | Marked lightcurve |
|---|---|---|---|---|---|---|---|
| A | 7588 | 5612 | 0 | 0 | 0.00% | 0.00% | 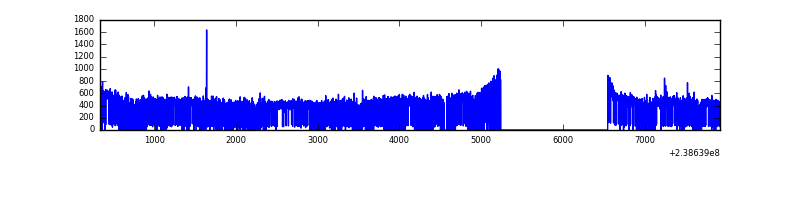 |
| B | 7587 | 5536 | 4 | 4 | 0.05% | 0.07% | 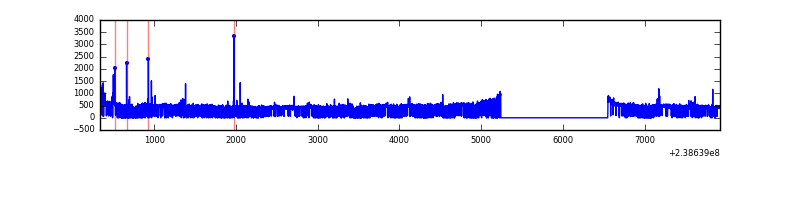 |
| C | 7588 | 5491 | 29 | 29 | 0.38% | 0.53% | 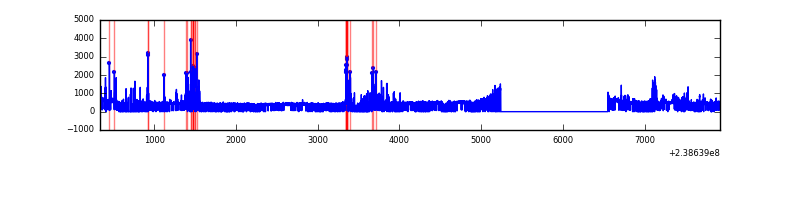 |
| D | 7588 | 5580 | 16 | 16 | 0.21% | 0.29% | 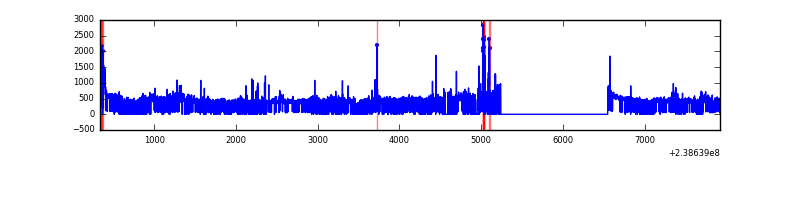 |
Top three noisy pixels from each quadrant. If the there are fewer than three noisy pixels in the level2.evt file, extra rows are filled as -1
| Pixel properties | Quadrant properties | ||||||
|---|---|---|---|---|---|---|---|
| Quadrant | DetID | PixID | Counts | Sigma | Mean | Median | Sigma |
| A | 0 | 226 | 5189 | 40.26 | 568 | 558 | 115.0 |
| A | 12 | 194 | 4407 | 33.46 | 568 | 558 | 115.0 |
| A | 13 | 253 | 3272 | 23.59 | 568 | 558 | 115.0 |
| B | 4 | 81 | 47278 | 430.88 | 571 | 560 | 108.4 |
| B | 0 | 229 | 13126 | 115.9 | 571 | 560 | 108.4 |
| B | 12 | 111 | 12460 | 109.75 | 571 | 560 | 108.4 |
| C | 4 | 254 | 382188 | 3063.42 | 532 | 537 | 124.6 |
| C | 13 | 61 | 3965 | 27.52 | 532 | 537 | 124.6 |
| C | 9 | 54 | 2907 | 19.02 | 532 | 537 | 124.6 |
| D | 2 | 16 | 134467 | 954.55 | 535 | 524 | 140.3 |
| D | 13 | 137 | 50716 | 357.7 | 535 | 524 | 140.3 |
| D | 10 | 172 | 41841 | 294.45 | 535 | 524 | 140.3 |
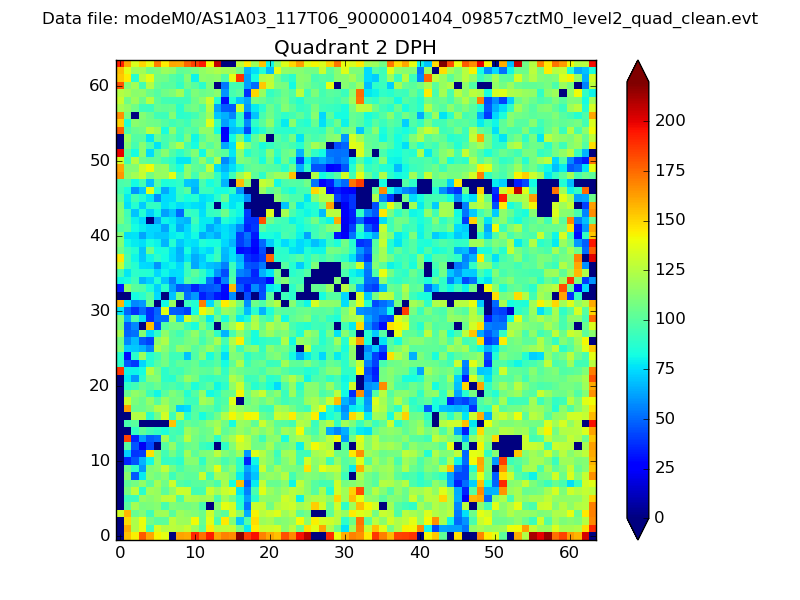
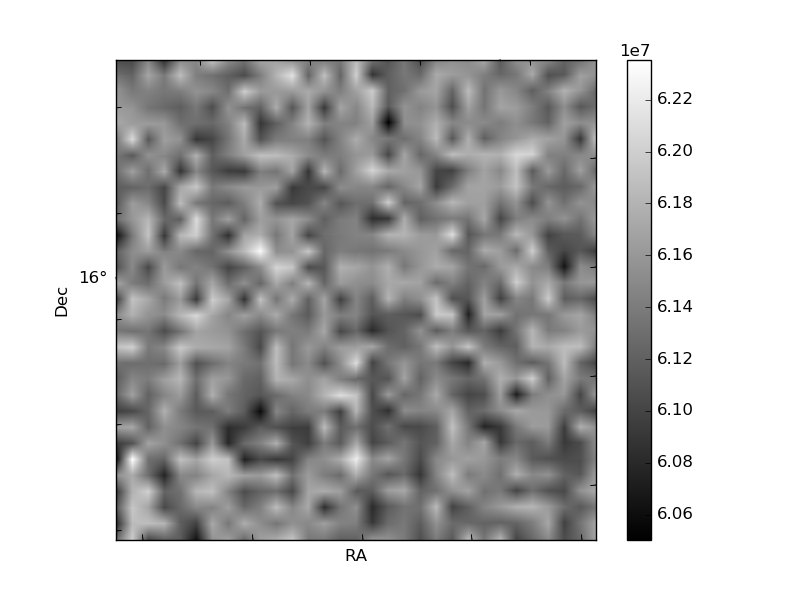
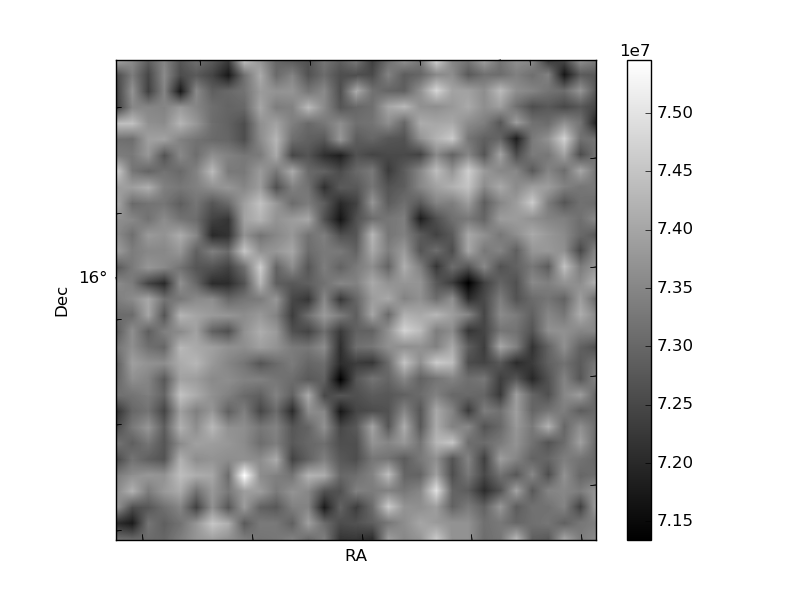
Histogram calculated using DETX and DETY for each event in the final _common_clean file
| Quadrant A |  |
 |
Quadrant B |
|---|---|---|---|
| Quadrant D | 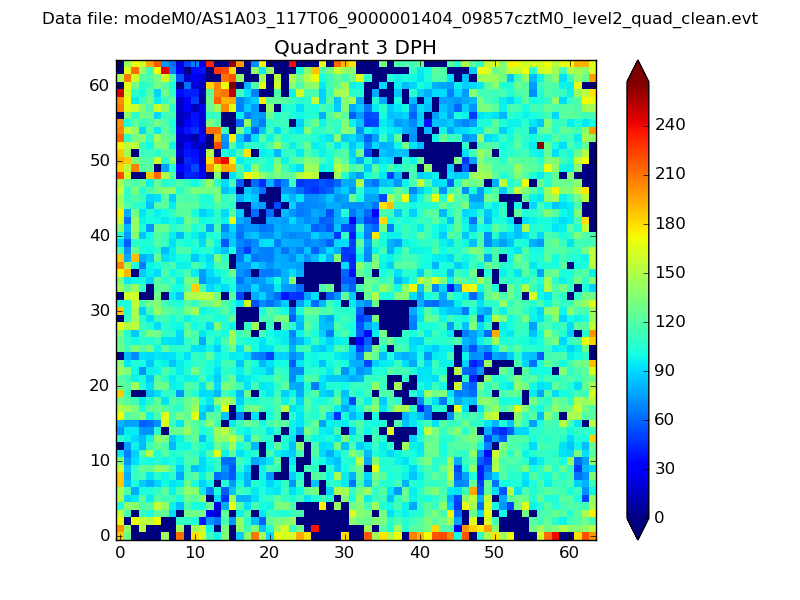 |
 |
Quadrant C |
| Plot type | Count rate plots | Images |
|---|---|---|
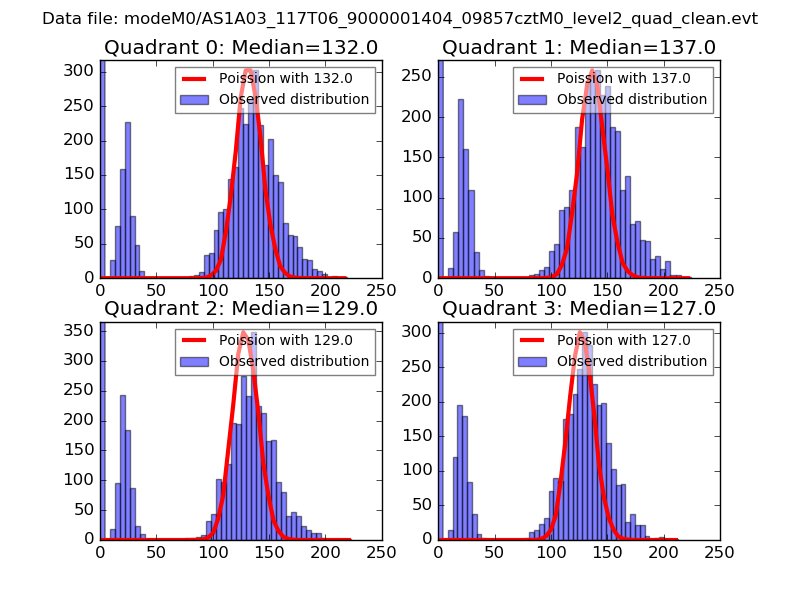
| Comparison with Poisson distribution Blue bars denote a histogram of data divided into 1 sec bins. Red curve is a Poisson curve with rate = median count rate of data. |
 |
 |
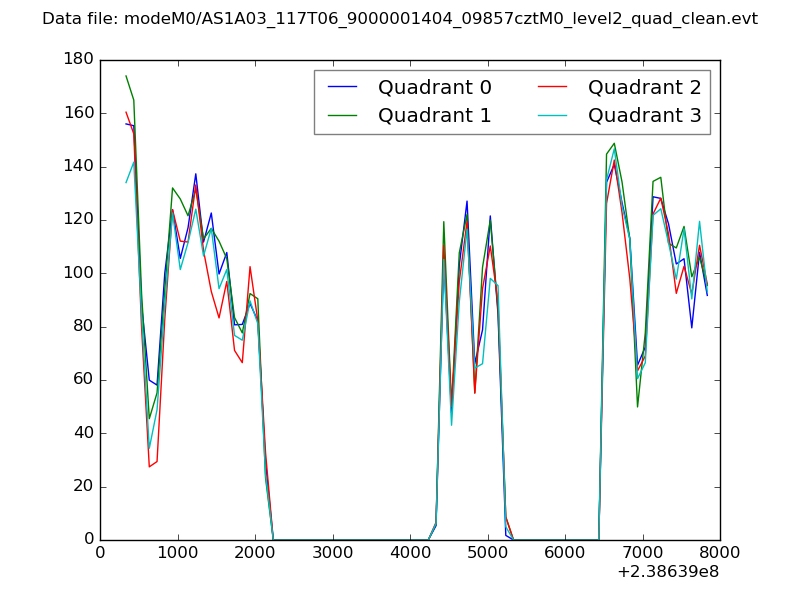
| Quadrant-wise count rates Data is divided into 100 sec bins |
 |
|
| Module-wise count rates for Quadrant A Data is divided into 100 sec bins |
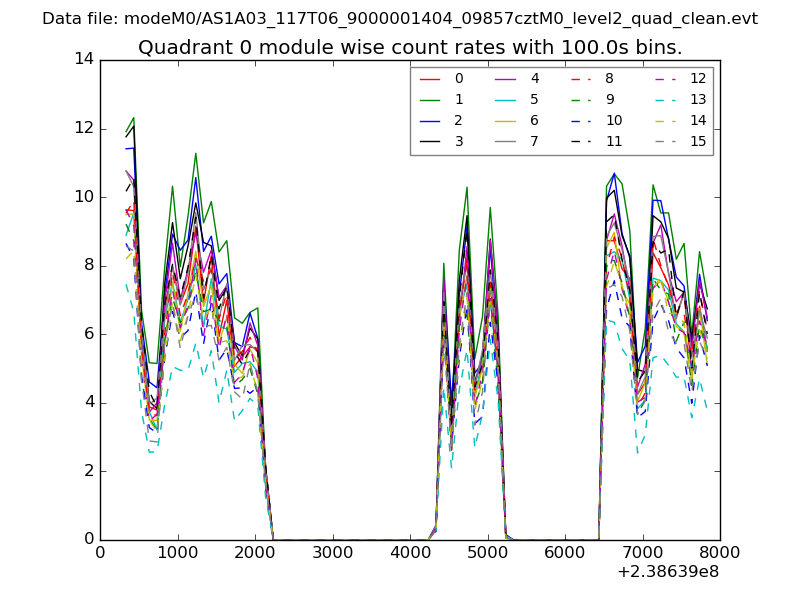 |
 |
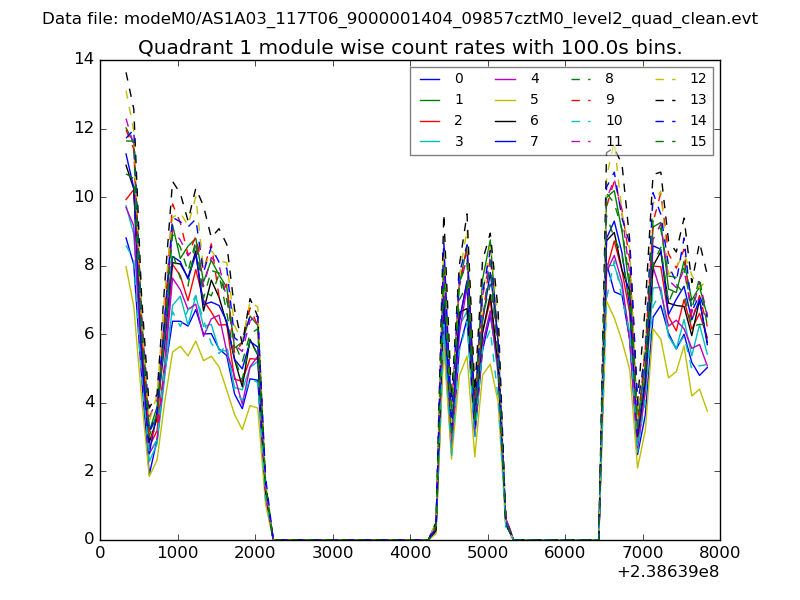
| Module-wise count rates for Quadrant B Data is divided into 100 sec bins |
 |
 |
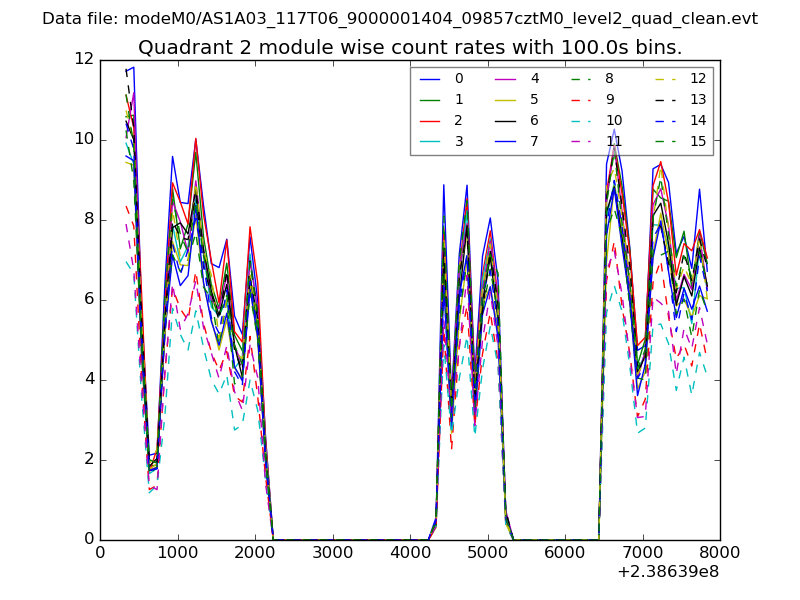
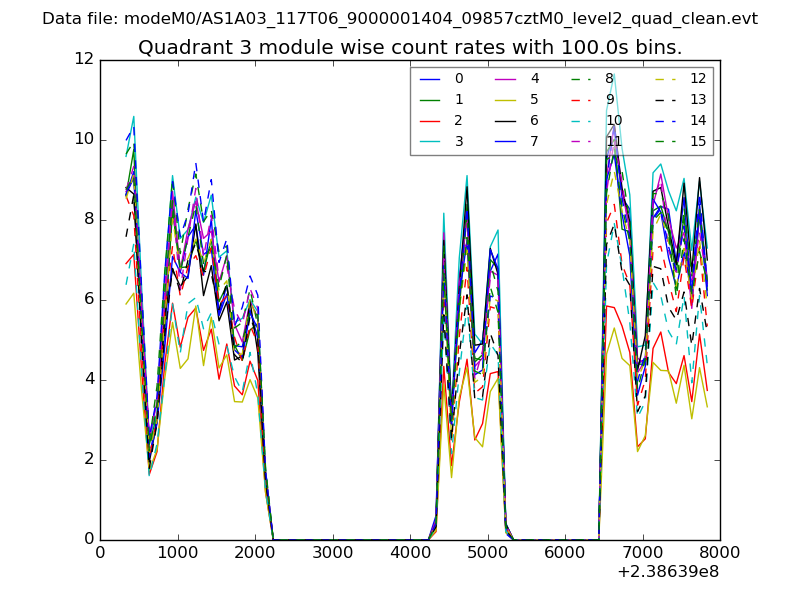
| Module-wise count rates for Quadrant C Data is divided into 100 sec bins |
 |
 |
| Module-wise count rates for Quadrant D Data is divided into 100 sec bins |
 |
 |
| Parameter | Plot |
|---|---|
| CZT HV Monitor | 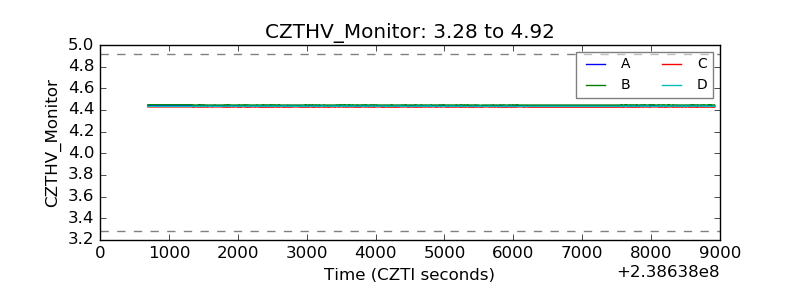 |
| D_VDD | 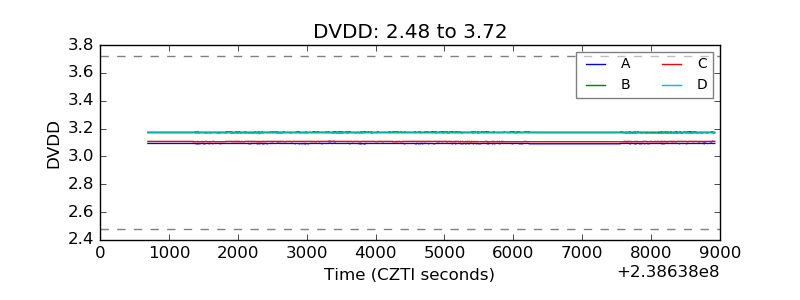 |
| Temperature 1 | 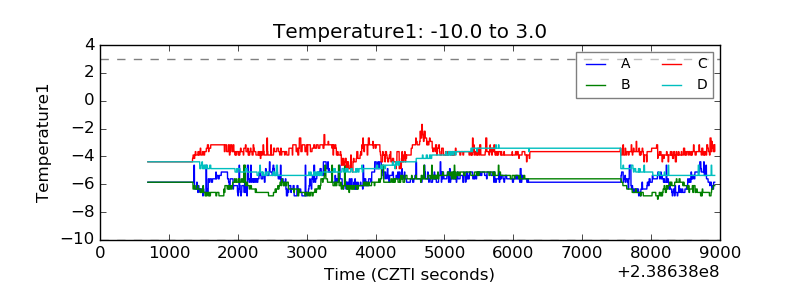 |
| Veto HV Monitor | 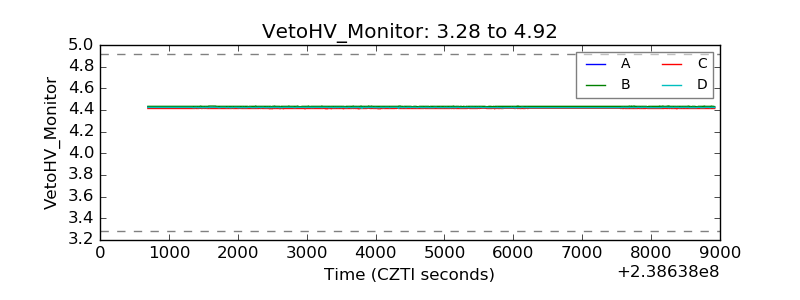 |
| Veto LLD | 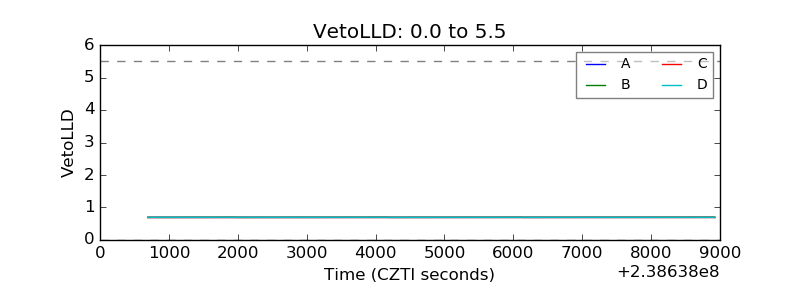 |
| Alpha Counter | 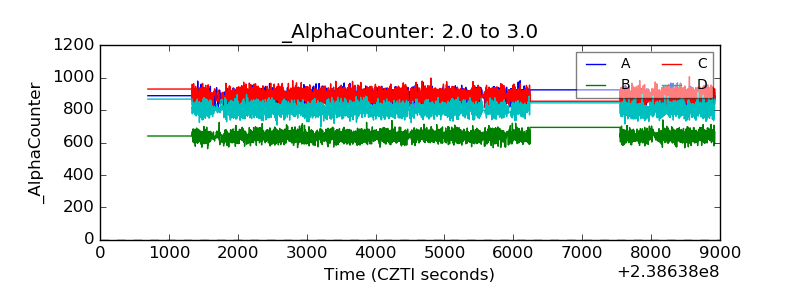 |
| _CPM_Rate | 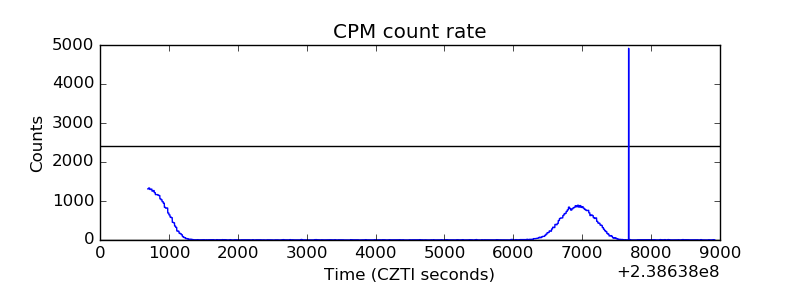 |
| CZT Counter | 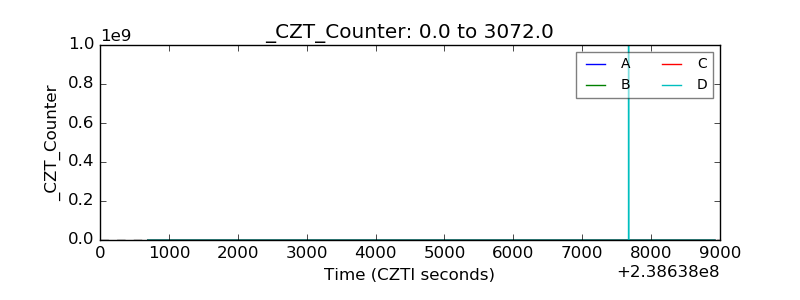 |
| +2.5 Volts monitor |  |
| +5 Volts monitor | 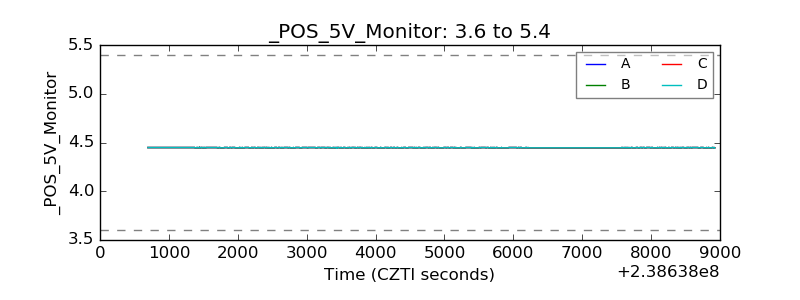 |
| _ROLL_ROT | 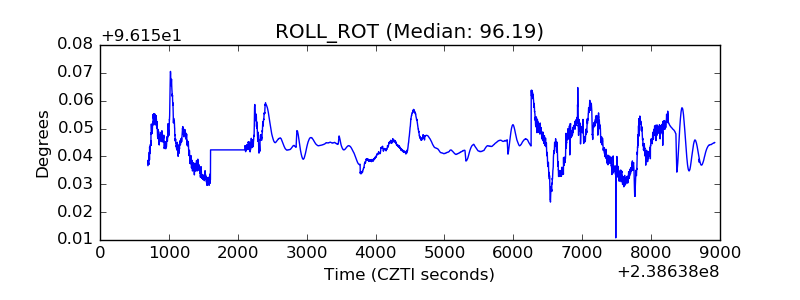 |
| _Roll_DEC | 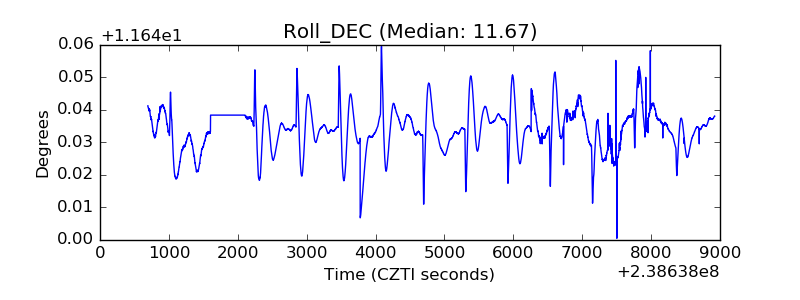 |
| _Roll_RA | 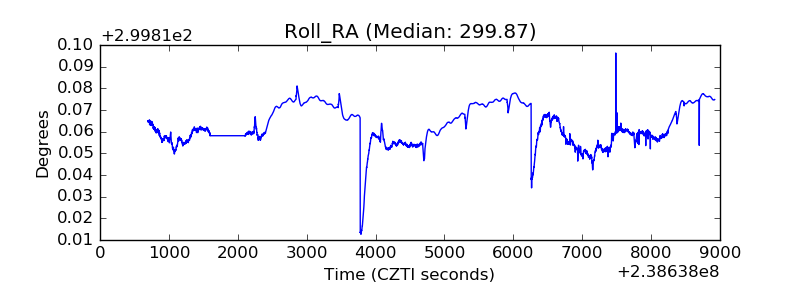 |
| Veto Counter | 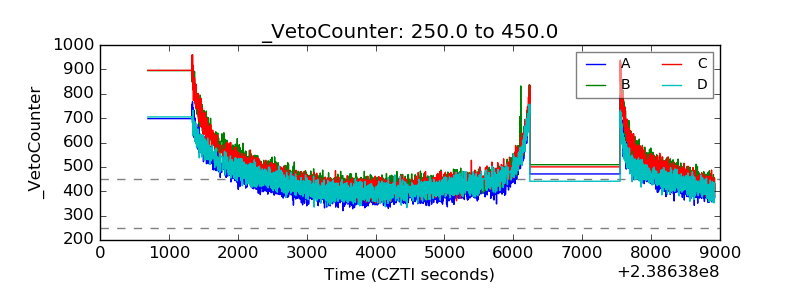 |