| Param | Original file | Final file |
|---|---|---|
| Filename | modeM0/AS1A03_117T06_9000001404_09858cztM0_level2.evt | modeM0/AS1A03_117T06_9000001404_09858cztM0_level2_quad_clean.evt |
| Size (bytes) | 543,902,400 | 96,192,000 |
| Size | 518.7 MB | 91.7 MB |
| Events in quadrant A | 3,805,698 | 597,413 |
| Events in quadrant B | 3,886,598 | 614,229 |
| Events in quadrant C | 4,241,942 | 582,043 |
| Events in quadrant D | 3,989,731 | 558,793 |
| Mode M9 | |||
|---|---|---|---|
| Quadrant | BADHDUFLAG | Total packets | Discarded packets |
| A | 0 | 26 | 5 |
| B | 0 | 26 | 9 |
| C | 0 | 26 | 11 |
| D | 0 | 26 | 9 |
| Mode M0 | |||
|---|---|---|---|
| Quadrant | BADHDUFLAG | Total packets | Discarded packets |
| A | 0 | 21912 | 5214 |
| B | 0 | 22157 | 5431 |
| C | 0 | 24706 | 6702 |
| D | 0 | 23604 | 6139 |
| Mode SS | |||
|---|---|---|---|
| Quadrant | BADHDUFLAG | Total packets | Discarded packets |
| A | 0 | 214 | 52 |
| B | 0 | 214 | 46 |
| C | 0 | 214 | 48 |
| D | 0 | 214 | 52 |
| Quadrant | Total seconds | Saturated seconds | Saturation percentage |
|---|---|---|---|
| A | 8124 | 23 | 0.283112% |
| B | 8042 | 39 | 0.484954% |
| C | 7984 | 72 | 0.901804% |
| D | 8044 | 69 | 0.857782% |
Noise dominated data is calculated using 1-second bins in cleaned event files. If a bin has >2000 counts, and if more than 50% of those come from <1% of pixels, then it is considered to be noise-dominated and hence unusable.
| Quadrant | # 1 sec bins | Bins with >0 counts | Bins with >2000 counts | High rate bins dominated by noise | Noise dominated (total time) | Noise dominated (detector-on time) | Marked lightcurve |
|---|---|---|---|---|---|---|---|
| A | 13163 | 8794 | 0 | 0 | 0.00% | 0.00% | 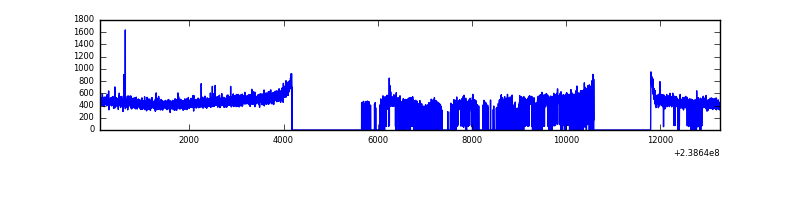 |
| B | 13163 | 8732 | 3 | 3 | 0.02% | 0.03% | 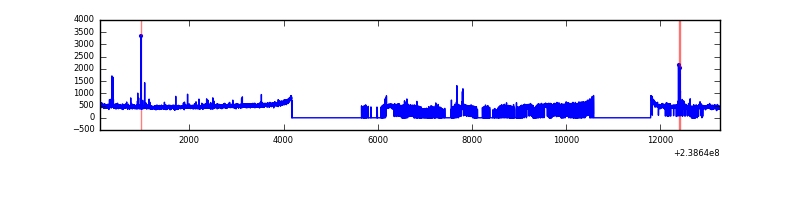 |
| C | 13163 | 8702 | 52 | 52 | 0.40% | 0.60% | 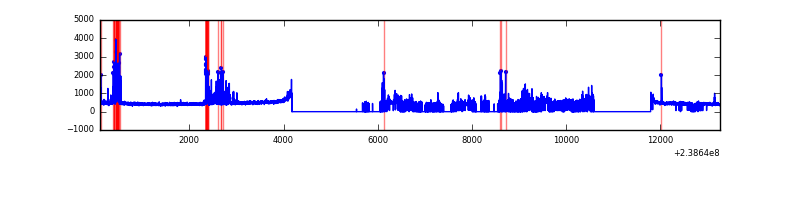 |
| D | 13163 | 8706 | 41 | 41 | 0.31% | 0.47% | 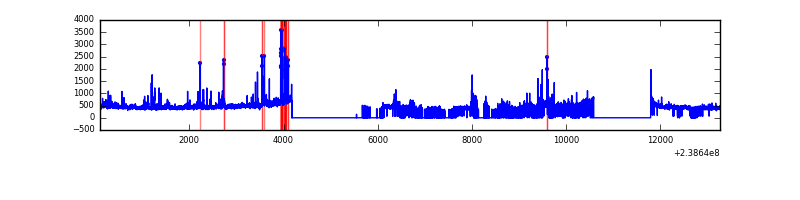 |
Top three noisy pixels from each quadrant. If the there are fewer than three noisy pixels in the level2.evt file, extra rows are filled as -1
| Pixel properties | Quadrant properties | ||||||
|---|---|---|---|---|---|---|---|
| Quadrant | DetID | PixID | Counts | Sigma | Mean | Median | Sigma |
| A | 0 | 226 | 8926 | 39.65 | 986 | 967 | 200.7 |
| A | 12 | 194 | 7620 | 33.15 | 986 | 967 | 200.7 |
| A | 4 | 2 | 4921 | 19.7 | 986 | 967 | 200.7 |
| B | 4 | 81 | 56340 | 296.75 | 983 | 963 | 186.6 |
| B | 12 | 111 | 21928 | 112.35 | 983 | 963 | 186.6 |
| B | 11 | 111 | 18199 | 92.36 | 983 | 963 | 186.6 |
| C | 4 | 254 | 595103 | 2747.57 | 933 | 938 | 216.3 |
| C | 13 | 61 | 7040 | 28.22 | 933 | 938 | 216.3 |
| C | 9 | 54 | 5375 | 20.52 | 933 | 938 | 216.3 |
| D | 2 | 16 | 205107 | 846.08 | 926 | 907 | 241.3 |
| D | 10 | 172 | 109439 | 449.69 | 926 | 907 | 241.3 |
| D | 1 | 52 | 63501 | 259.35 | 926 | 907 | 241.3 |
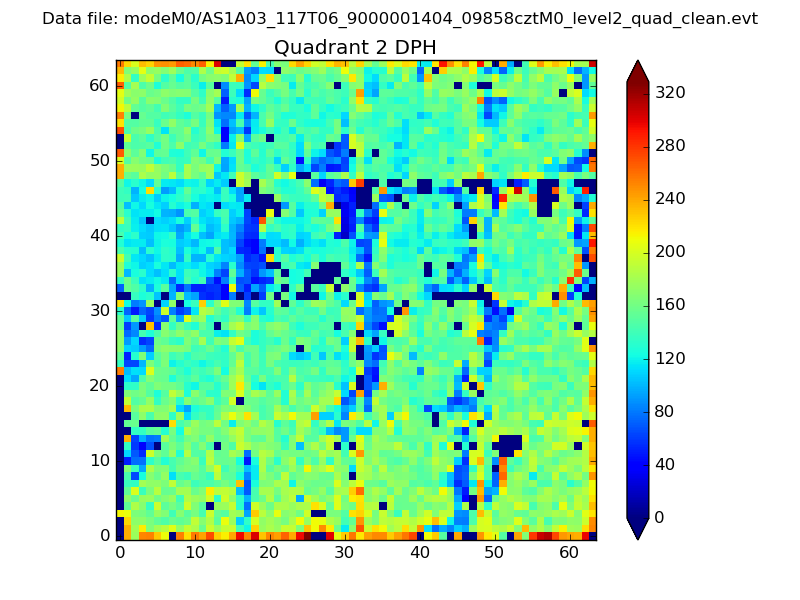
Histogram calculated using DETX and DETY for each event in the final _common_clean file
| Quadrant A | 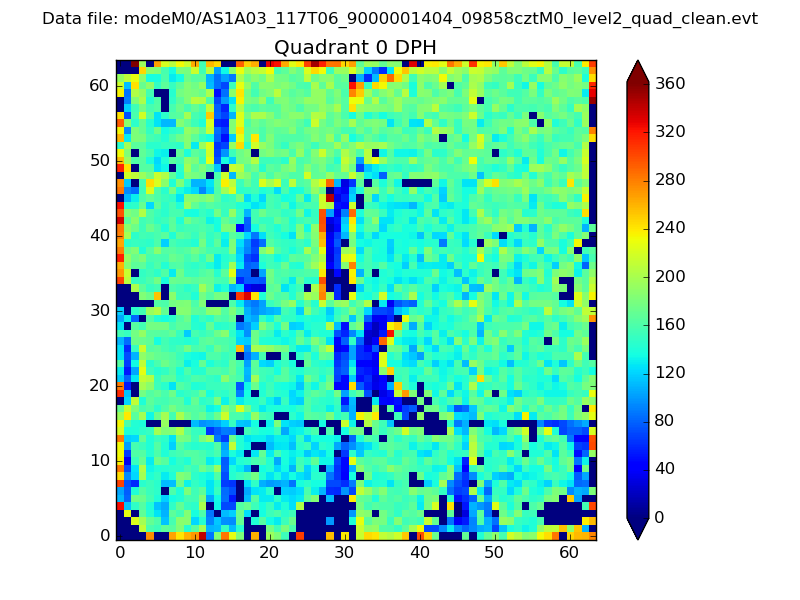 |
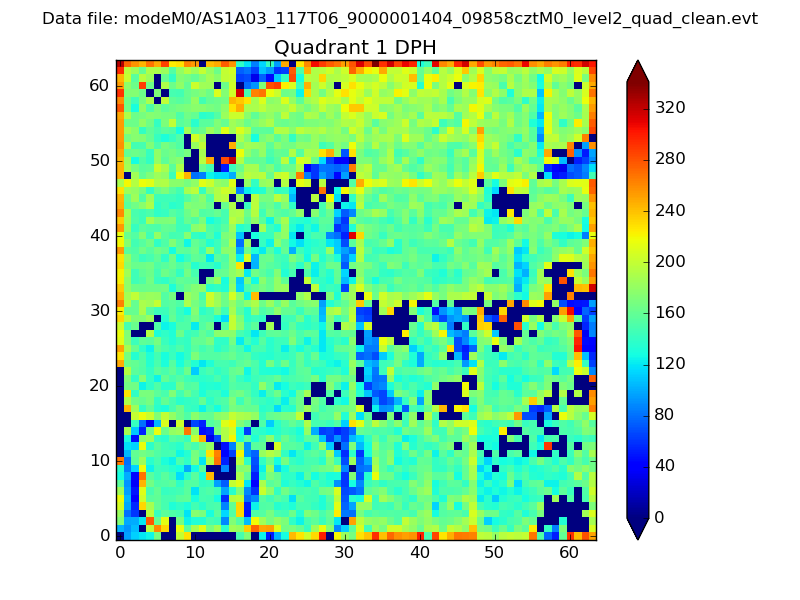 |
Quadrant B |
|---|---|---|---|
| Quadrant D | 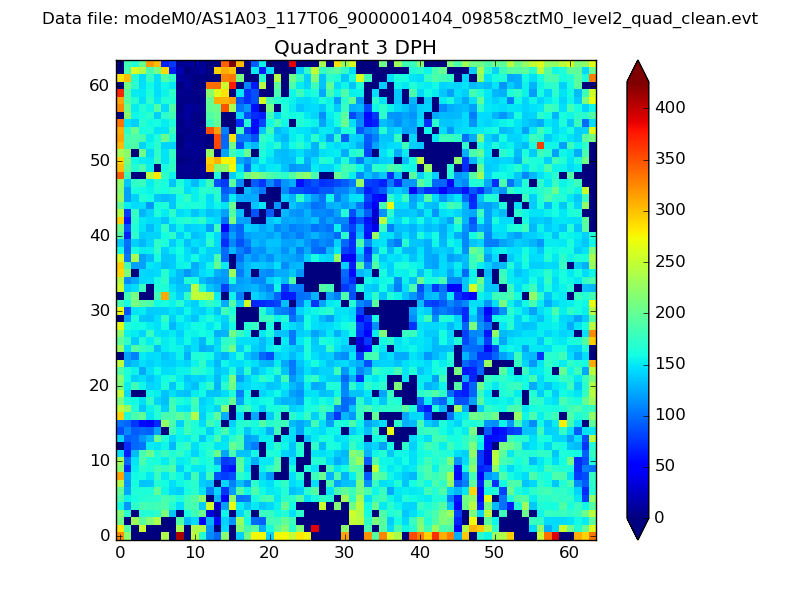 |
 |
Quadrant C |
| Plot type | Count rate plots | Images |
|---|---|---|
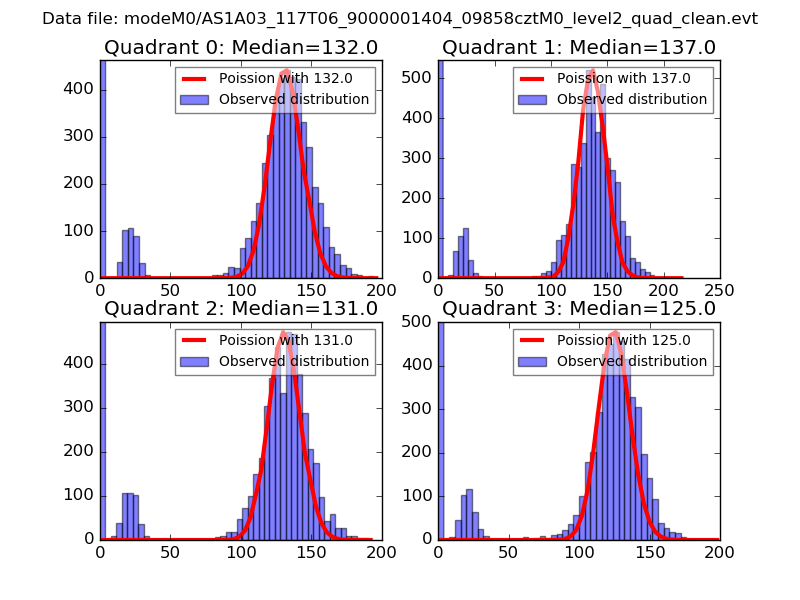
| Comparison with Poisson distribution Blue bars denote a histogram of data divided into 1 sec bins. Red curve is a Poisson curve with rate = median count rate of data. |
 |
 |
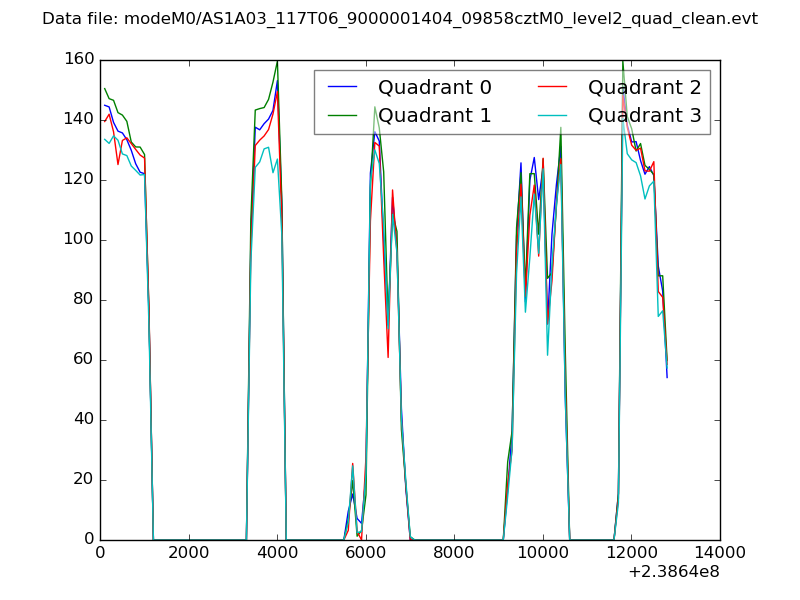
| Quadrant-wise count rates Data is divided into 100 sec bins |
 |
|
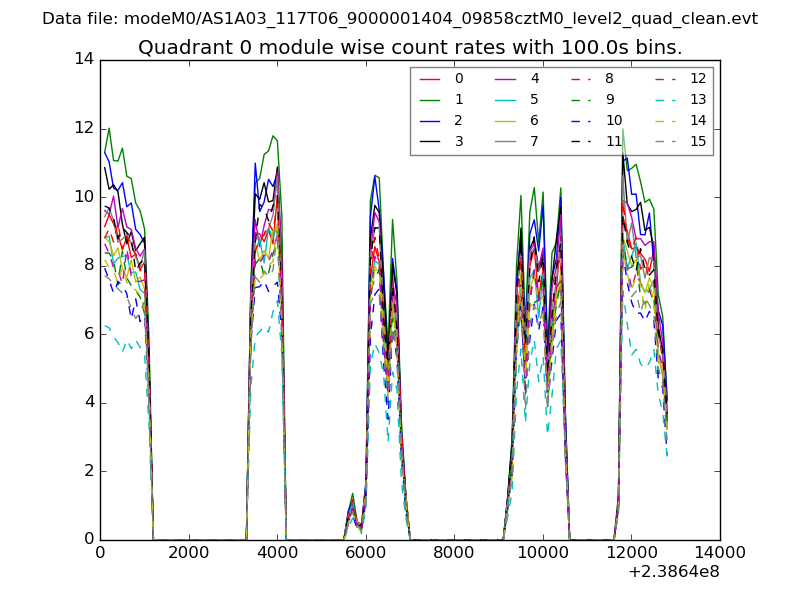
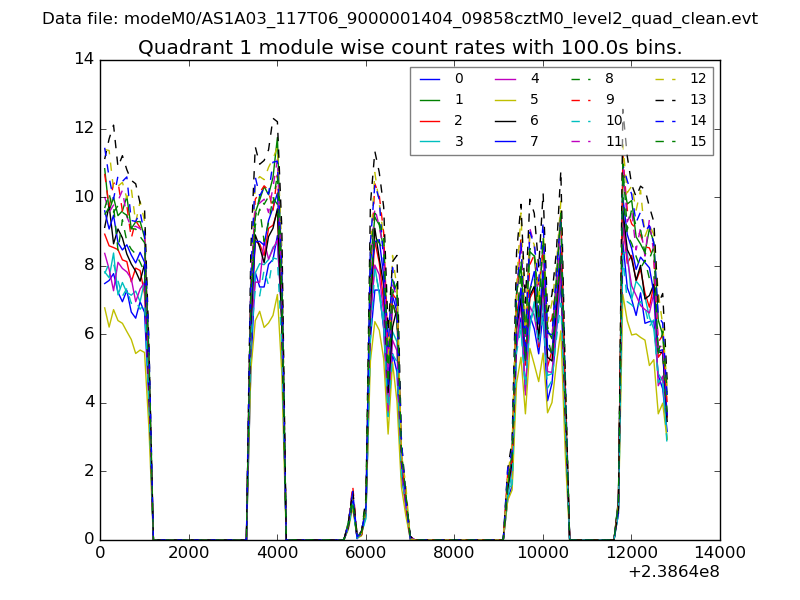
| Module-wise count rates for Quadrant A Data is divided into 100 sec bins |
 |
 |
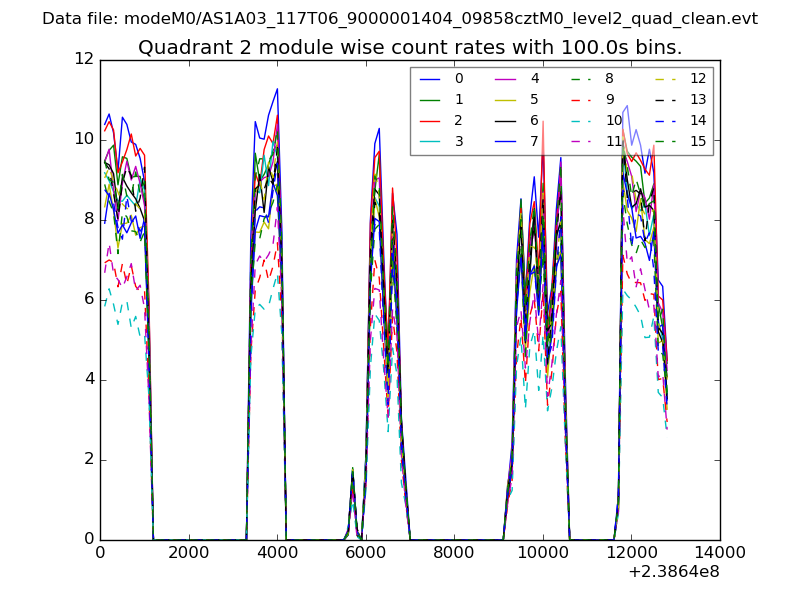
| Module-wise count rates for Quadrant B Data is divided into 100 sec bins |
 |
 |
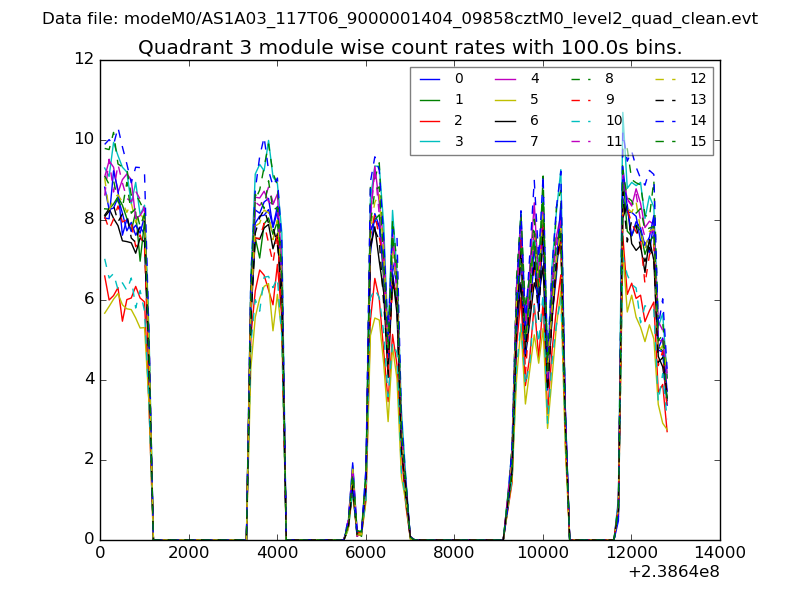
| Module-wise count rates for Quadrant C Data is divided into 100 sec bins |
 |
 |
| Module-wise count rates for Quadrant D Data is divided into 100 sec bins |
 |
 |
| Parameter | Plot |
|---|---|
| CZT HV Monitor | 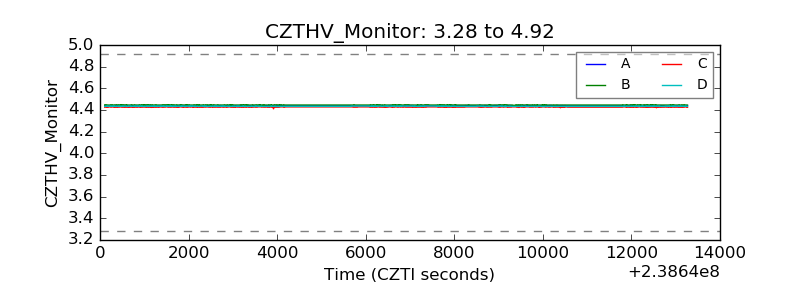 |
| D_VDD | 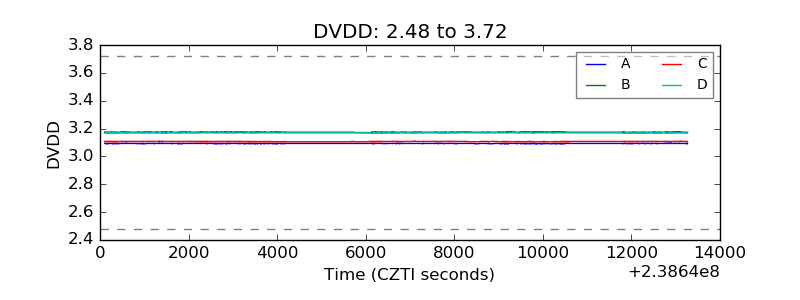 |
| Temperature 1 | 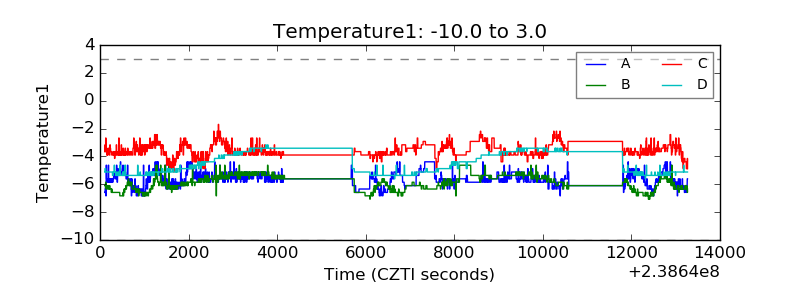 |
| Veto HV Monitor | 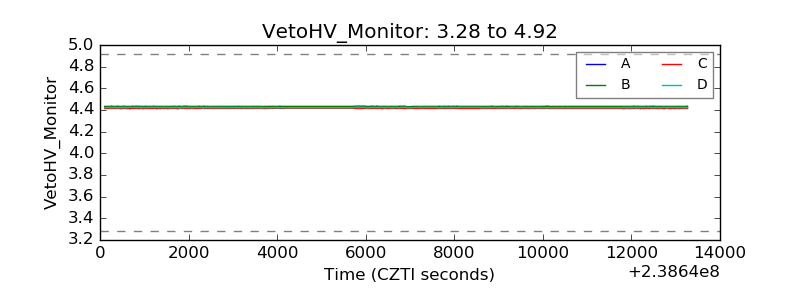 |
| Veto LLD | 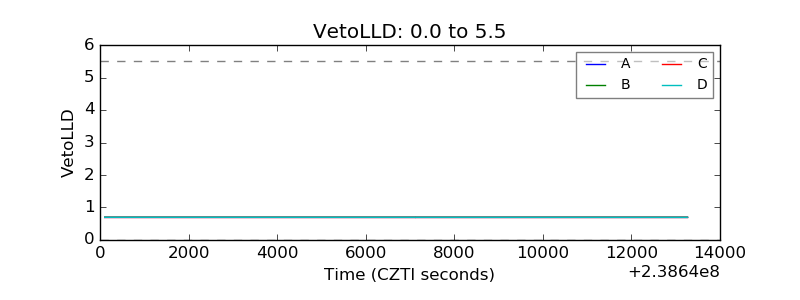 |
| Alpha Counter | 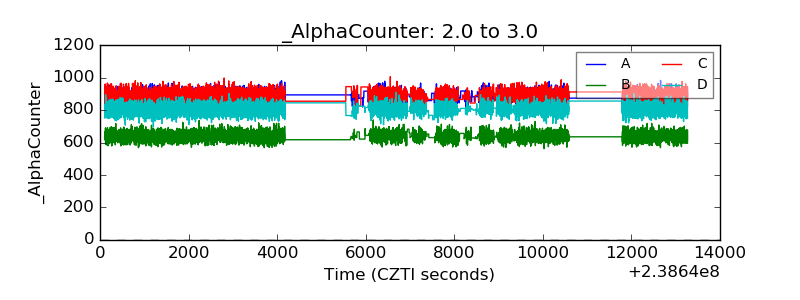 |
| _CPM_Rate | 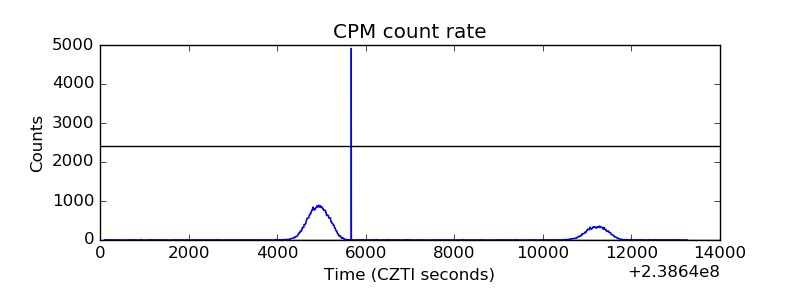 |
| CZT Counter | 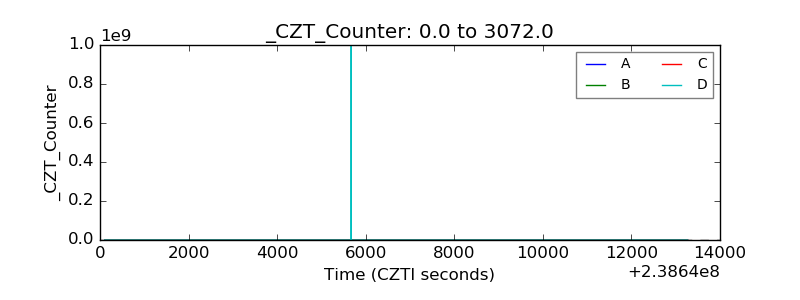 |
| +2.5 Volts monitor |  |
| +5 Volts monitor |  |
| _ROLL_ROT | 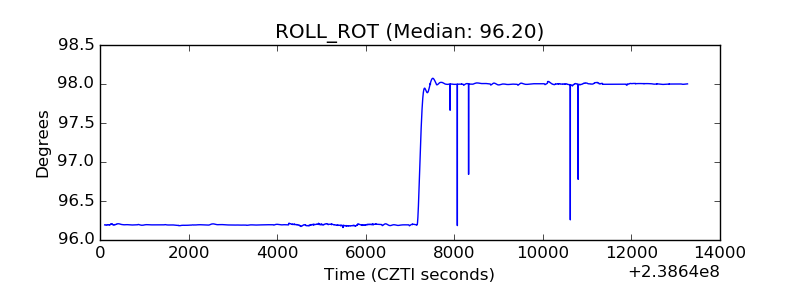 |
| _Roll_DEC | 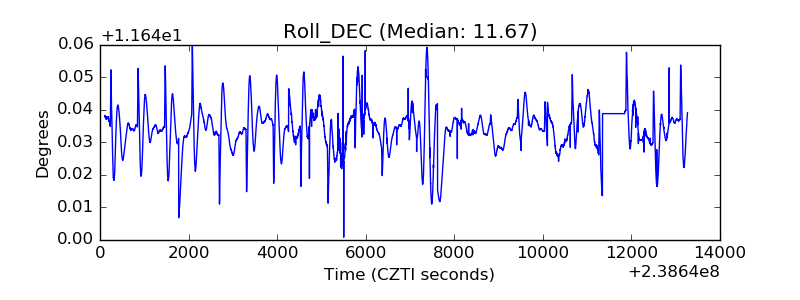 |
| _Roll_RA | 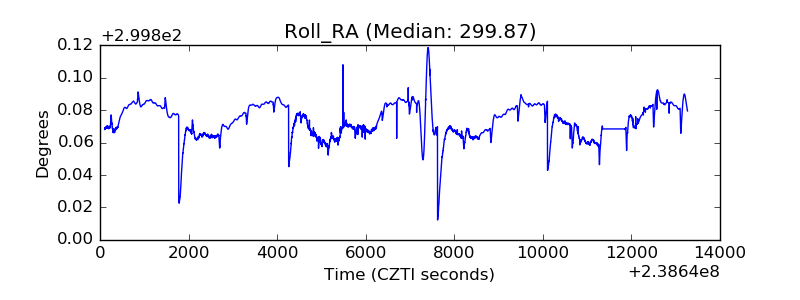 |
| Veto Counter | 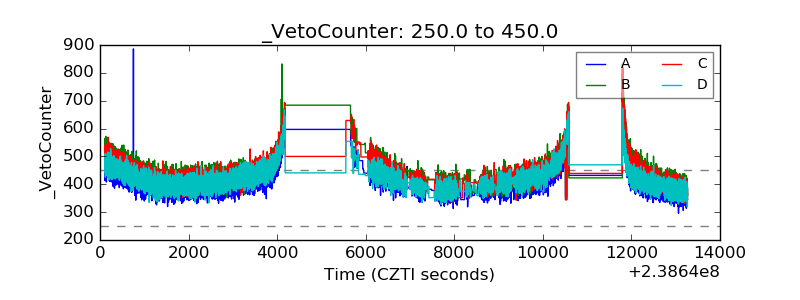 |