| Param | Original file | Final file |
|---|---|---|
| Filename | modeM0/AS1A03_117T06_9000001404_09859cztM0_level2.evt | modeM0/AS1A03_117T06_9000001404_09859cztM0_level2_quad_clean.evt |
| Size (bytes) | 178,346,880 | 35,668,800 |
| Size | 170.1 MB | 34.0 MB |
| Events in quadrant A | 1,270,808 | 223,664 |
| Events in quadrant B | 1,330,956 | 227,425 |
| Events in quadrant C | 1,348,404 | 215,583 |
| Events in quadrant D | 1,264,704 | 220,225 |
| Mode M9 | |||
|---|---|---|---|
| Quadrant | BADHDUFLAG | Total packets | Discarded packets |
| A | 0 | 9 | 3 |
| B | 0 | 9 | 1 |
| C | 0 | 9 | 2 |
| D | 0 | 9 | 3 |
| Mode M0 | |||
|---|---|---|---|
| Quadrant | BADHDUFLAG | Total packets | Discarded packets |
| A | 0 | 13324 | 7767 |
| B | 0 | 13743 | 8095 |
| C | 0 | 15878 | 10139 |
| D | 0 | 13455 | 7805 |
| Mode SS | |||
|---|---|---|---|
| Quadrant | BADHDUFLAG | Total packets | Discarded packets |
| A | 0 | 132 | 76 |
| B | 0 | 133 | 85 |
| C | 0 | 134 | 74 |
| D | 0 | 134 | 80 |
| Quadrant | Total seconds | Saturated seconds | Saturation percentage |
|---|---|---|---|
| A | 2713 | 21 | 0.774051% |
| B | 2674 | 54 | 2.019447% |
| C | 2593 | 36 | 1.388353% |
| D | 2734 | 8 | 0.292612% |
Noise dominated data is calculated using 1-second bins in cleaned event files. If a bin has >2000 counts, and if more than 50% of those come from <1% of pixels, then it is considered to be noise-dominated and hence unusable.
| Quadrant | # 1 sec bins | Bins with >0 counts | Bins with >2000 counts | High rate bins dominated by noise | Noise dominated (total time) | Noise dominated (detector-on time) | Marked lightcurve |
|---|---|---|---|---|---|---|---|
| A | 7562 | 3634 | 0 | 0 | 0.00% | 0.00% | 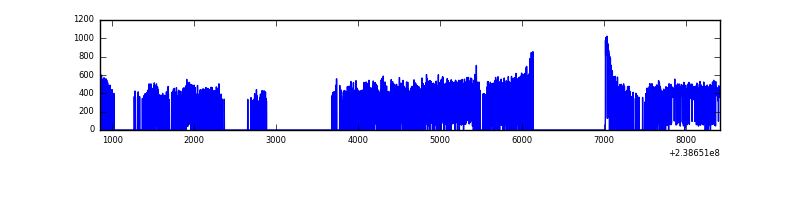 |
| B | 7562 | 3552 | 8 | 8 | 0.11% | 0.23% | 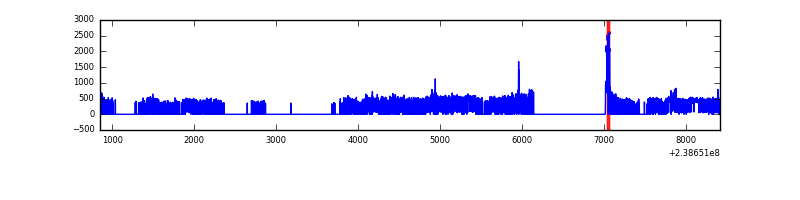 |
| C | 7558 | 3478 | 5 | 5 | 0.07% | 0.14% | 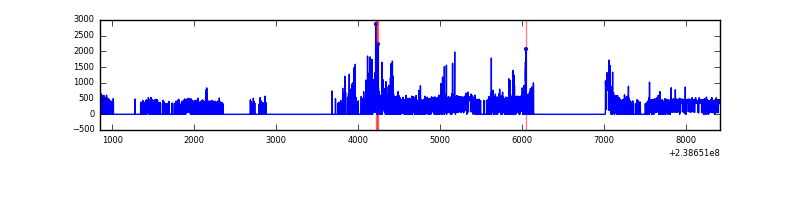 |
| D | 7561 | 3653 | 1 | 1 | 0.01% | 0.03% | 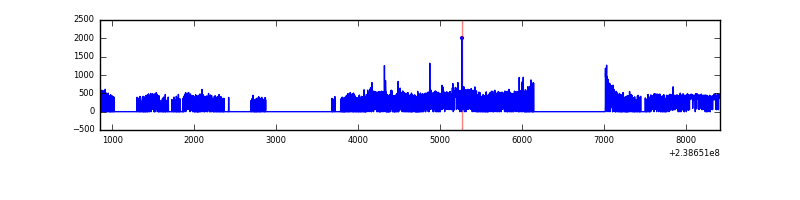 |
Top three noisy pixels from each quadrant. If the there are fewer than three noisy pixels in the level2.evt file, extra rows are filled as -1
| Pixel properties | Quadrant properties | ||||||
|---|---|---|---|---|---|---|---|
| Quadrant | DetID | PixID | Counts | Sigma | Mean | Median | Sigma |
| A | 0 | 226 | 3060 | 39.82 | 330 | 323 | 68.7 |
| A | 12 | 194 | 2611 | 33.28 | 330 | 323 | 68.7 |
| A | 8 | 4 | 1707 | 20.13 | 330 | 323 | 68.7 |
| B | 4 | 81 | 53596 | 829.15 | 322 | 315 | 64.3 |
| B | 0 | 229 | 21541 | 330.32 | 322 | 315 | 64.3 |
| B | 12 | 111 | 7378 | 109.91 | 322 | 315 | 64.3 |
| C | 4 | 254 | 134852 | 1834.55 | 306 | 307 | 73.3 |
| C | 14 | 234 | 16325 | 218.41 | 306 | 307 | 73.3 |
| C | 13 | 61 | 2329 | 27.57 | 306 | 307 | 73.3 |
| D | 10 | 172 | 22649 | 263.76 | 320 | 313 | 84.7 |
| D | 2 | 234 | 11022 | 126.46 | 320 | 313 | 84.7 |
| D | 1 | 52 | 8198 | 93.11 | 320 | 313 | 84.7 |
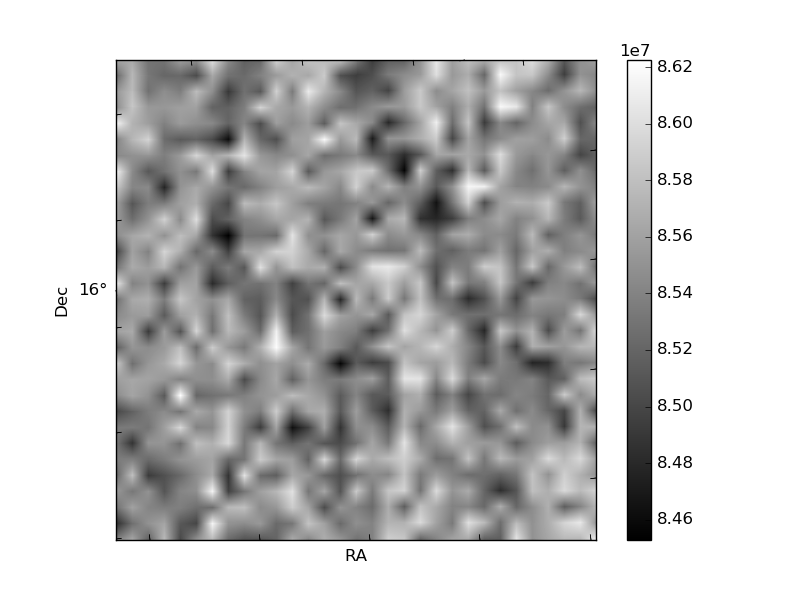
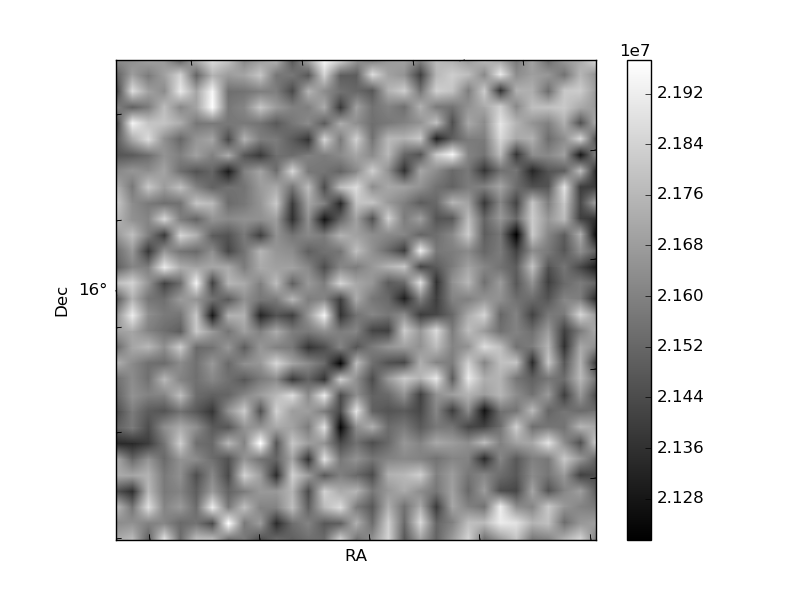
Histogram calculated using DETX and DETY for each event in the final _common_clean file
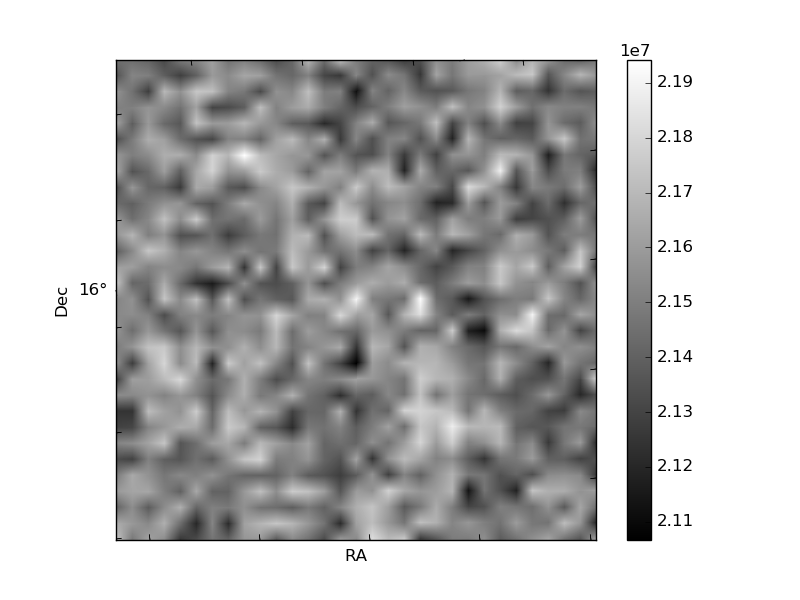
| Quadrant A | 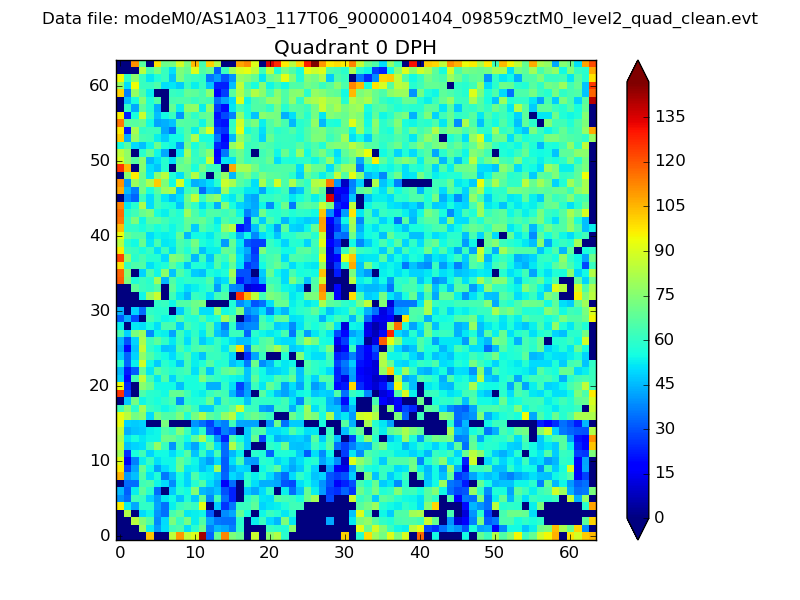 |
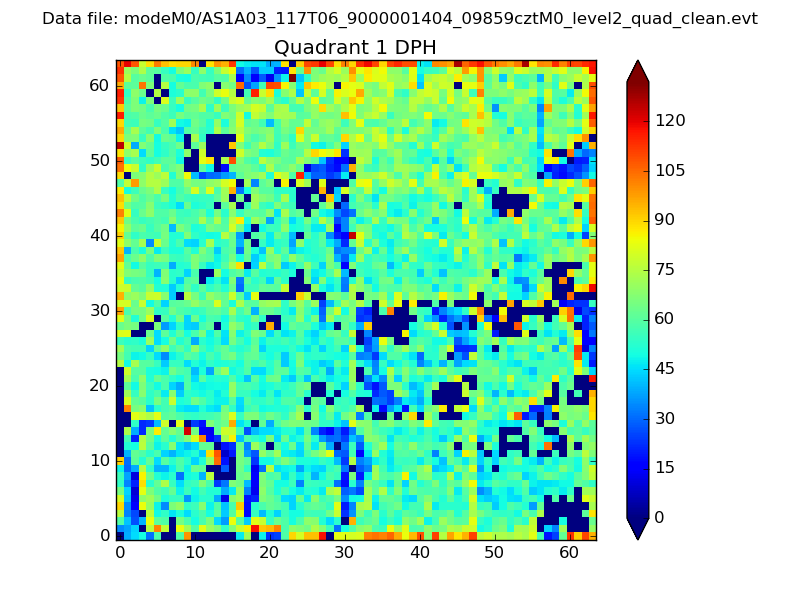 |
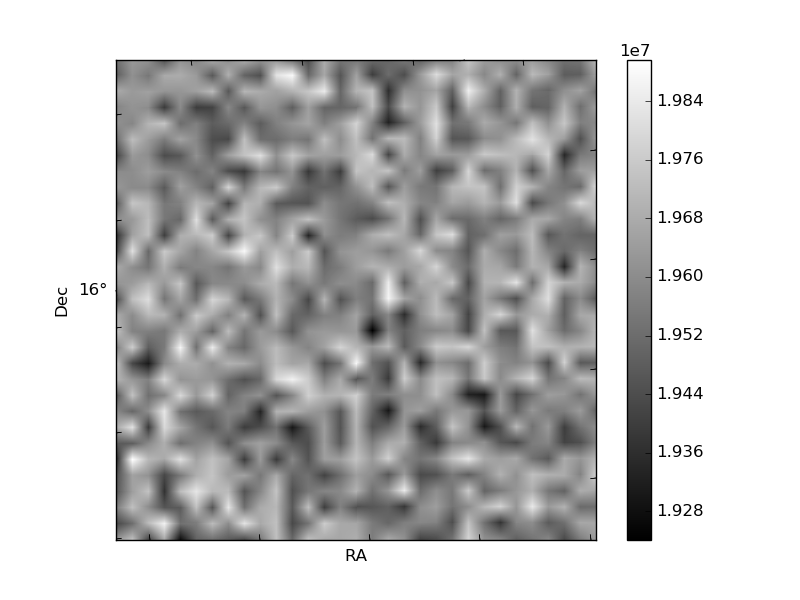
Quadrant B |
|---|---|---|---|
| Quadrant D |  |
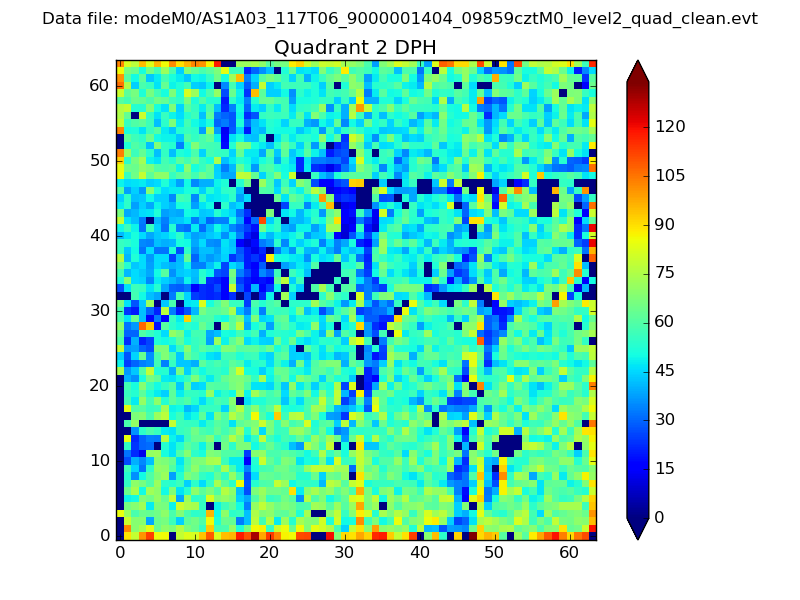 |
Quadrant C |
| Plot type | Count rate plots | Images |
|---|---|---|
| Comparison with Poisson distribution Blue bars denote a histogram of data divided into 1 sec bins. Red curve is a Poisson curve with rate = median count rate of data. |
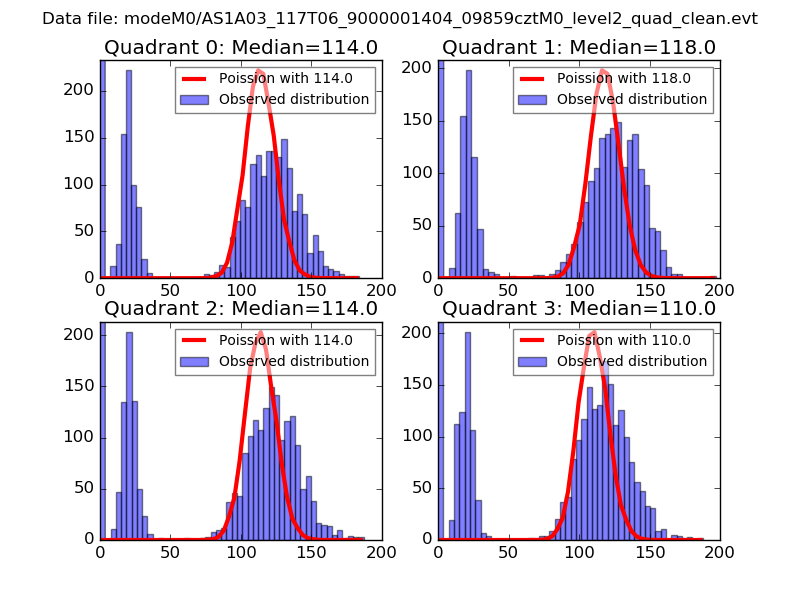 |
 |
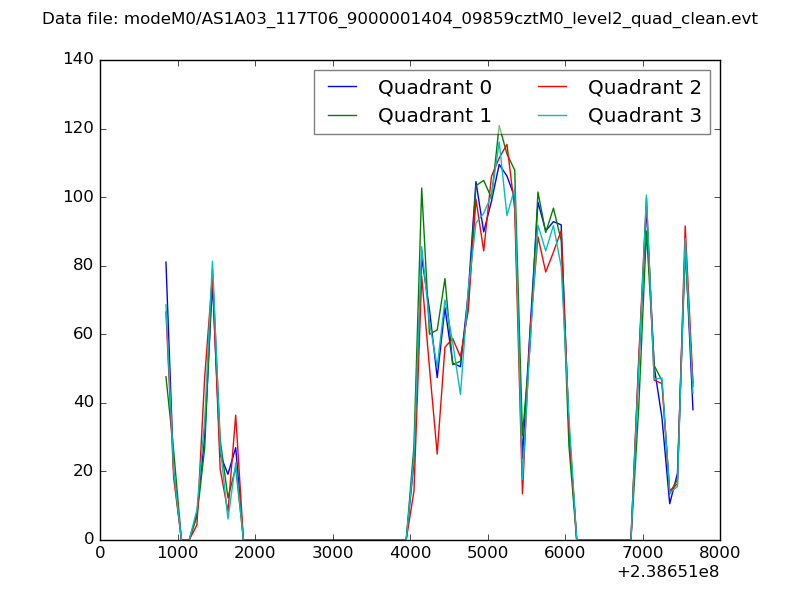
| Quadrant-wise count rates Data is divided into 100 sec bins |
 |
|
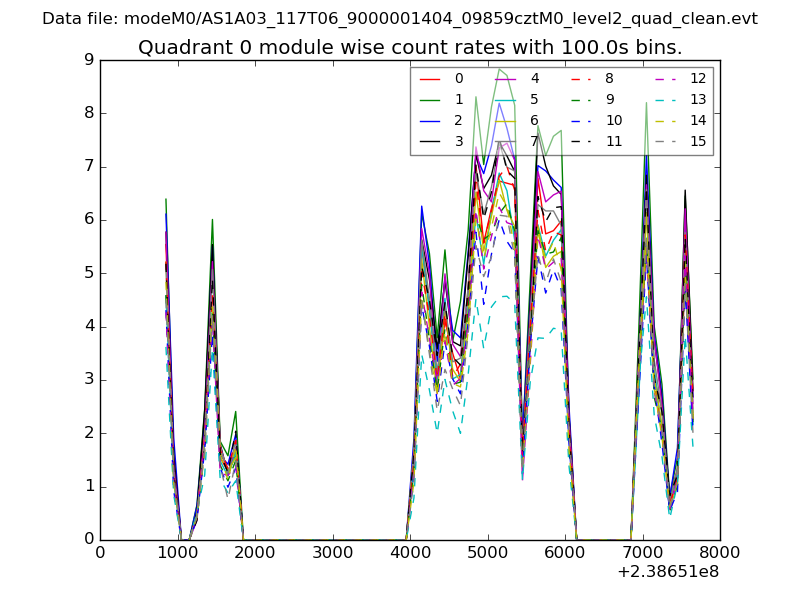
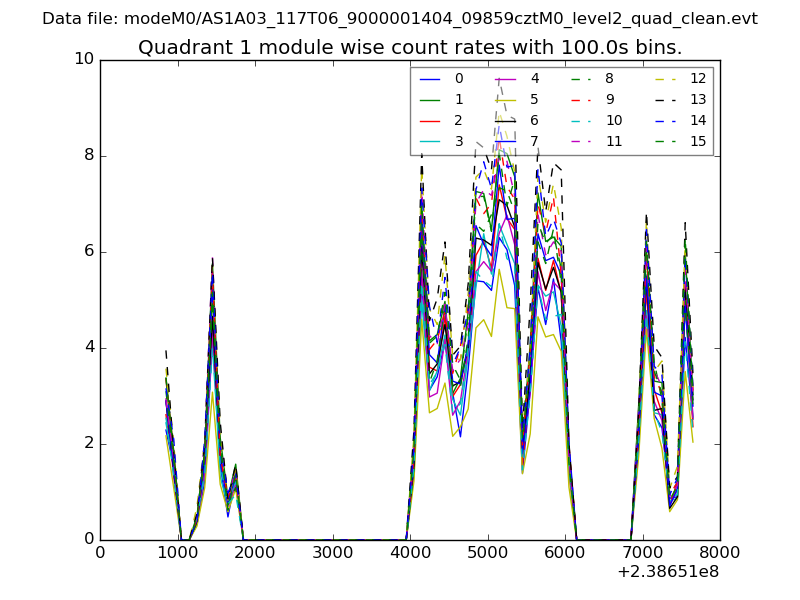
| Module-wise count rates for Quadrant A Data is divided into 100 sec bins |
 |
 |
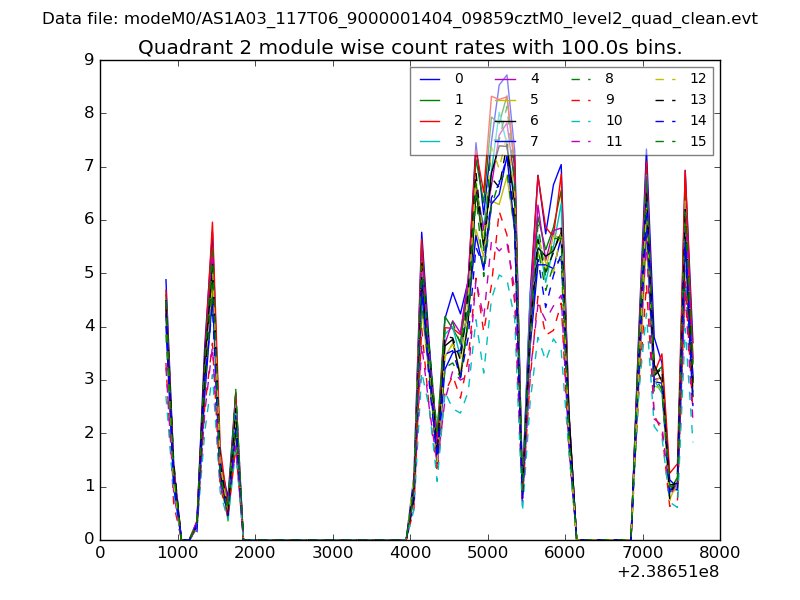
| Module-wise count rates for Quadrant B Data is divided into 100 sec bins |
 |
 |
| Module-wise count rates for Quadrant C Data is divided into 100 sec bins |
 |
 |
| Module-wise count rates for Quadrant D Data is divided into 100 sec bins |
 |
 |
| Parameter | Plot |
|---|---|
| CZT HV Monitor | 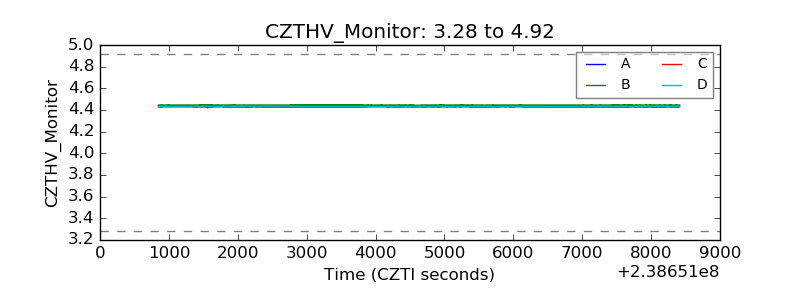 |
| D_VDD | 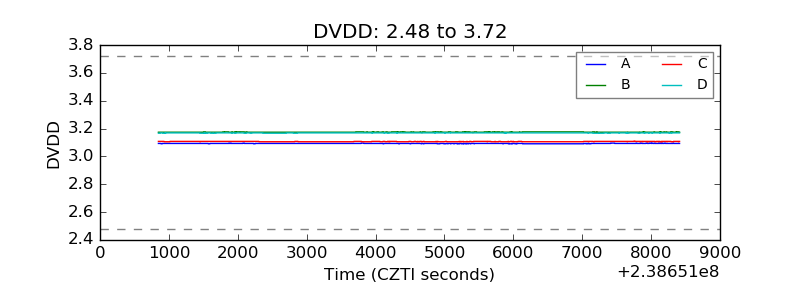 |
| Temperature 1 | 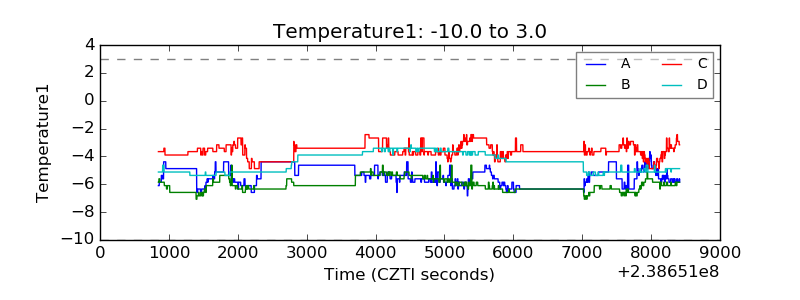 |
| Veto HV Monitor | 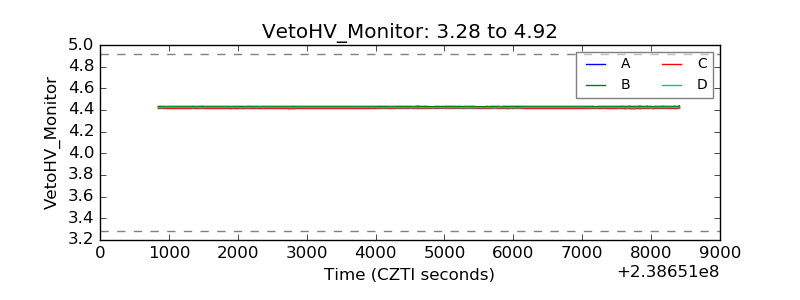 |
| Veto LLD | 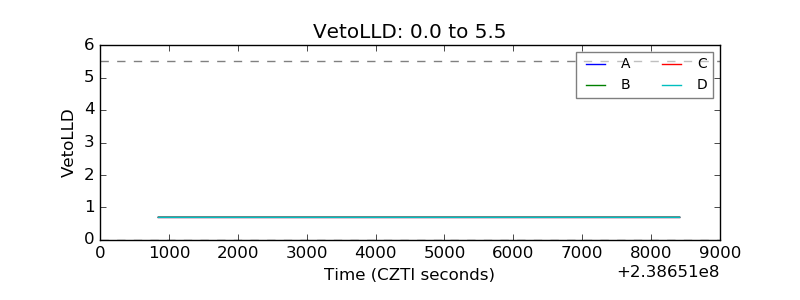 |
| Alpha Counter | 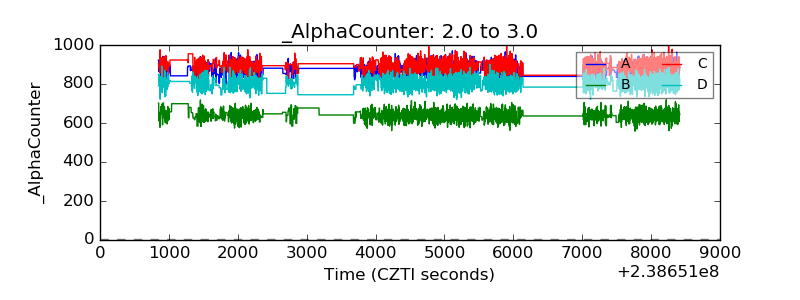 |
| _CPM_Rate | 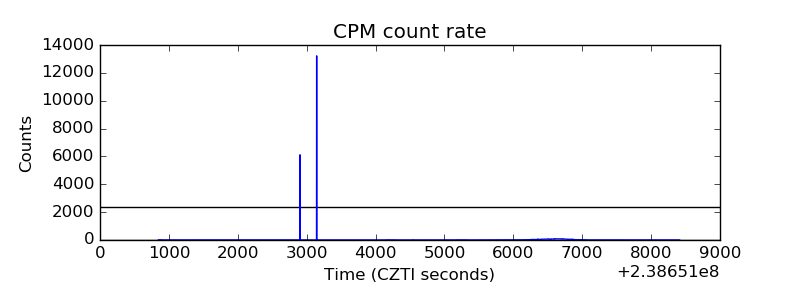 |
| CZT Counter | 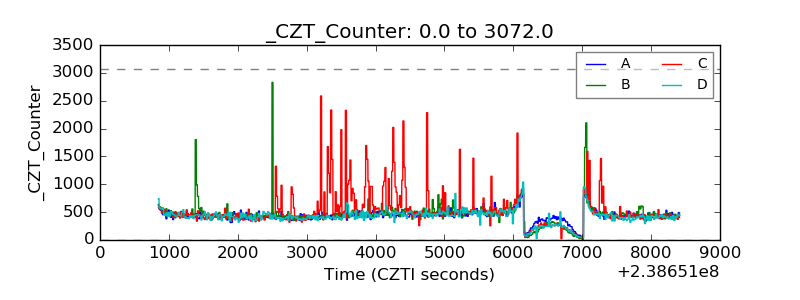 |
| +2.5 Volts monitor | 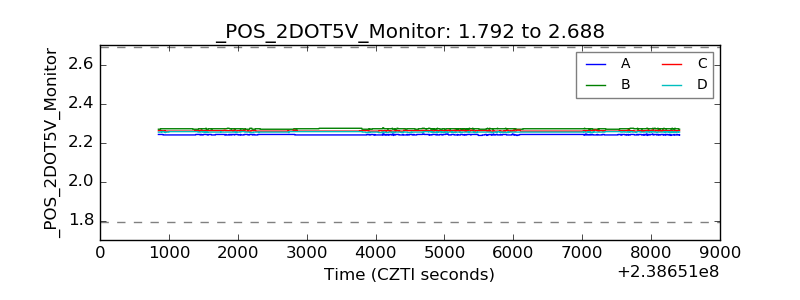 |
| +5 Volts monitor | 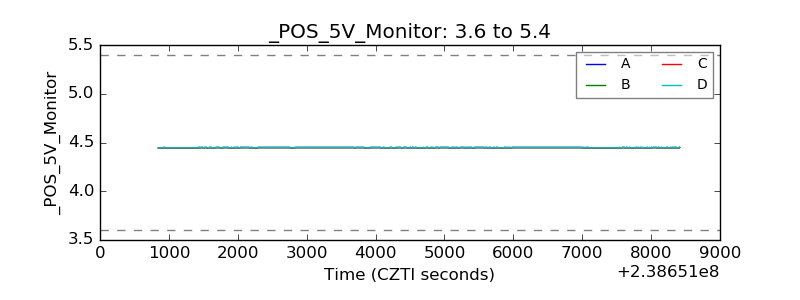 |
| _ROLL_ROT | 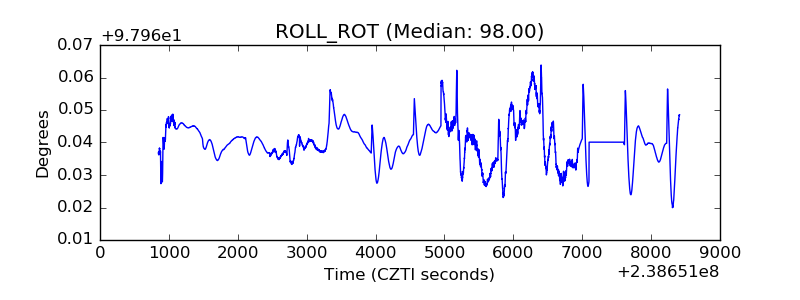 |
| _Roll_DEC | 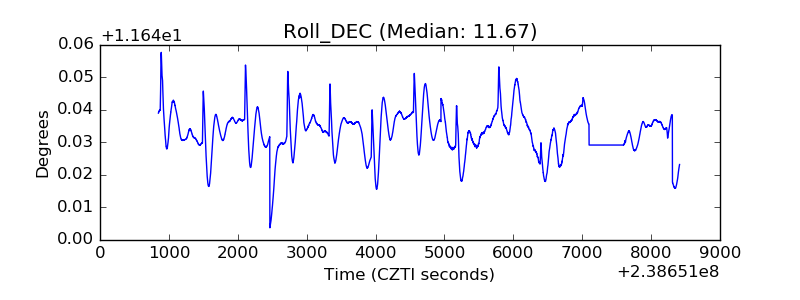 |
| _Roll_RA | 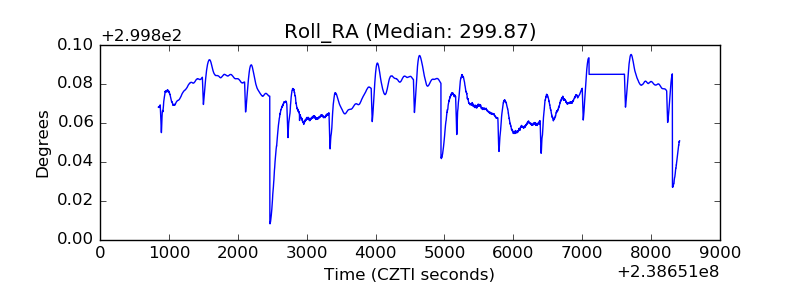 |
| Veto Counter | 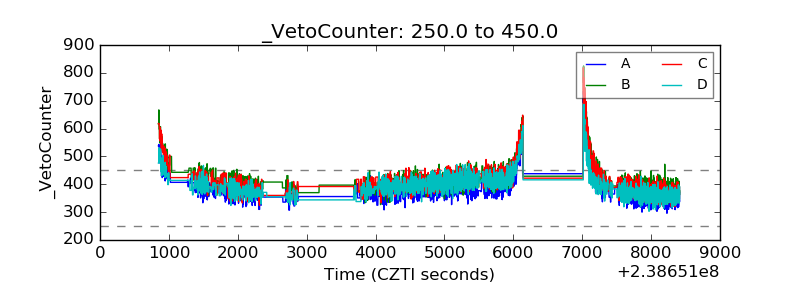 |