| Param | Original file | Final file |
|---|---|---|
| Filename | modeM0/AS1A03_117T06_9000001404_09861cztM0_level2.evt | modeM0/AS1A03_117T06_9000001404_09861cztM0_level2_quad_clean.evt |
| Size (bytes) | 1,581,096,960 | 272,036,160 |
| Size | 1.5 GB | 259.4 MB |
| Events in quadrant A | 10,950,054 | 1,666,497 |
| Events in quadrant B | 11,378,583 | 1,712,695 |
| Events in quadrant C | 12,660,611 | 1,652,455 |
| Events in quadrant D | 11,308,037 | 1,593,118 |
| Mode M9 | |||
|---|---|---|---|
| Quadrant | BADHDUFLAG | Total packets | Discarded packets |
| A | 0 | 25 | 0 |
| B | 0 | 25 | 0 |
| C | 0 | 25 | 0 |
| D | 0 | 25 | 0 |
| Mode M0 | |||
|---|---|---|---|
| Quadrant | BADHDUFLAG | Total packets | Discarded packets |
| A | 0 | 49136 | 528 |
| B | 0 | 49755 | 555 |
| C | 0 | 54580 | 703 |
| D | 0 | 50763 | 530 |
| Mode SS | |||
|---|---|---|---|
| Quadrant | BADHDUFLAG | Total packets | Discarded packets |
| A | 0 | 480 | 10 |
| B | 0 | 480 | 10 |
| C | 0 | 480 | 4 |
| D | 0 | 480 | 10 |
| Quadrant | Total seconds | Saturated seconds | Saturation percentage |
|---|---|---|---|
| A | 23477 | 495 | 2.108447% |
| B | 23466 | 591 | 2.518537% |
| C | 23434 | 584 | 2.492105% |
| D | 23474 | 373 | 1.588992% |
Noise dominated data is calculated using 1-second bins in cleaned event files. If a bin has >2000 counts, and if more than 50% of those come from <1% of pixels, then it is considered to be noise-dominated and hence unusable.
| Quadrant | # 1 sec bins | Bins with >0 counts | Bins with >2000 counts | High rate bins dominated by noise | Noise dominated (total time) | Noise dominated (detector-on time) | Marked lightcurve |
|---|---|---|---|---|---|---|---|
| A | 26205 | 23677 | 0 | 0 | 0.00% | 0.00% | 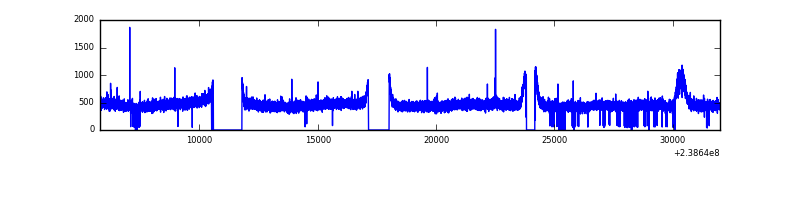 |
| B | 26205 | 23658 | 24 | 24 | 0.09% | 0.10% | 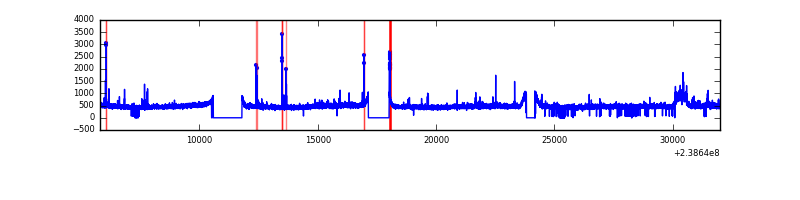 |
| C | 26205 | 23655 | 155 | 155 | 0.59% | 0.66% | 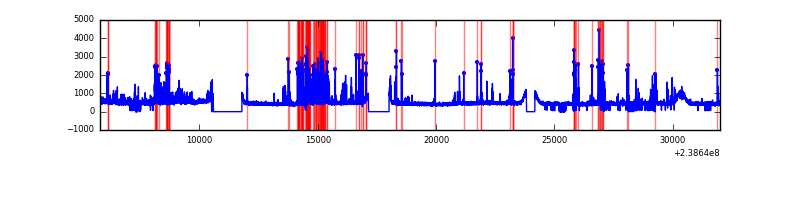 |
| D | 26205 | 23663 | 36 | 36 | 0.14% | 0.15% | 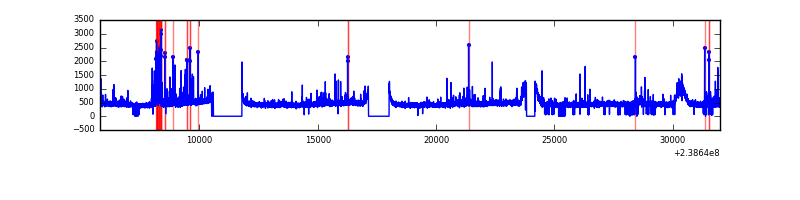 |
Top three noisy pixels from each quadrant. If the there are fewer than three noisy pixels in the level2.evt file, extra rows are filled as -1
| Pixel properties | Quadrant properties | ||||||
|---|---|---|---|---|---|---|---|
| Quadrant | DetID | PixID | Counts | Sigma | Mean | Median | Sigma |
| A | 0 | 226 | 25862 | 40.18 | 2840 | 2782 | 574.4 |
| A | 12 | 194 | 22448 | 34.24 | 2840 | 2782 | 574.4 |
| A | 15 | 174 | 14358 | 20.15 | 2840 | 2782 | 574.4 |
| B | 4 | 81 | 162476 | 293.84 | 2833 | 2760 | 543.5 |
| B | 0 | 229 | 101434 | 181.54 | 2833 | 2760 | 543.5 |
| B | 0 | 85 | 91578 | 163.4 | 2833 | 2760 | 543.5 |
| C | 4 | 254 | 1714745 | 2692.22 | 2737 | 2754 | 635.9 |
| C | 14 | 234 | 255410 | 397.32 | 2737 | 2754 | 635.9 |
| C | 13 | 61 | 20502 | 27.91 | 2737 | 2754 | 635.9 |
| D | 10 | 172 | 288943 | 405.46 | 2720 | 2662 | 706.1 |
| D | 1 | 52 | 276282 | 387.53 | 2720 | 2662 | 706.1 |
| D | 8 | 32 | 199831 | 279.25 | 2720 | 2662 | 706.1 |
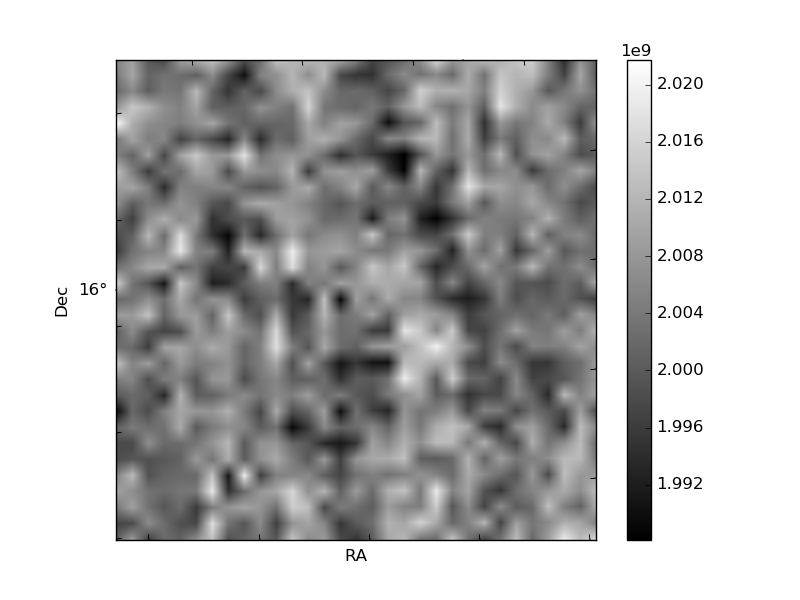
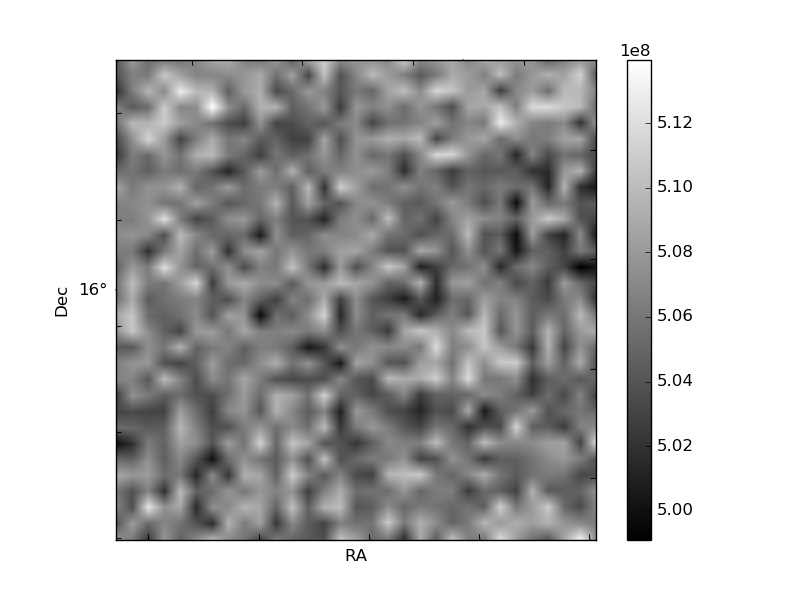
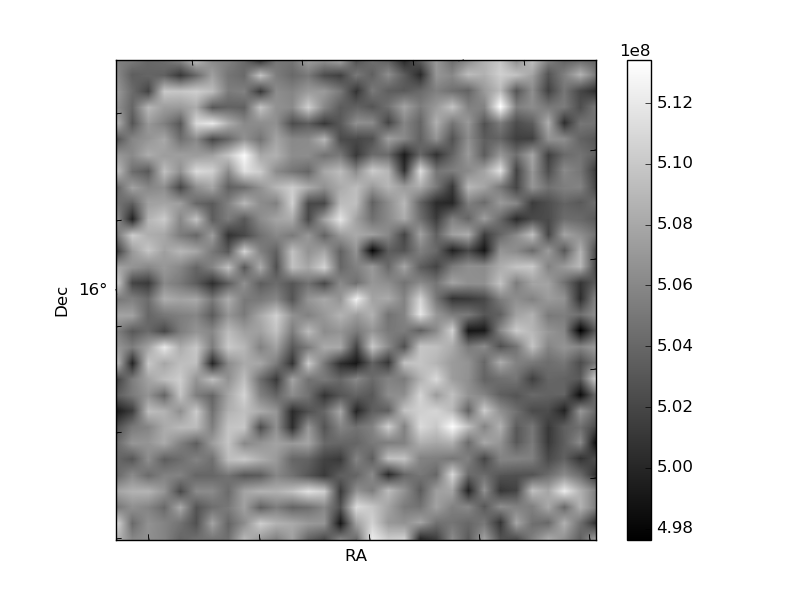
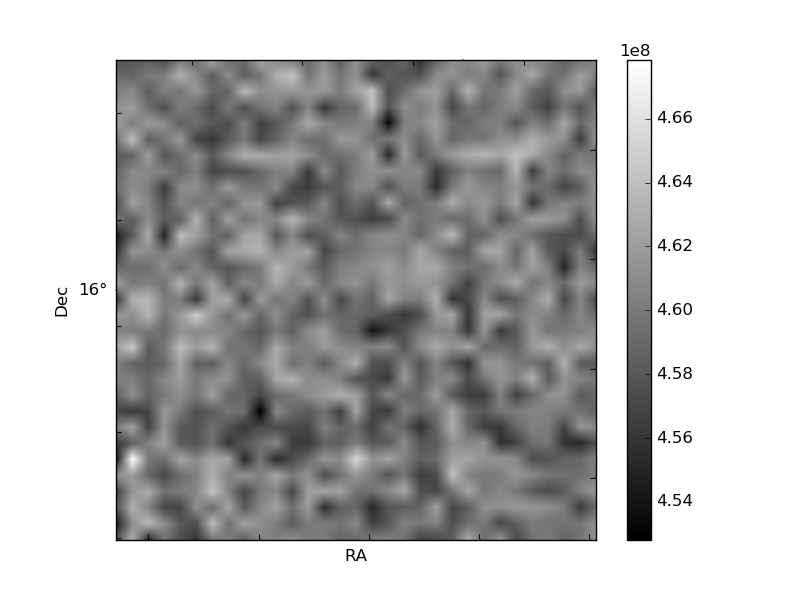
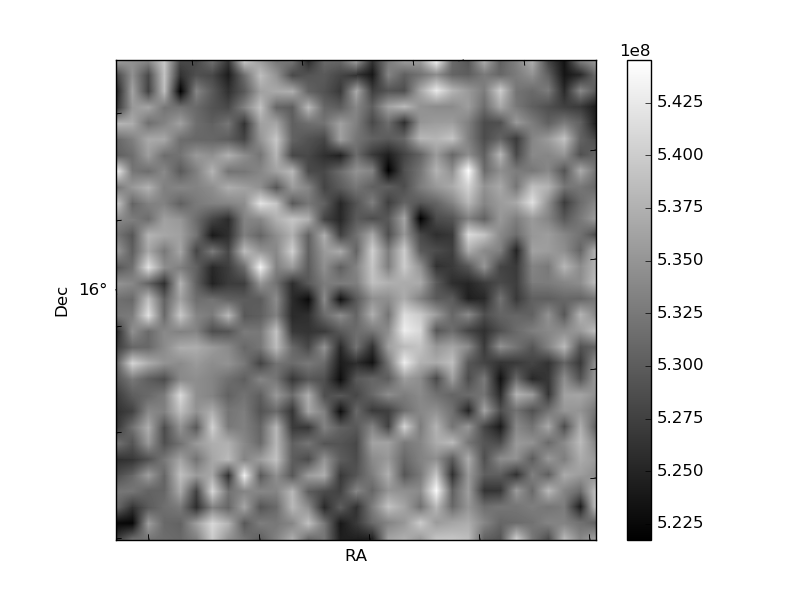
Histogram calculated using DETX and DETY for each event in the final _common_clean file
| Quadrant A | 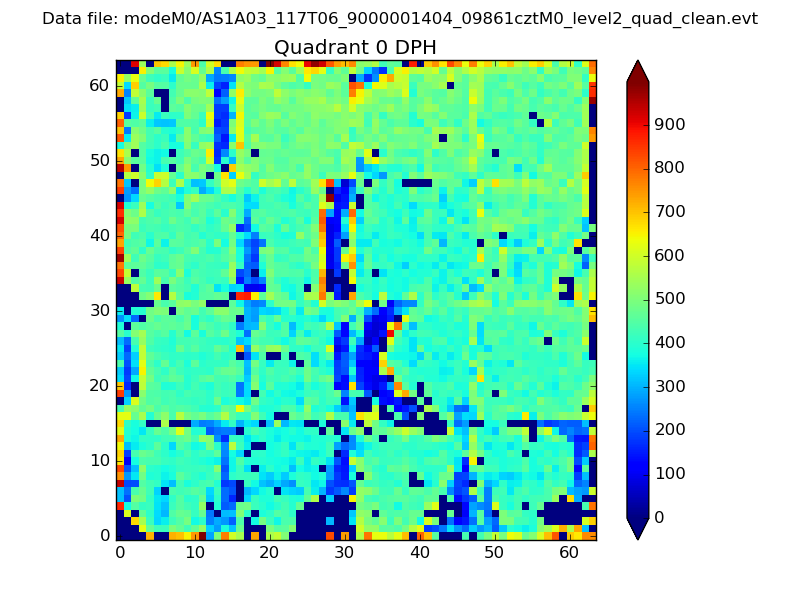 |
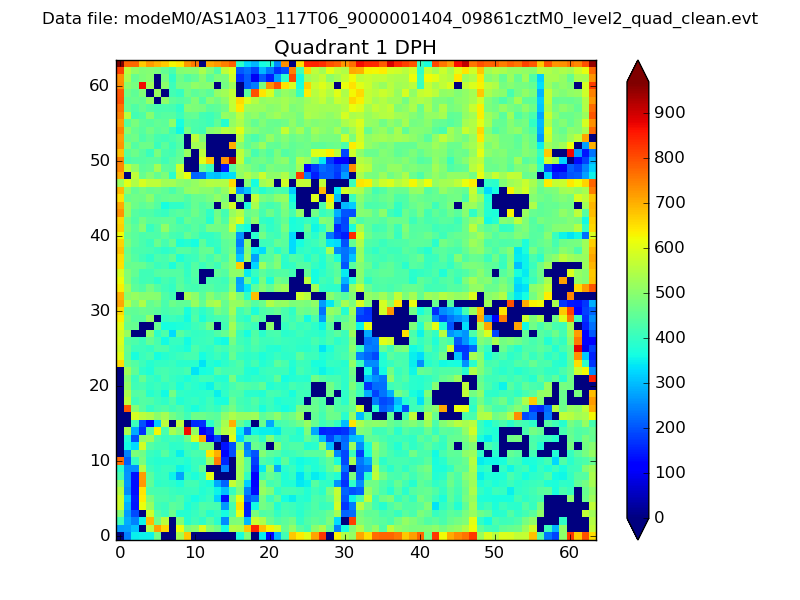 |
Quadrant B |
|---|---|---|---|
| Quadrant D | 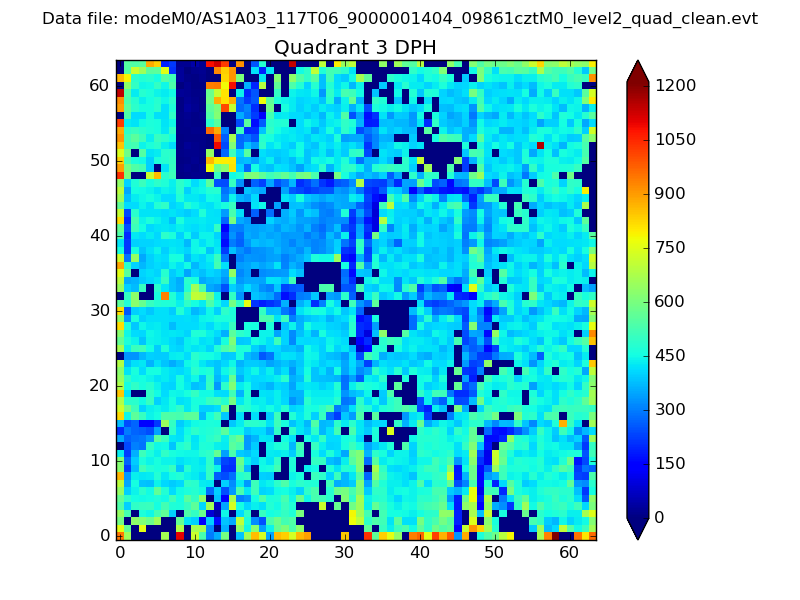 |
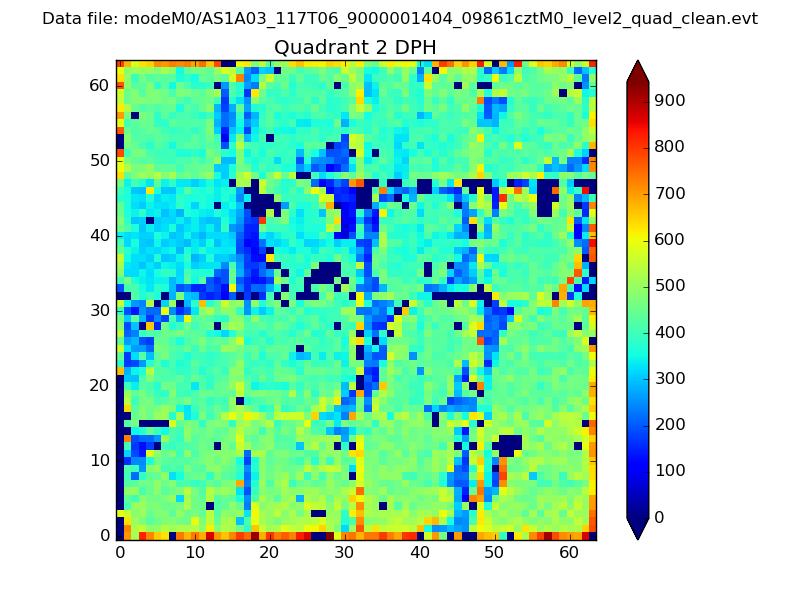 |
Quadrant C |
| Plot type | Count rate plots | Images |
|---|---|---|
| Comparison with Poisson distribution Blue bars denote a histogram of data divided into 1 sec bins. Red curve is a Poisson curve with rate = median count rate of data. |
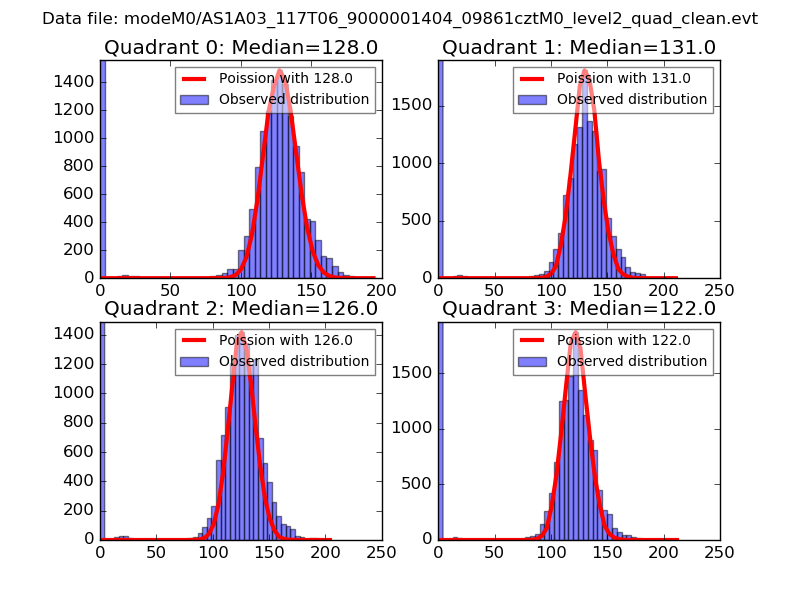 |
 |
| Quadrant-wise count rates Data is divided into 100 sec bins |
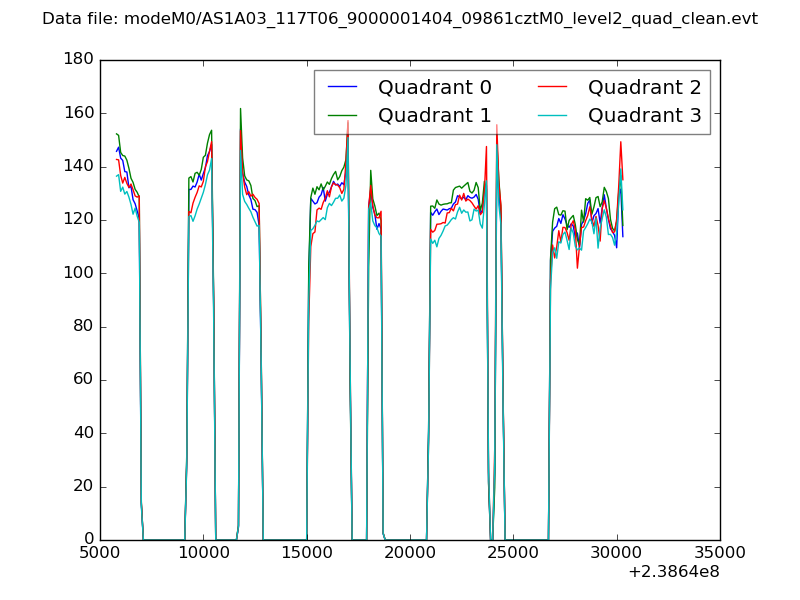 |
|
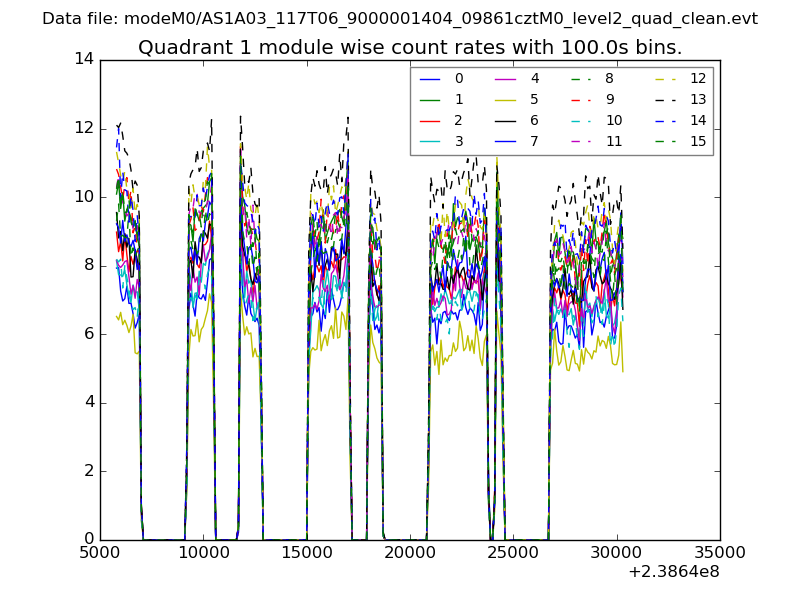
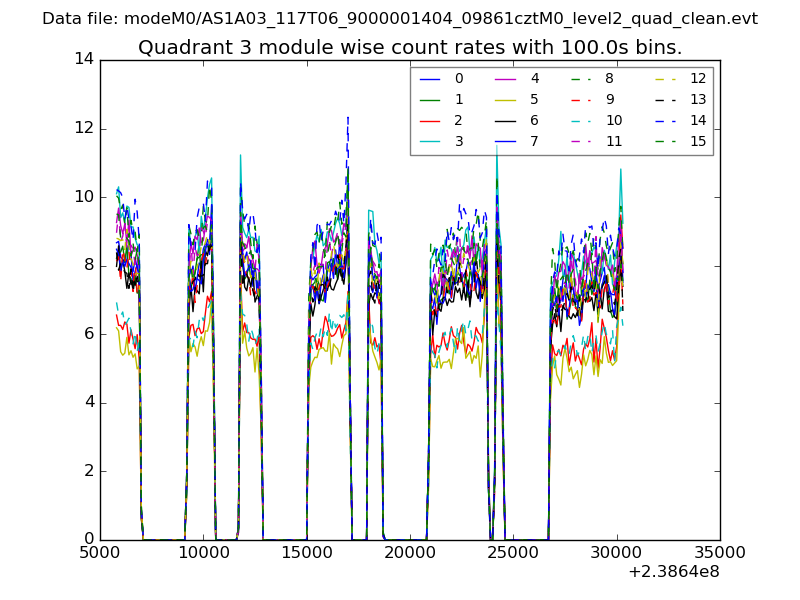
| Module-wise count rates for Quadrant A Data is divided into 100 sec bins |
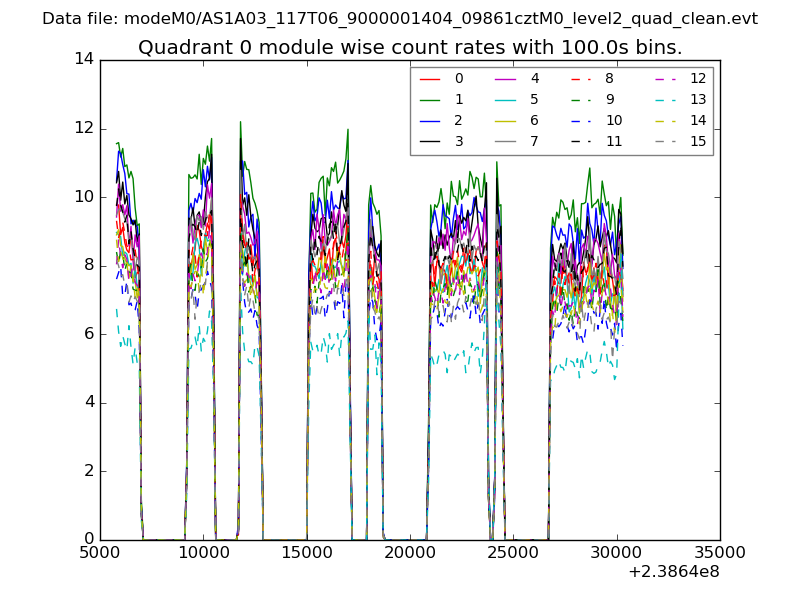 |
 |
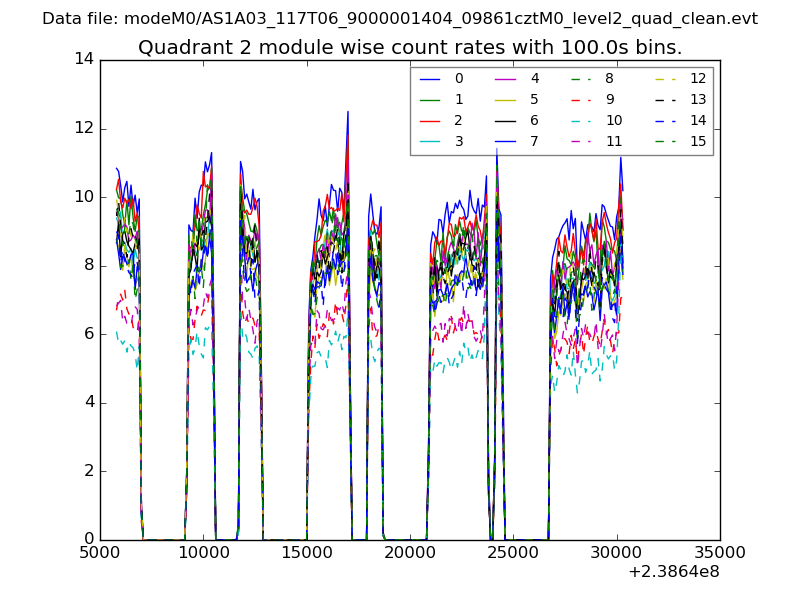
| Module-wise count rates for Quadrant B Data is divided into 100 sec bins |
 |
 |
| Module-wise count rates for Quadrant C Data is divided into 100 sec bins |
 |
 |
| Module-wise count rates for Quadrant D Data is divided into 100 sec bins |
 |
 |
| Parameter | Plot |
|---|---|
| CZT HV Monitor | 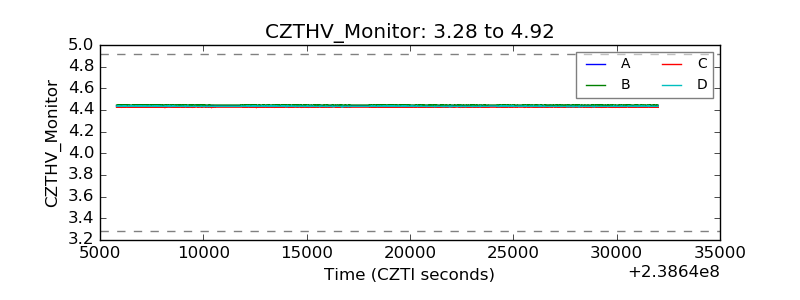 |
| D_VDD | 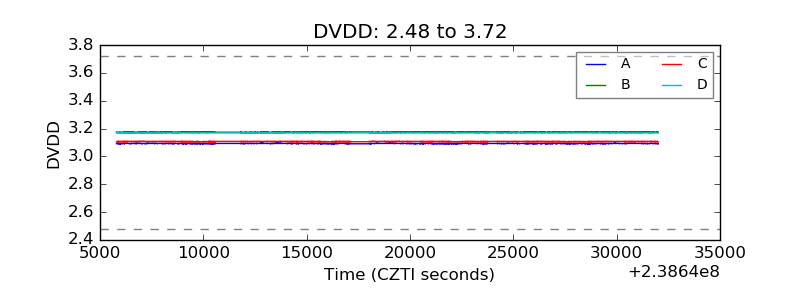 |
| Temperature 1 | 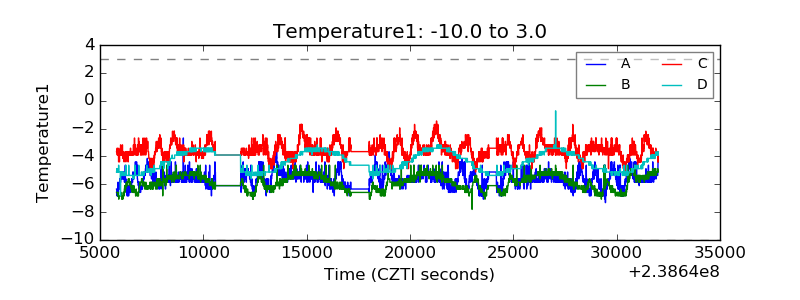 |
| Veto HV Monitor | 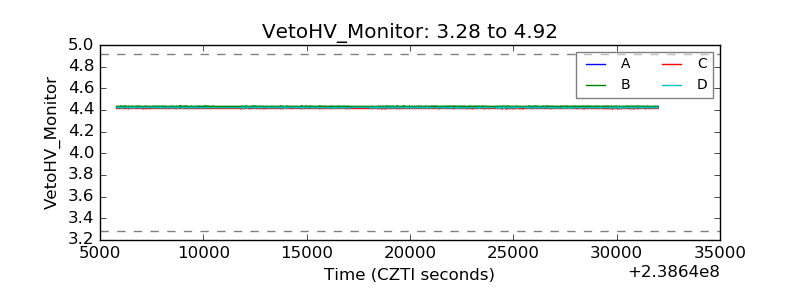 |
| Veto LLD | 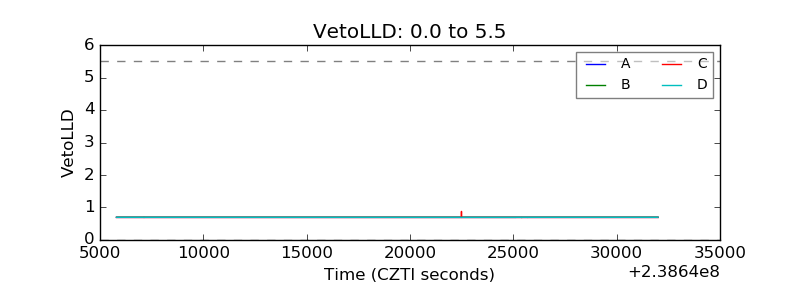 |
| Alpha Counter | 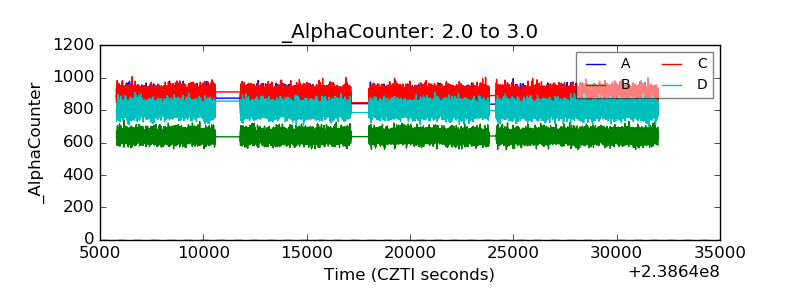 |
| _CPM_Rate | 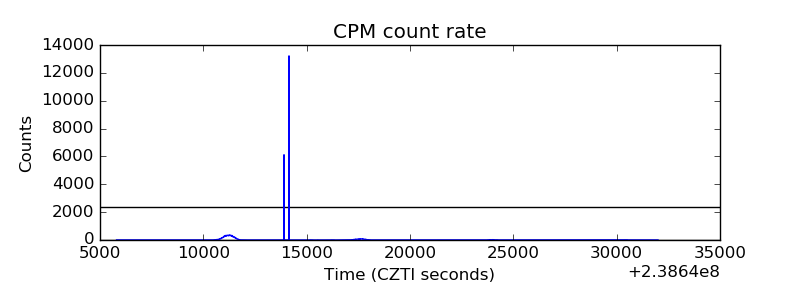 |
| CZT Counter | 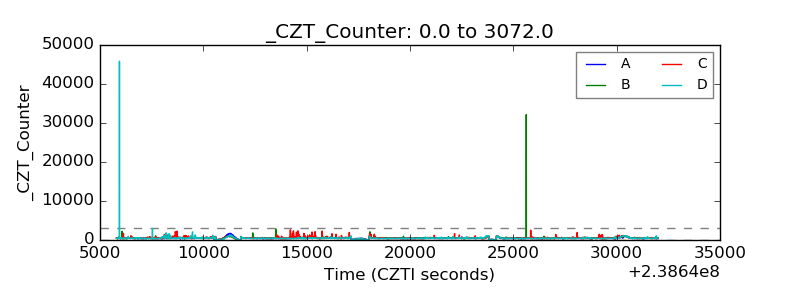 |
| +2.5 Volts monitor |  |
| +5 Volts monitor | 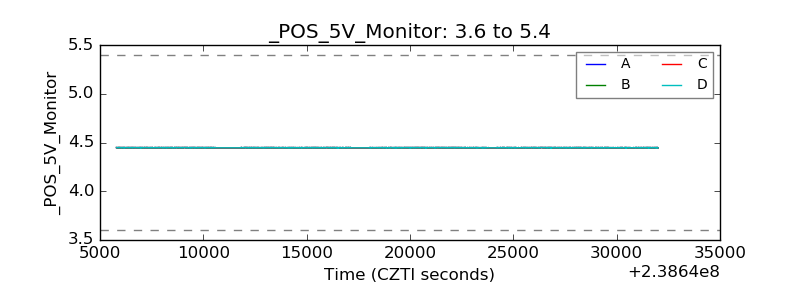 |
| _ROLL_ROT | 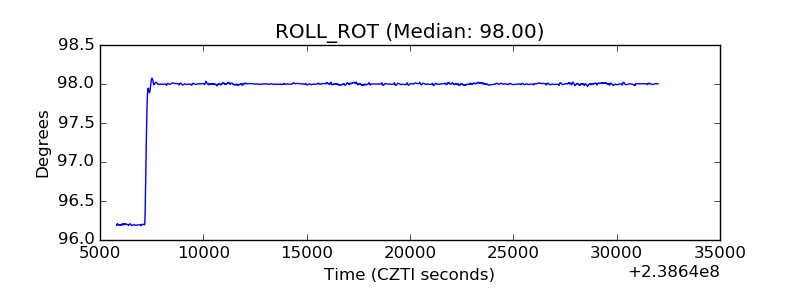 |
| _Roll_DEC | 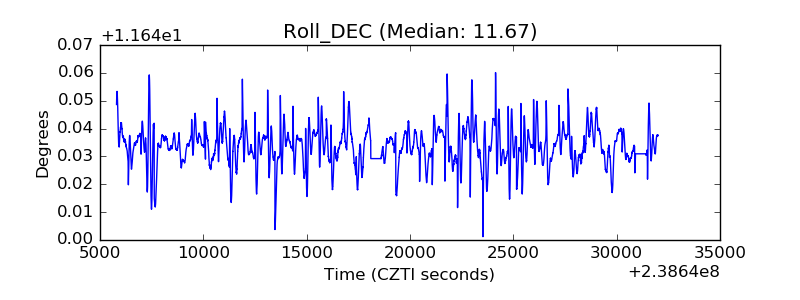 |
| _Roll_RA | 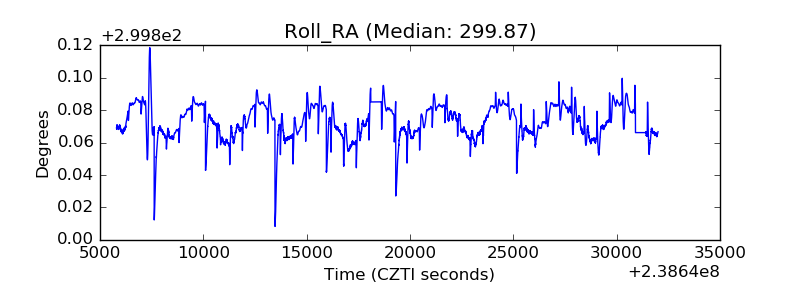 |
| Veto Counter |  |