| Param | Original file | Final file |
|---|---|---|
| Filename | modeM0/AS1A03_117T06_9000001404_09865cztM0_level2.evt | modeM0/AS1A03_117T06_9000001404_09865cztM0_level2_quad_clean.evt |
| Size (bytes) | 1,096,436,160 | 208,247,040 |
| Size | 1.0 GB | 198.6 MB |
| Events in quadrant A | 7,664,333 | 1,308,354 |
| Events in quadrant B | 8,296,887 | 1,325,440 |
| Events in quadrant C | 8,229,709 | 1,282,498 |
| Events in quadrant D | 7,874,758 | 1,232,063 |
| Mode M9 | |||
|---|---|---|---|
| Quadrant | BADHDUFLAG | Total packets | Discarded packets |
| A | 0 | 19 | 1 |
| B | 0 | 19 | 0 |
| C | 0 | 19 | 1 |
| D | 0 | 19 | 0 |
| Mode M0 | |||
|---|---|---|---|
| Quadrant | BADHDUFLAG | Total packets | Discarded packets |
| A | 0 | 37943 | 3509 |
| B | 0 | 39546 | 3833 |
| C | 0 | 40114 | 4084 |
| D | 0 | 39796 | 4263 |
| Mode SS | |||
|---|---|---|---|
| Quadrant | BADHDUFLAG | Total packets | Discarded packets |
| A | 0 | 380 | 22 |
| B | 0 | 380 | 46 |
| C | 0 | 380 | 28 |
| D | 0 | 379 | 30 |
| Quadrant | Total seconds | Saturated seconds | Saturation percentage |
|---|---|---|---|
| A | 16841 | 341 | 2.024820% |
| B | 16752 | 385 | 2.298233% |
| C | 16759 | 428 | 2.553852% |
| D | 16748 | 390 | 2.328636% |
Noise dominated data is calculated using 1-second bins in cleaned event files. If a bin has >2000 counts, and if more than 50% of those come from <1% of pixels, then it is considered to be noise-dominated and hence unusable.
| Quadrant | # 1 sec bins | Bins with >0 counts | Bins with >2000 counts | High rate bins dominated by noise | Noise dominated (total time) | Noise dominated (detector-on time) | Marked lightcurve |
|---|---|---|---|---|---|---|---|
| A | 20563 | 17919 | 0 | 0 | 0.00% | 0.00% | 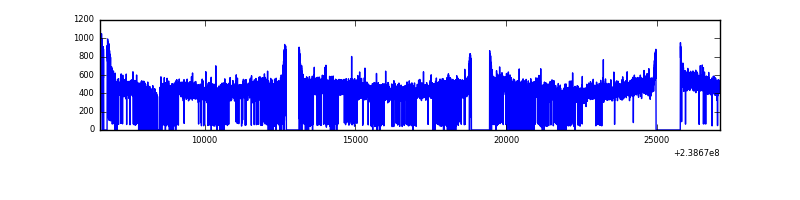 |
| B | 20563 | 17889 | 8 | 8 | 0.04% | 0.04% | 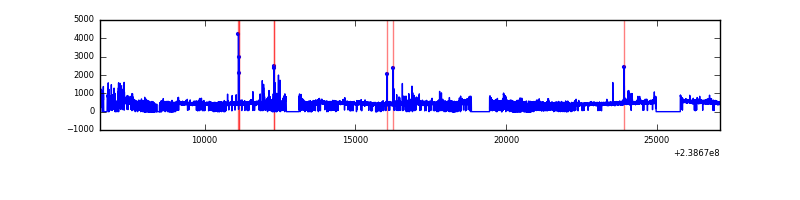 |
| C | 20563 | 17896 | 41 | 41 | 0.20% | 0.23% | 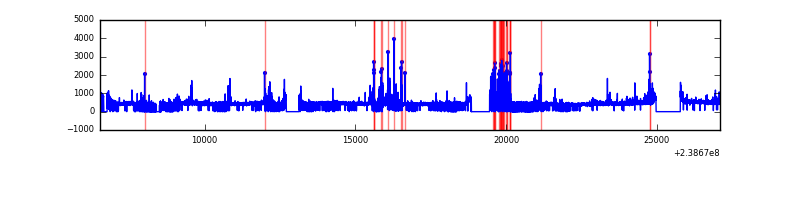 |
| D | 20563 | 17860 | 74 | 74 | 0.36% | 0.41% | 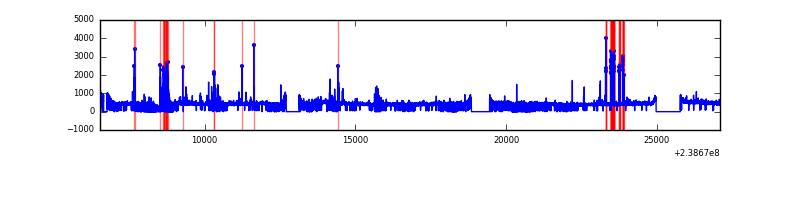 |
Top three noisy pixels from each quadrant. If the there are fewer than three noisy pixels in the level2.evt file, extra rows are filled as -1
| Pixel properties | Quadrant properties | ||||||
|---|---|---|---|---|---|---|---|
| Quadrant | DetID | PixID | Counts | Sigma | Mean | Median | Sigma |
| A | 0 | 226 | 18015 | 39.7 | 1989 | 1944 | 404.8 |
| A | 12 | 194 | 15706 | 33.99 | 1989 | 1944 | 404.8 |
| A | 3 | 137 | 9856 | 19.54 | 1989 | 1944 | 404.8 |
| B | 0 | 85 | 409588 | 1071.37 | 1973 | 1921 | 380.5 |
| B | 4 | 81 | 157271 | 408.27 | 1973 | 1921 | 380.5 |
| B | 12 | 111 | 46348 | 116.76 | 1973 | 1921 | 380.5 |
| C | 4 | 254 | 646171 | 1445.13 | 1920 | 1930 | 445.8 |
| C | 14 | 234 | 55249 | 119.6 | 1920 | 1930 | 445.8 |
| C | 9 | 221 | 26312 | 54.69 | 1920 | 1930 | 445.8 |
| D | 1 | 52 | 293779 | 595.48 | 1901 | 1863 | 490.2 |
| D | 12 | 233 | 207025 | 418.51 | 1901 | 1863 | 490.2 |
| D | 2 | 234 | 75939 | 151.11 | 1901 | 1863 | 490.2 |
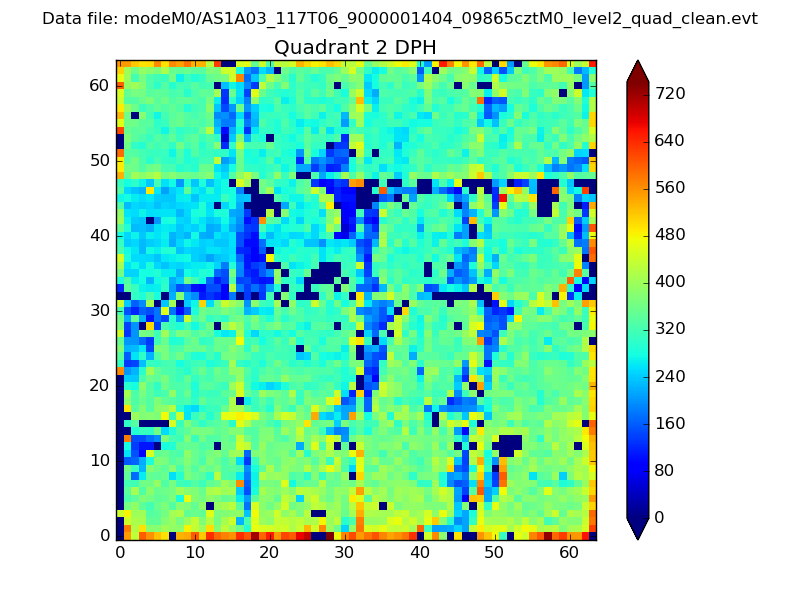
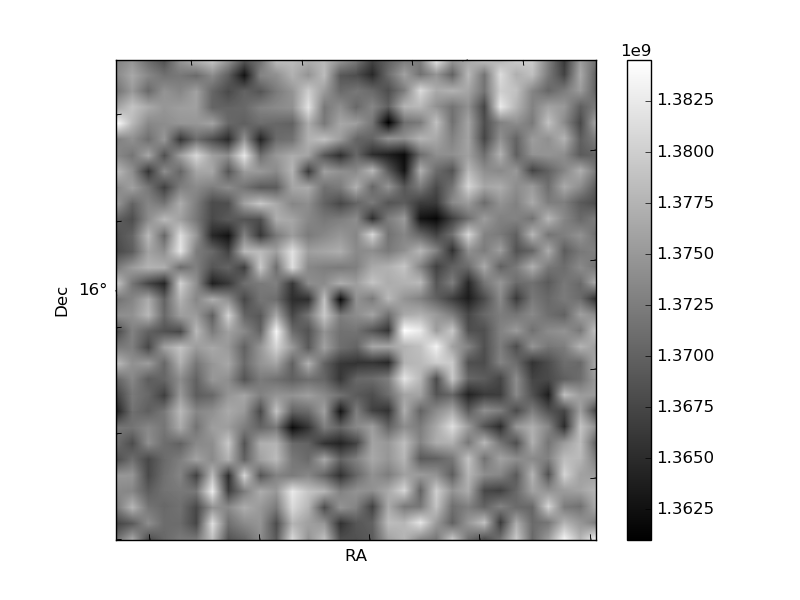
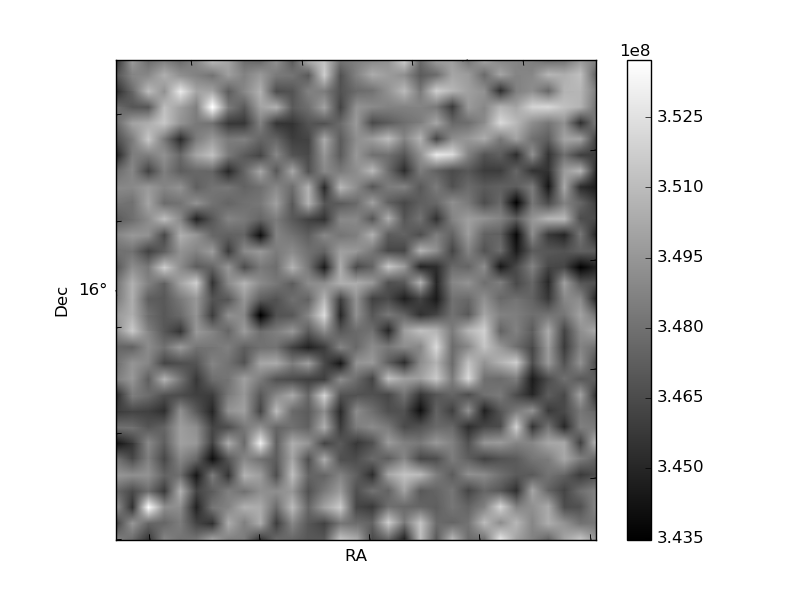
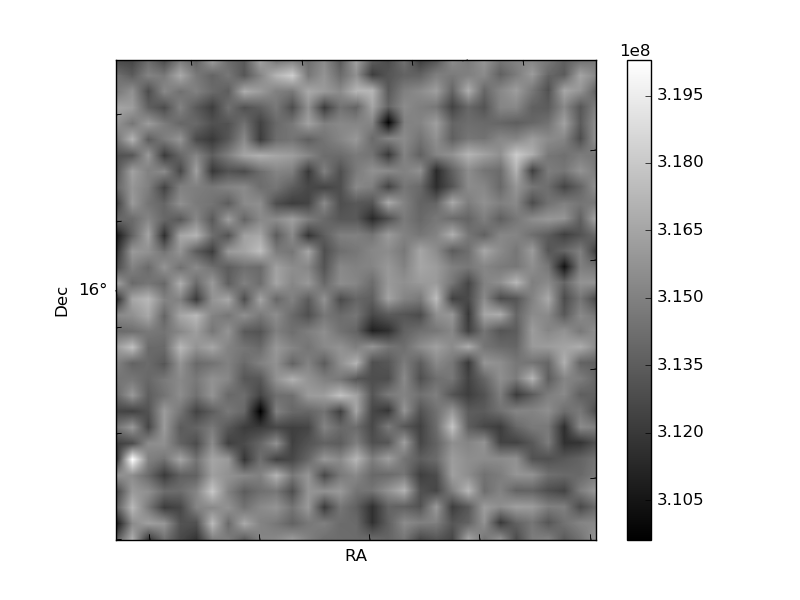
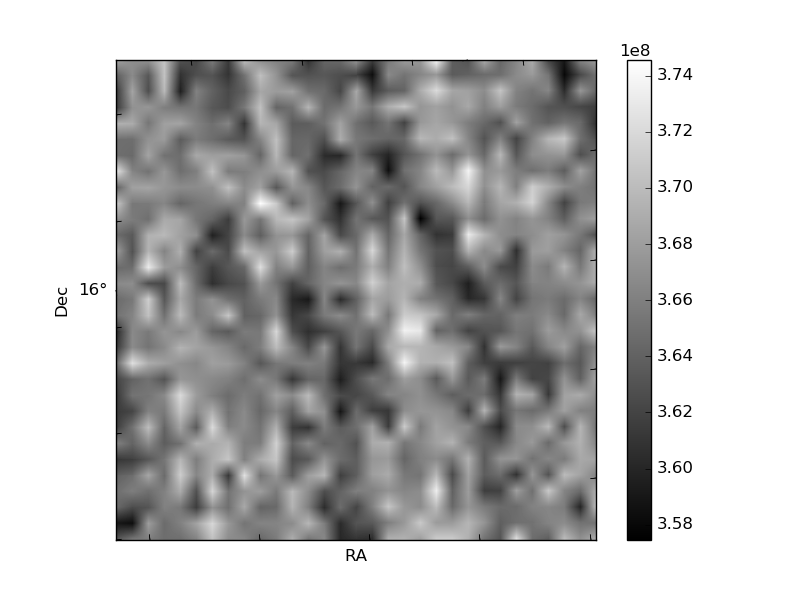
Histogram calculated using DETX and DETY for each event in the final _common_clean file
| Quadrant A | 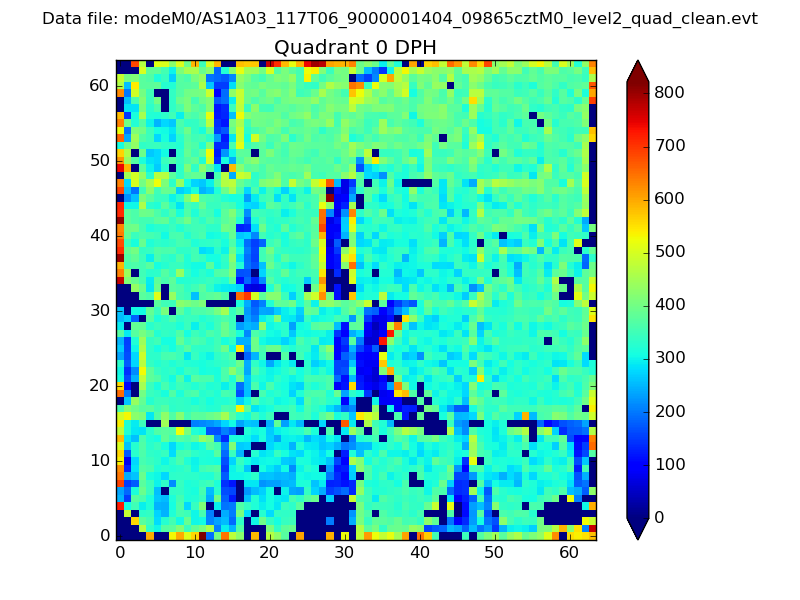 |
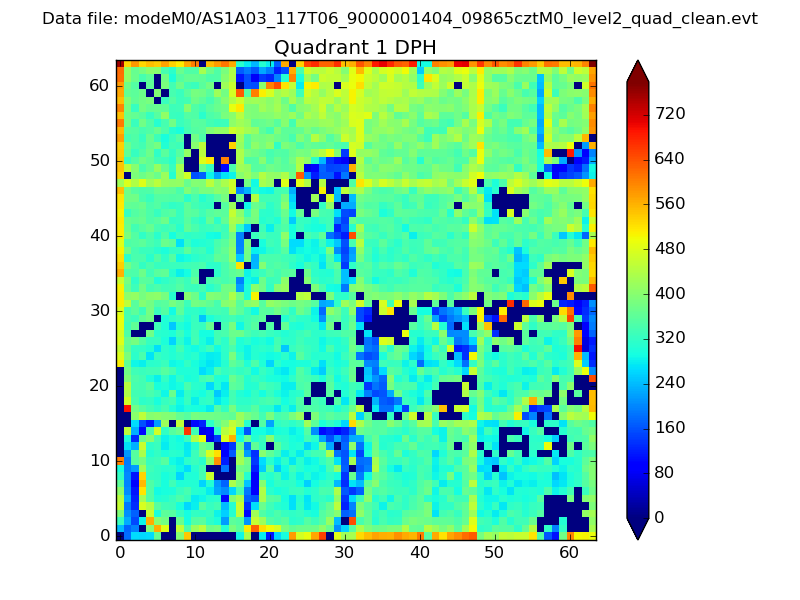 |
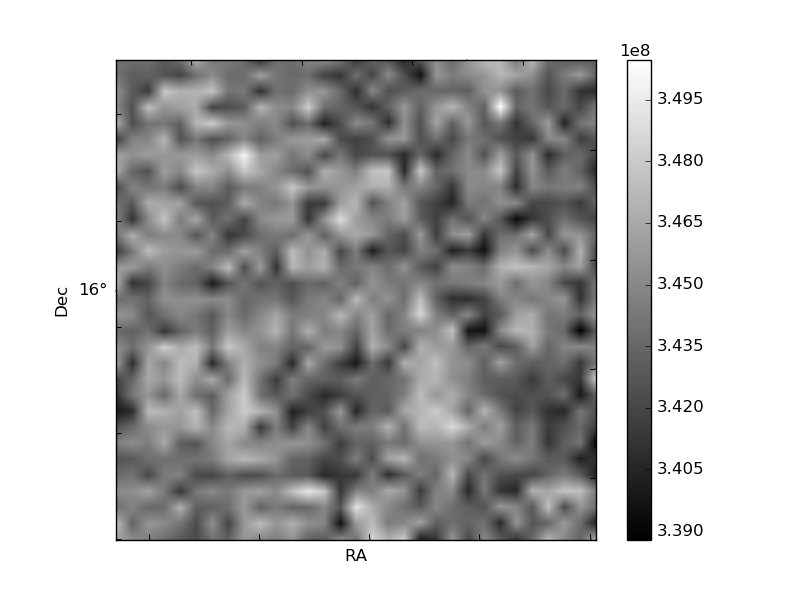
Quadrant B |
|---|---|---|---|
| Quadrant D | 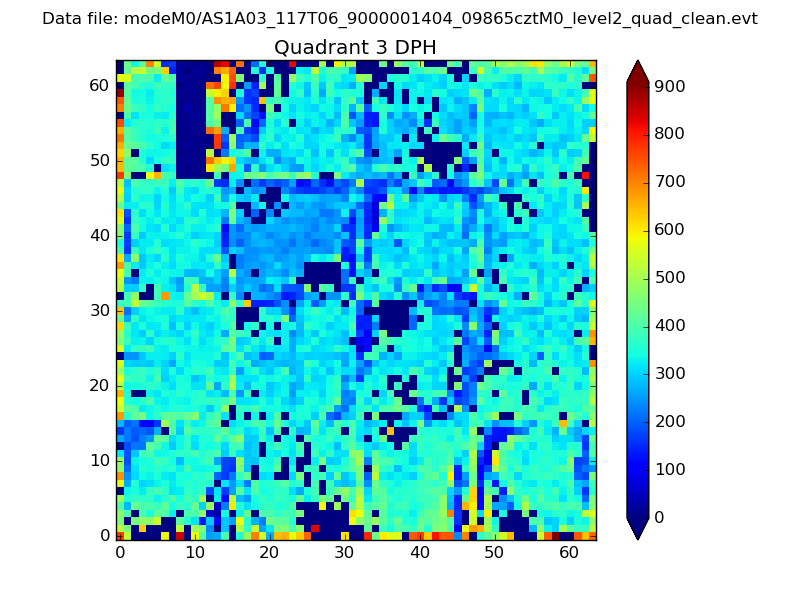 |
 |
Quadrant C |
| Plot type | Count rate plots | Images |
|---|---|---|
| Comparison with Poisson distribution Blue bars denote a histogram of data divided into 1 sec bins. Red curve is a Poisson curve with rate = median count rate of data. |
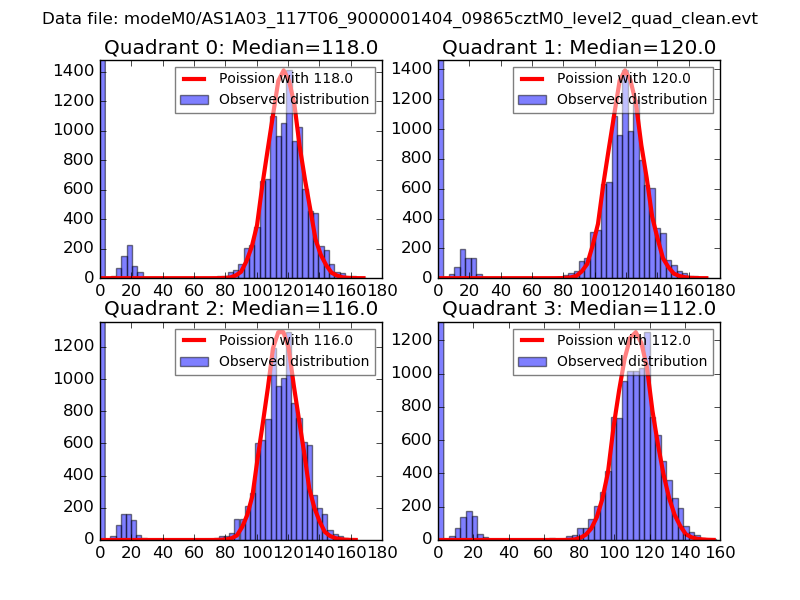 |
 |
| Quadrant-wise count rates Data is divided into 100 sec bins |
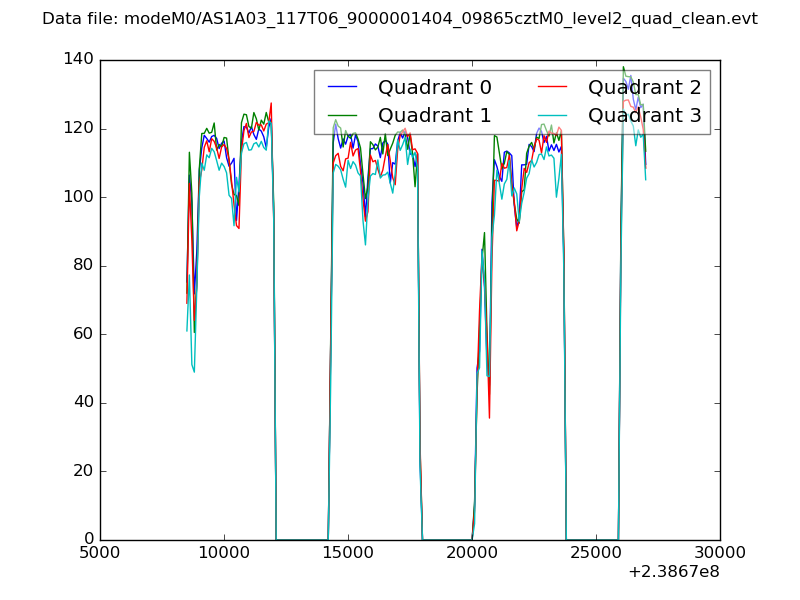 |
|
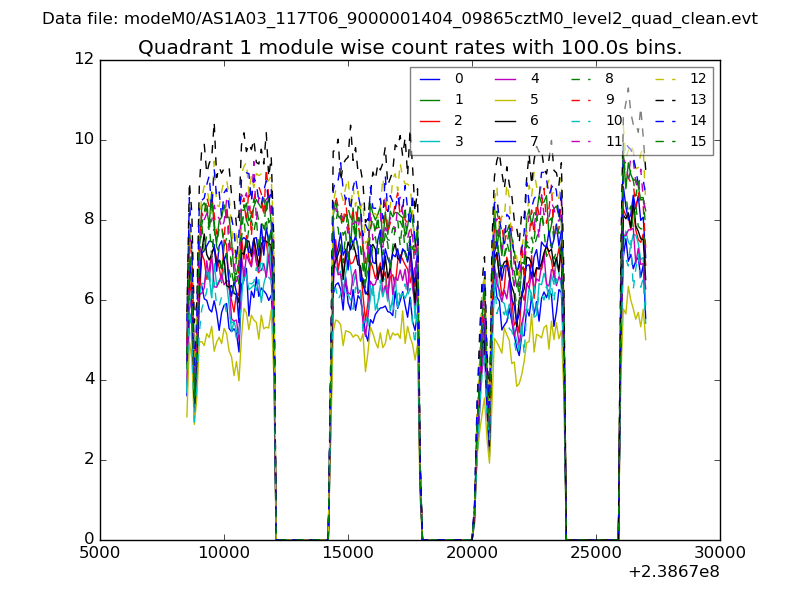
| Module-wise count rates for Quadrant A Data is divided into 100 sec bins |
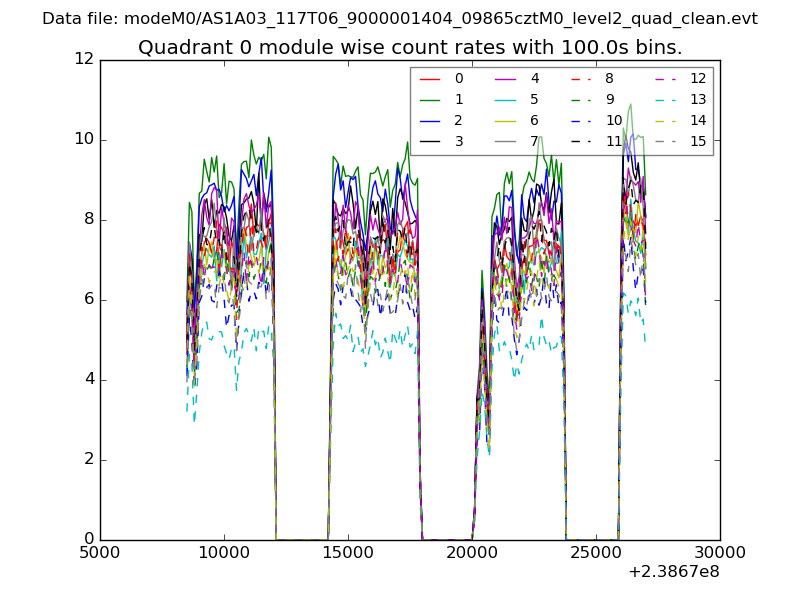 |
 |
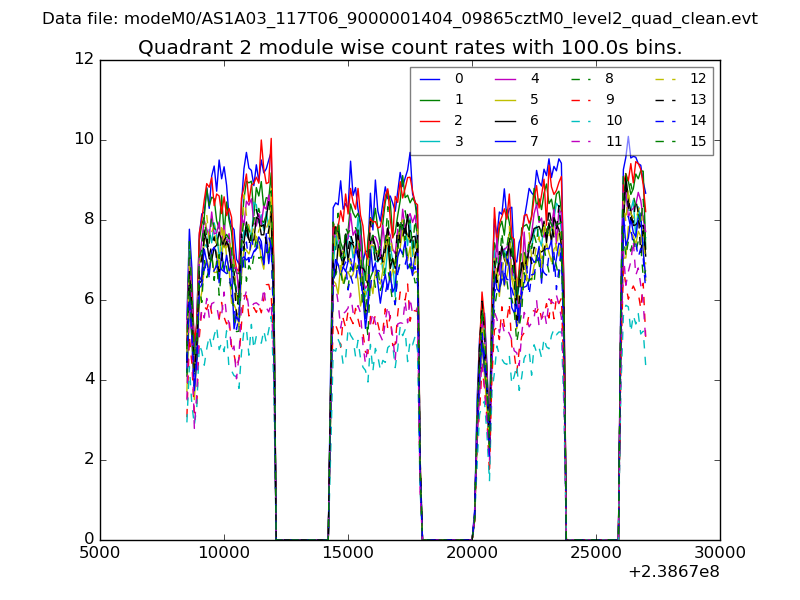
| Module-wise count rates for Quadrant B Data is divided into 100 sec bins |
 |
 |
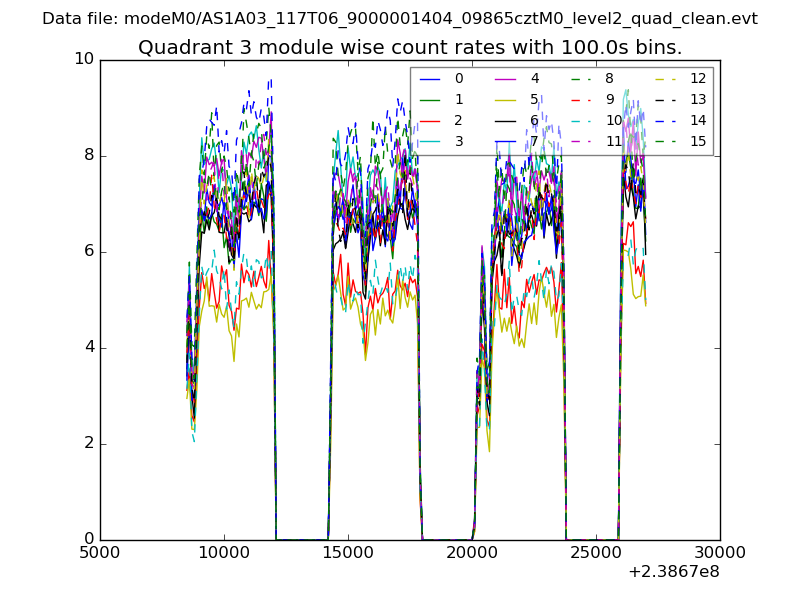
| Module-wise count rates for Quadrant C Data is divided into 100 sec bins |
 |
 |
| Module-wise count rates for Quadrant D Data is divided into 100 sec bins |
 |
 |
| Parameter | Plot |
|---|---|
| CZT HV Monitor | 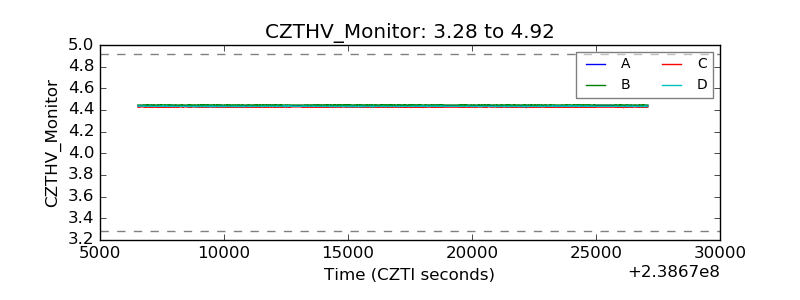 |
| D_VDD | 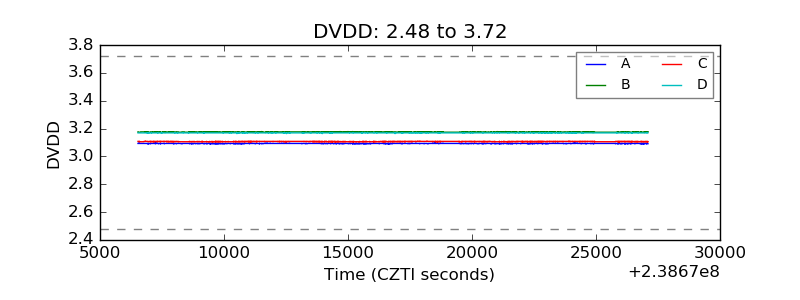 |
| Temperature 1 | 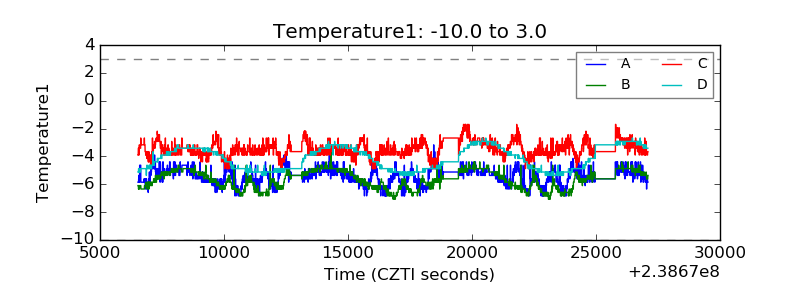 |
| Veto HV Monitor | 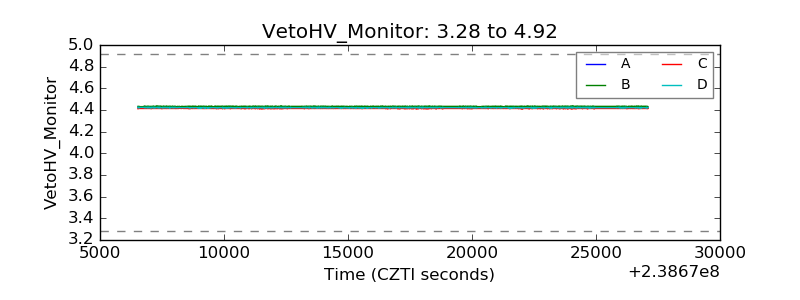 |
| Veto LLD | 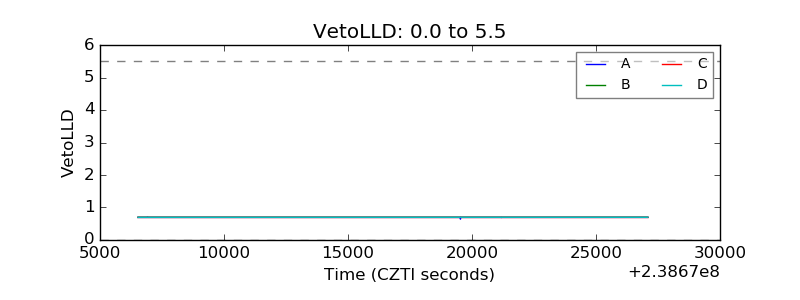 |
| Alpha Counter | 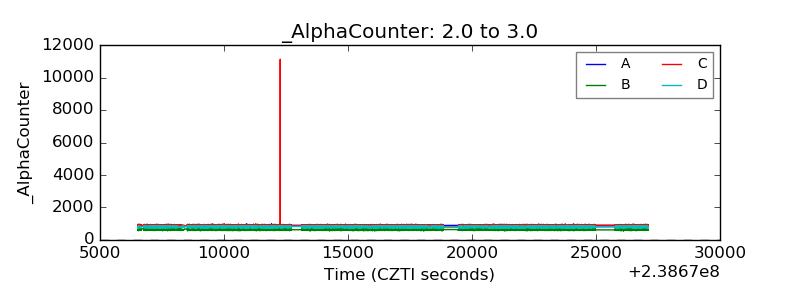 |
| _CPM_Rate | 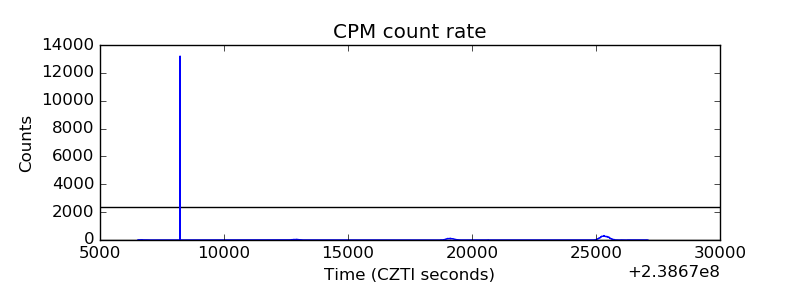 |
| CZT Counter | 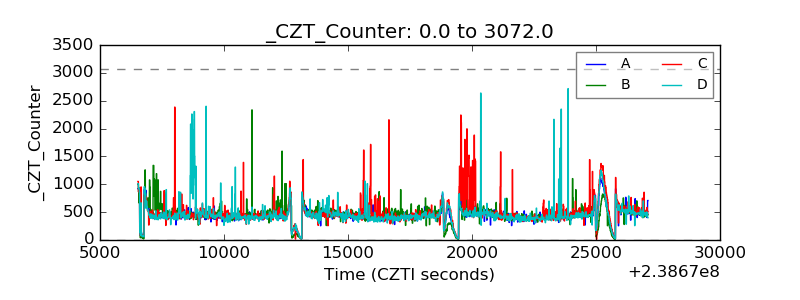 |
| +2.5 Volts monitor | 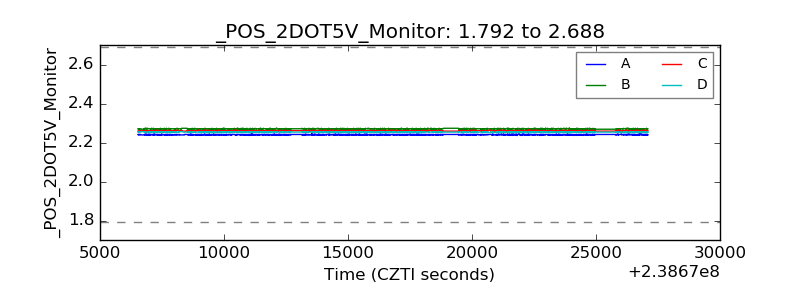 |
| +5 Volts monitor |  |
| _ROLL_ROT | 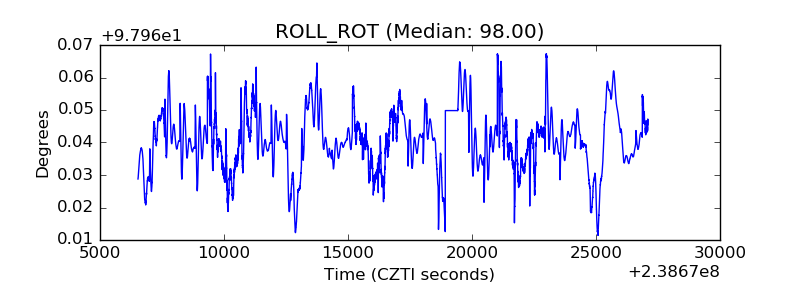 |
| _Roll_DEC | 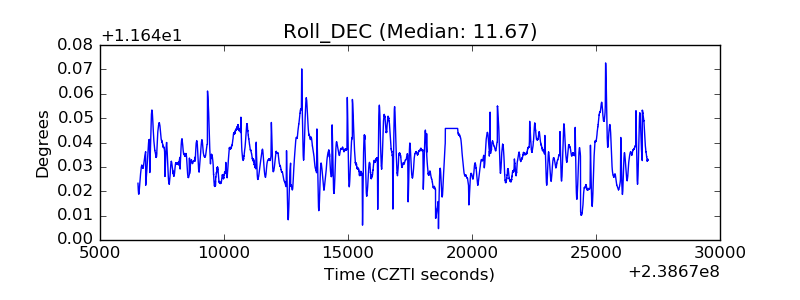 |
| _Roll_RA | 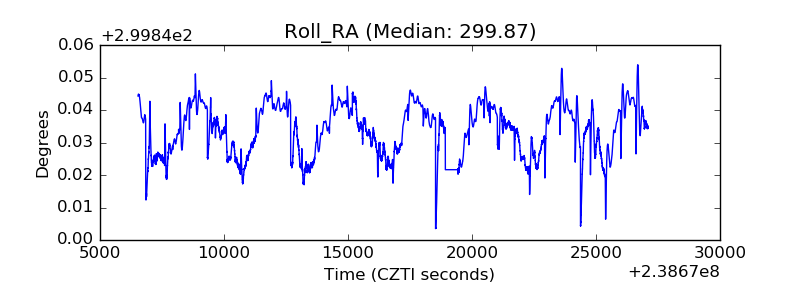 |
| Veto Counter | 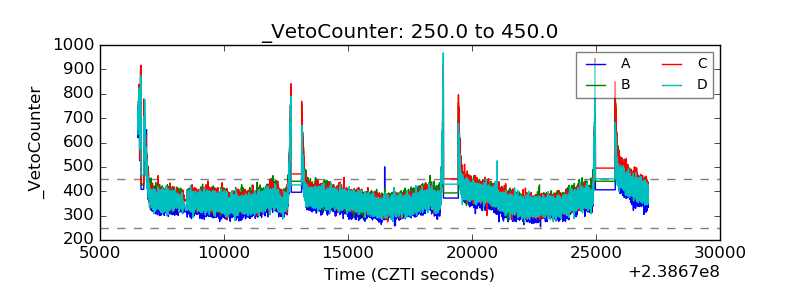 |