| Param | Original file | Final file |
|---|---|---|
| Filename | modeM0/AS1A03_117T06_9000001404_09866cztM0_level2.evt | modeM0/AS1A03_117T06_9000001404_09866cztM0_level2_quad_clean.evt |
| Size (bytes) | 502,496,640 | 95,713,920 |
| Size | 479.2 MB | 91.3 MB |
| Events in quadrant A | 3,345,988 | 605,862 |
| Events in quadrant B | 3,414,334 | 623,238 |
| Events in quadrant C | 4,591,276 | 593,335 |
| Events in quadrant D | 3,382,236 | 579,672 |
| Mode M9 | |||
|---|---|---|---|
| Quadrant | BADHDUFLAG | Total packets | Discarded packets |
| A | 0 | 18 | 0 |
| B | 0 | 18 | 1 |
| C | 0 | 18 | 0 |
| D | 0 | 18 | 0 |
| Mode M0 | |||
|---|---|---|---|
| Quadrant | BADHDUFLAG | Total packets | Discarded packets |
| A | 0 | 14909 | 146 |
| B | 0 | 15023 | 151 |
| C | 0 | 18674 | 230 |
| D | 0 | 15141 | 144 |
| Mode SS | |||
|---|---|---|---|
| Quadrant | BADHDUFLAG | Total packets | Discarded packets |
| A | 0 | 148 | 0 |
| B | 0 | 148 | 0 |
| C | 0 | 148 | 4 |
| D | 0 | 148 | 2 |
| Quadrant | Total seconds | Saturated seconds | Saturation percentage |
|---|---|---|---|
| A | 7132 | 86 | 1.205833% |
| B | 7132 | 104 | 1.458216% |
| C | 7119 | 171 | 2.402023% |
| D | 7132 | 94 | 1.318003% |
Noise dominated data is calculated using 1-second bins in cleaned event files. If a bin has >2000 counts, and if more than 50% of those come from <1% of pixels, then it is considered to be noise-dominated and hence unusable.
| Quadrant | # 1 sec bins | Bins with >0 counts | Bins with >2000 counts | High rate bins dominated by noise | Noise dominated (total time) | Noise dominated (detector-on time) | Marked lightcurve |
|---|---|---|---|---|---|---|---|
| A | 8979 | 7197 | 0 | 0 | 0.00% | 0.00% | 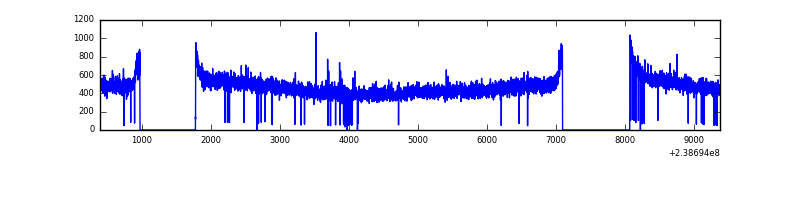 |
| B | 8979 | 7198 | 0 | 0 | 0.00% | 0.00% | 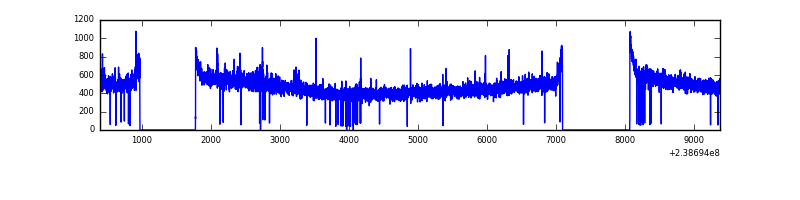 |
| C | 8979 | 7197 | 79 | 79 | 0.88% | 1.10% | 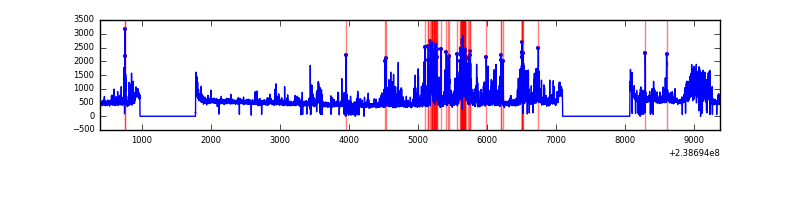 |
| D | 8979 | 7198 | 7 | 7 | 0.08% | 0.10% | 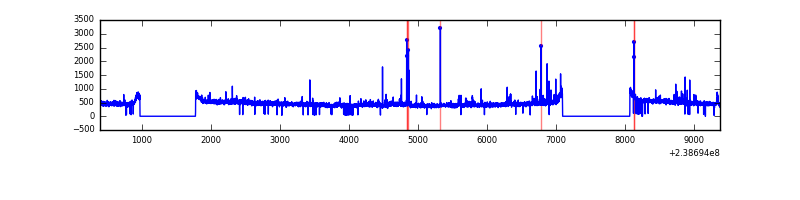 |
Top three noisy pixels from each quadrant. If the there are fewer than three noisy pixels in the level2.evt file, extra rows are filled as -1
| Pixel properties | Quadrant properties | ||||||
|---|---|---|---|---|---|---|---|
| Quadrant | DetID | PixID | Counts | Sigma | Mean | Median | Sigma |
| A | 13 | 251 | 14865 | 79.18 | 864 | 845 | 177.1 |
| A | 0 | 226 | 7848 | 39.55 | 864 | 845 | 177.1 |
| A | 12 | 194 | 6845 | 33.88 | 864 | 845 | 177.1 |
| B | 0 | 85 | 25630 | 147.76 | 868 | 847 | 167.7 |
| B | 12 | 111 | 19562 | 111.58 | 868 | 847 | 167.7 |
| B | 11 | 111 | 16723 | 94.66 | 868 | 847 | 167.7 |
| C | 4 | 254 | 1278230 | 6535.85 | 841 | 847 | 195.4 |
| C | 9 | 221 | 14386 | 69.27 | 841 | 847 | 195.4 |
| C | 14 | 234 | 6750 | 30.2 | 841 | 847 | 195.4 |
| D | 1 | 52 | 95883 | 438.15 | 837 | 819 | 217.0 |
| D | 10 | 172 | 37180 | 167.59 | 837 | 819 | 217.0 |
| D | 2 | 234 | 32628 | 146.61 | 837 | 819 | 217.0 |
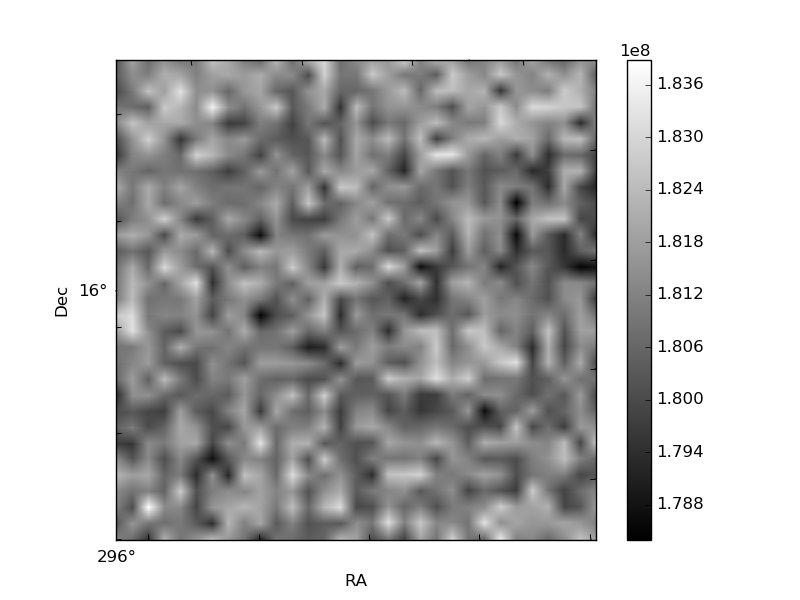
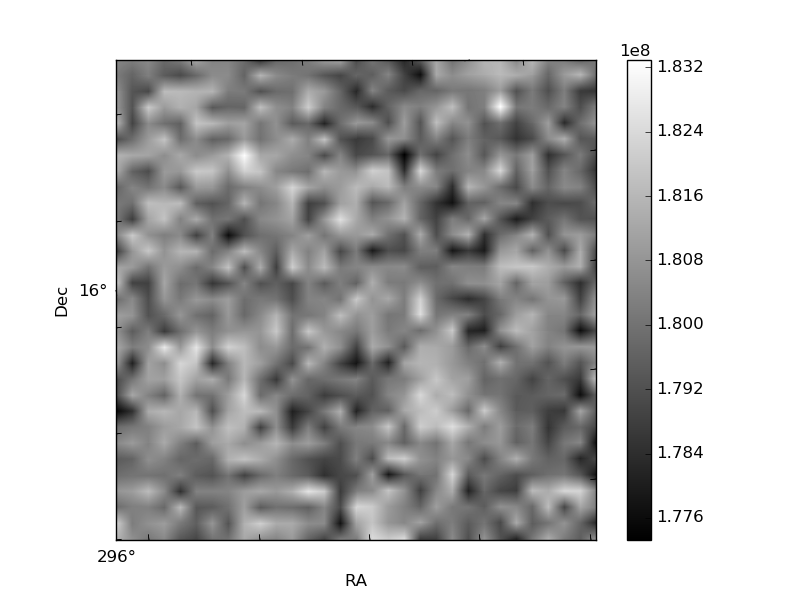
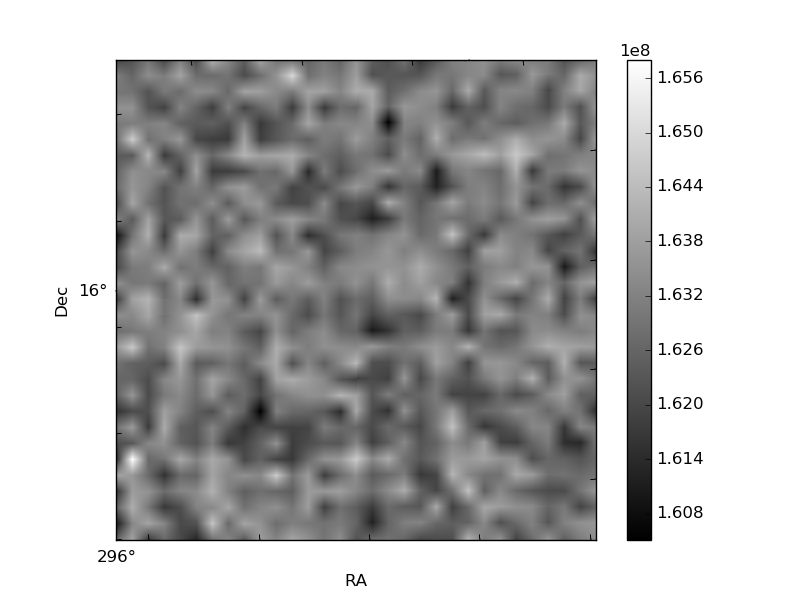
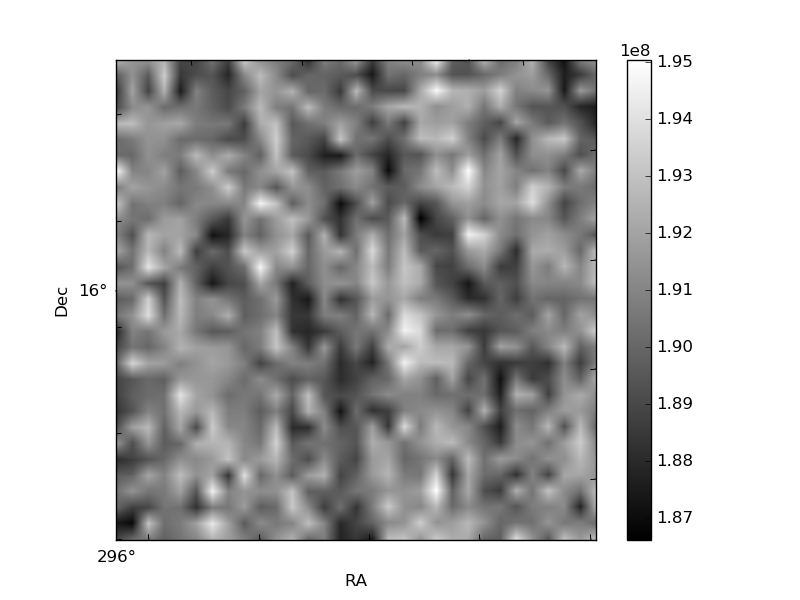
Histogram calculated using DETX and DETY for each event in the final _common_clean file
| Quadrant A | 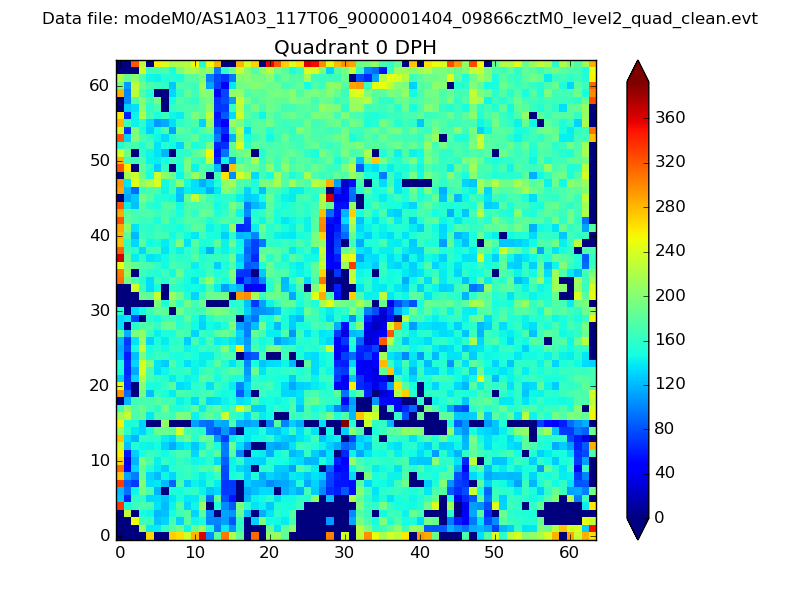 |
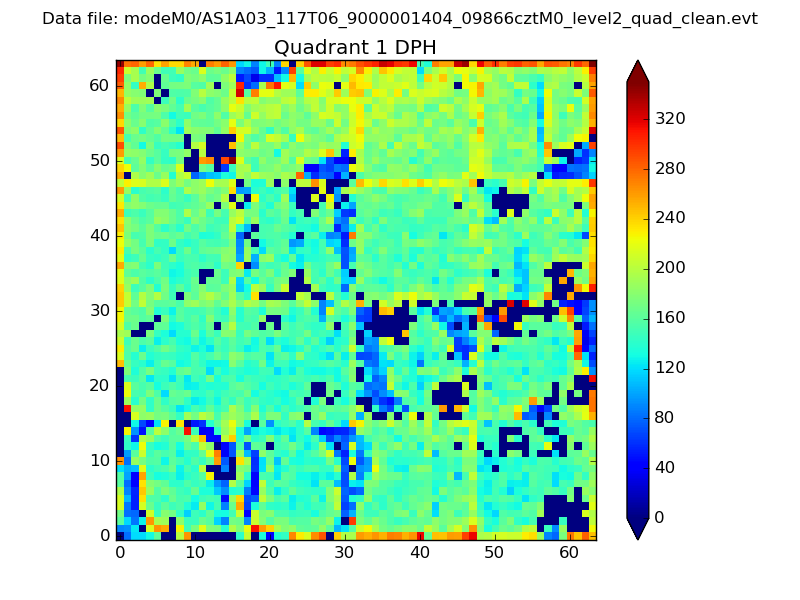 |
Quadrant B |
|---|---|---|---|
| Quadrant D | 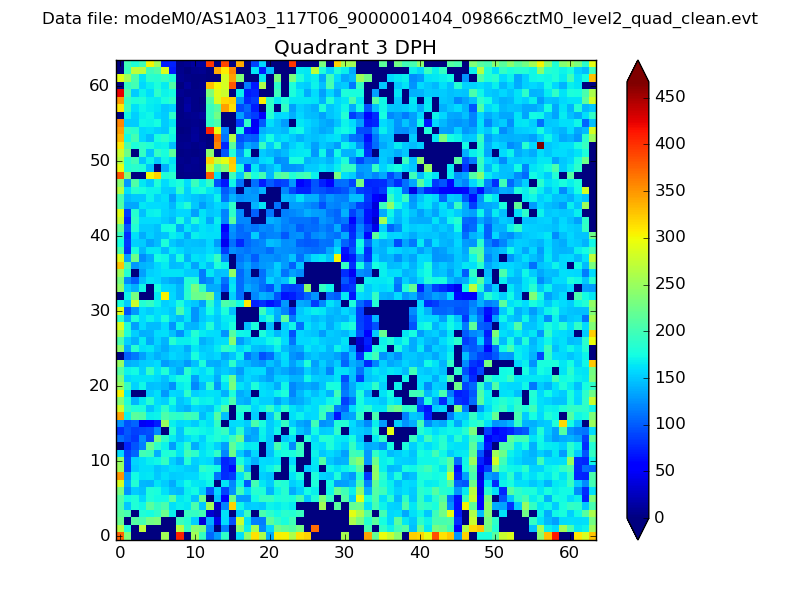 |
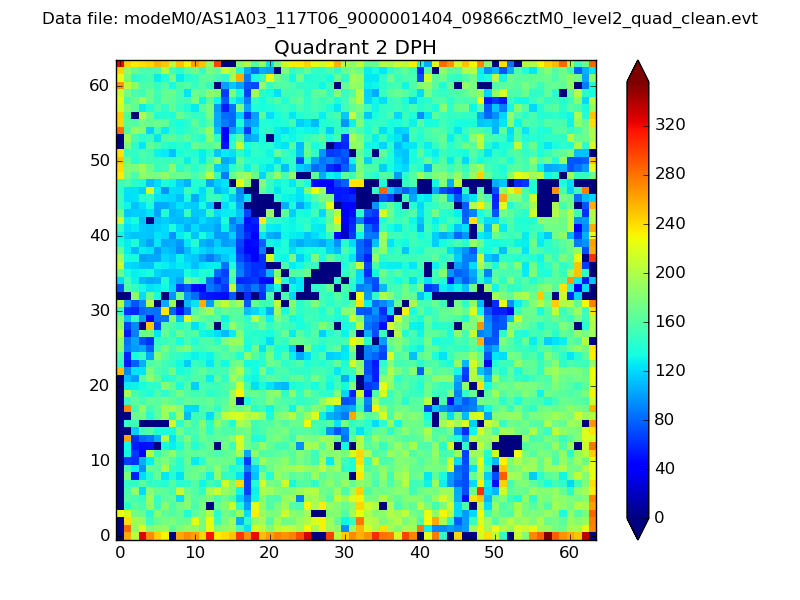 |
Quadrant C |
| Plot type | Count rate plots | Images |
|---|---|---|
| Comparison with Poisson distribution Blue bars denote a histogram of data divided into 1 sec bins. Red curve is a Poisson curve with rate = median count rate of data. |
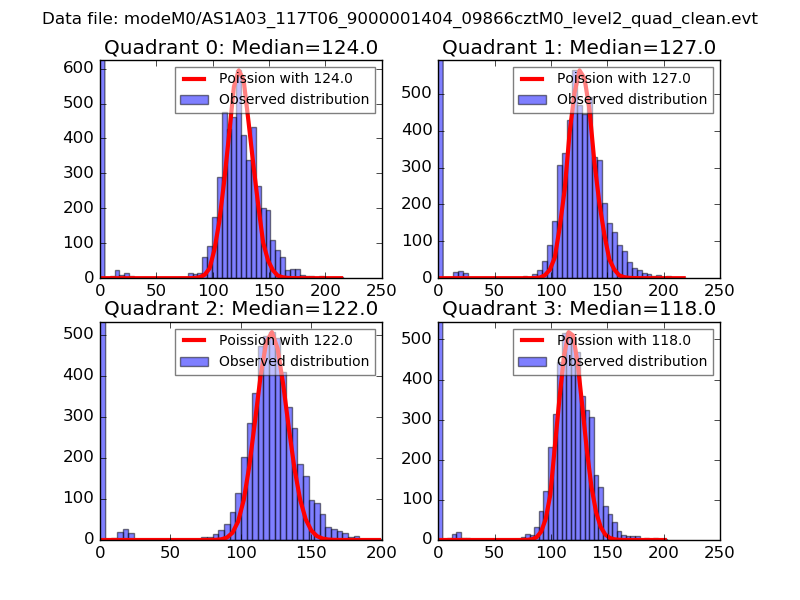 |
 |
| Quadrant-wise count rates Data is divided into 100 sec bins |
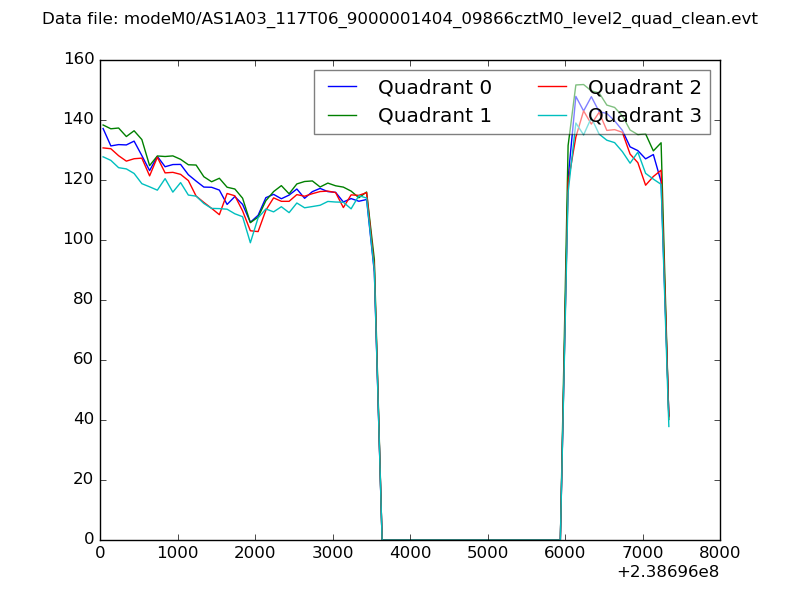 |
|
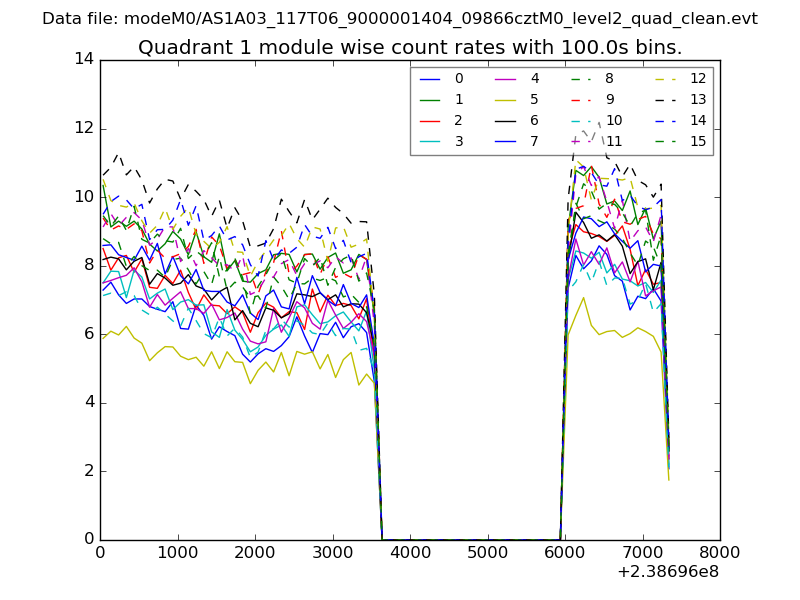
| Module-wise count rates for Quadrant A Data is divided into 100 sec bins |
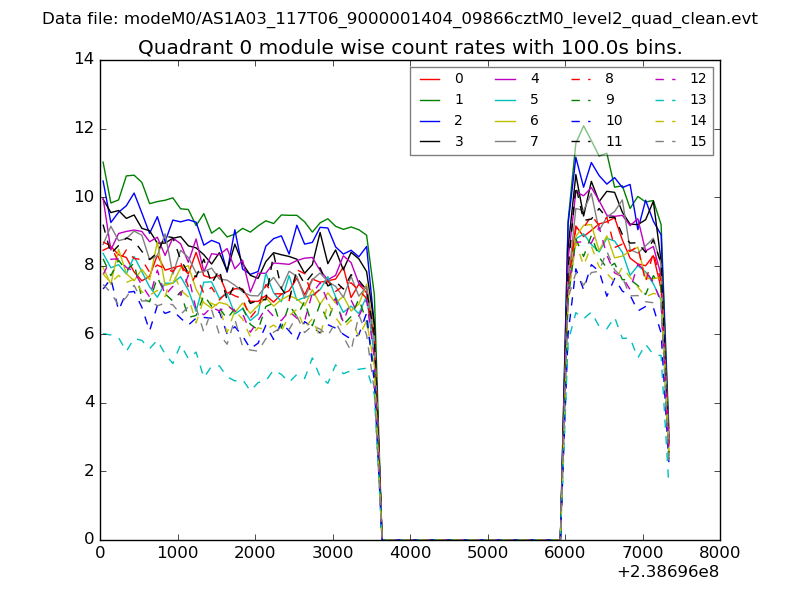 |
 |
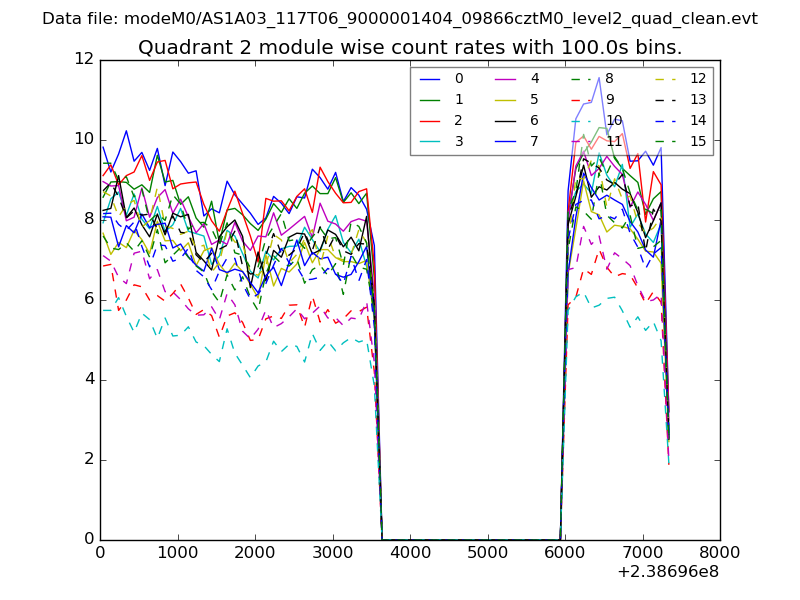
| Module-wise count rates for Quadrant B Data is divided into 100 sec bins |
 |
 |
| Module-wise count rates for Quadrant C Data is divided into 100 sec bins |
 |
 |
| Module-wise count rates for Quadrant D Data is divided into 100 sec bins |
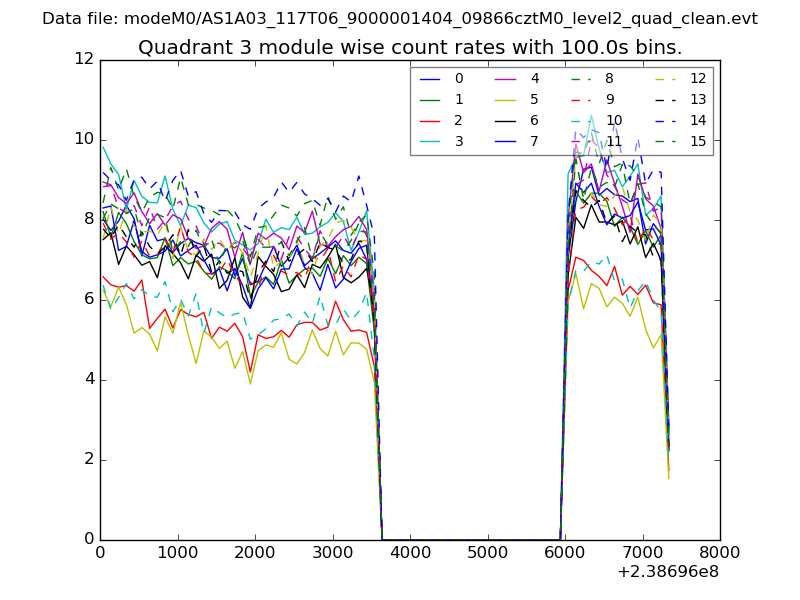 |
 |
| Parameter | Plot |
|---|---|
| CZT HV Monitor | 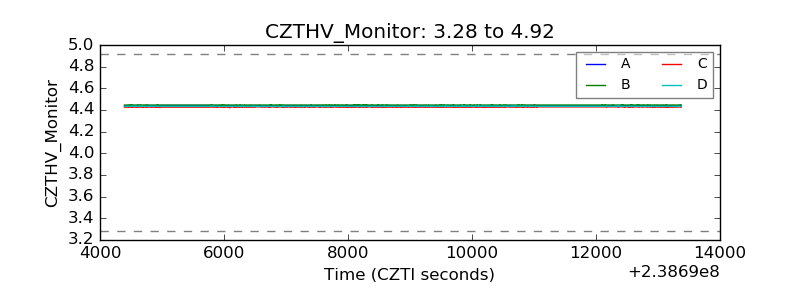 |
| D_VDD | 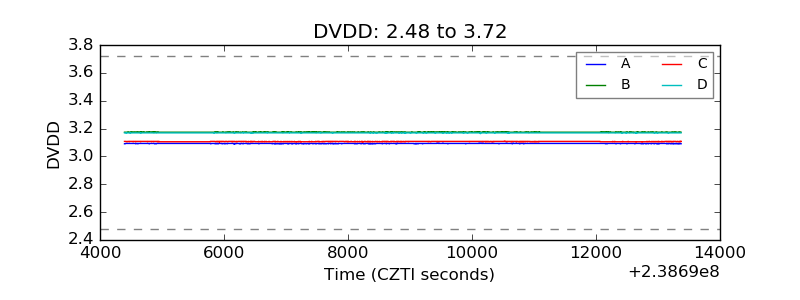 |
| Temperature 1 | 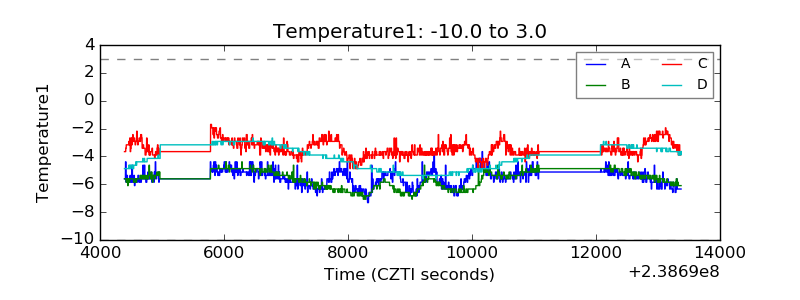 |
| Veto HV Monitor | 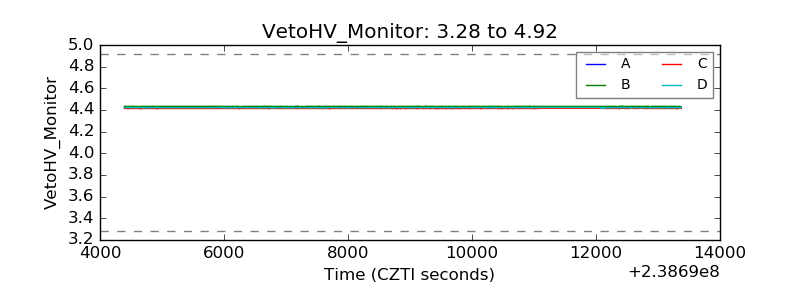 |
| Veto LLD | 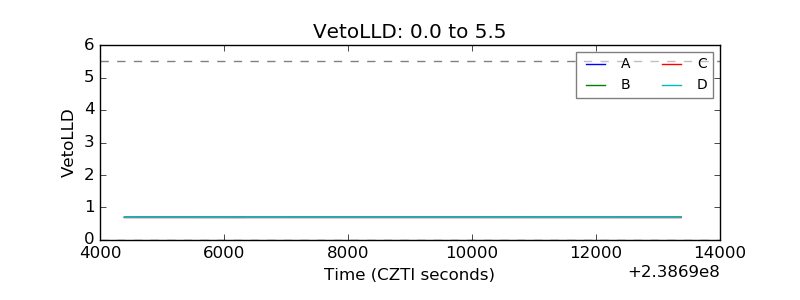 |
| Alpha Counter | 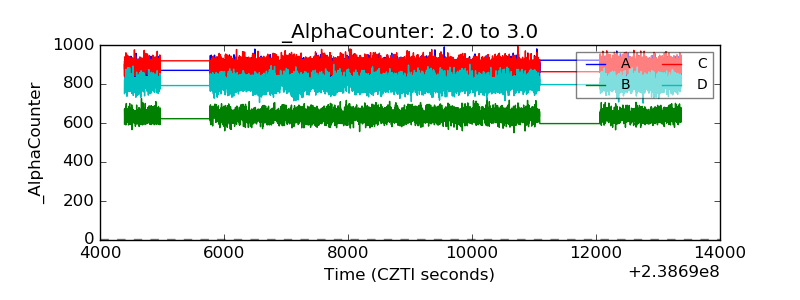 |
| _CPM_Rate | 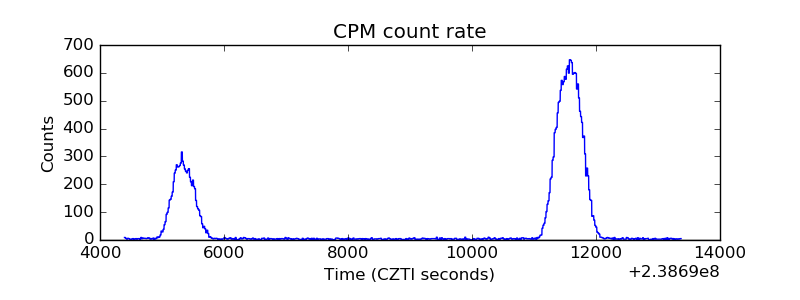 |
| CZT Counter | 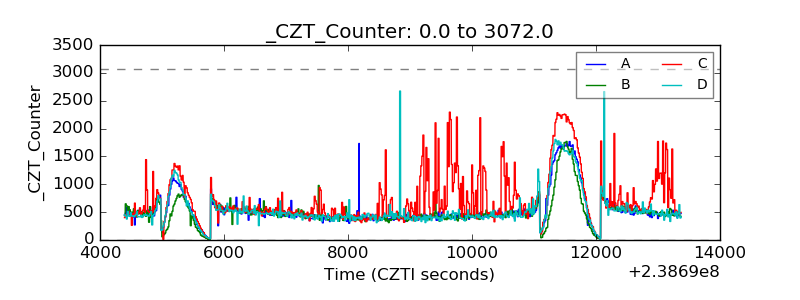 |
| +2.5 Volts monitor |  |
| +5 Volts monitor |  |
| _ROLL_ROT | 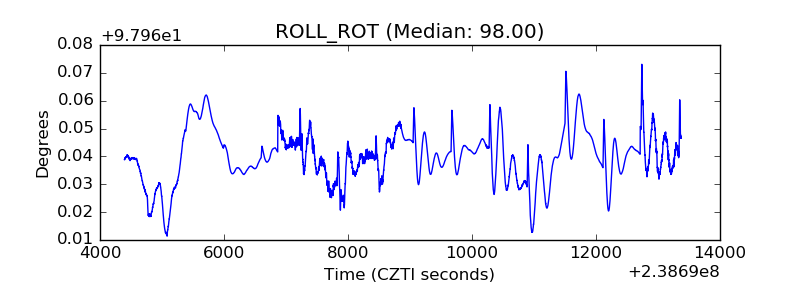 |
| _Roll_DEC | 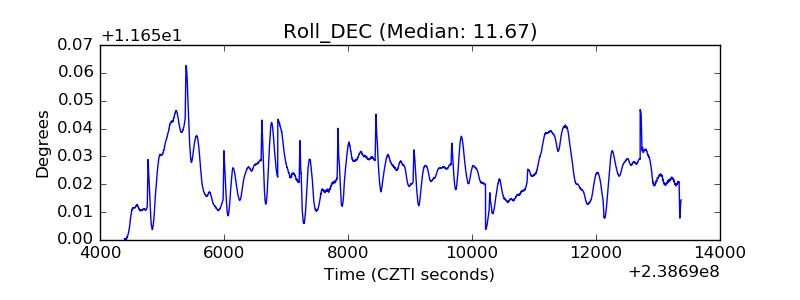 |
| _Roll_RA | 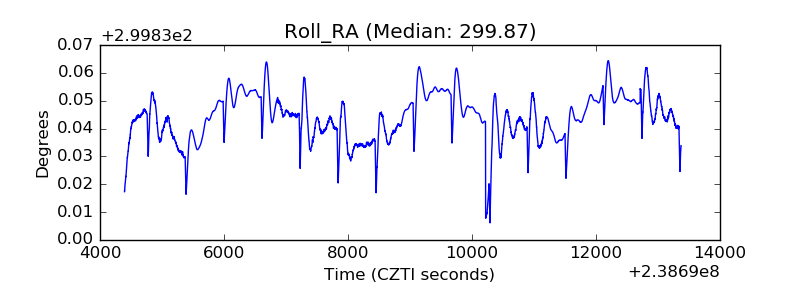 |
| Veto Counter | 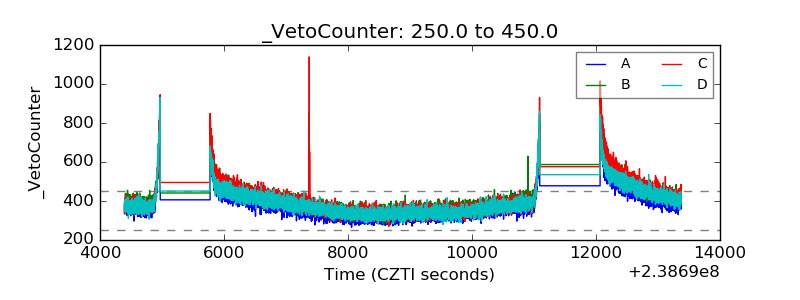 |