| Param | Original file | Final file |
|---|---|---|
| Filename | modeM0/AS1A03_117T06_9000001404_09868cztM0_level2.evt | modeM0/AS1A03_117T06_9000001404_09868cztM0_level2_quad_clean.evt |
| Size (bytes) | 520,378,560 | 97,032,960 |
| Size | 496.3 MB | 92.5 MB |
| Events in quadrant A | 3,301,038 | 617,208 |
| Events in quadrant B | 3,466,713 | 638,215 |
| Events in quadrant C | 5,071,648 | 606,191 |
| Events in quadrant D | 3,447,992 | 592,348 |
| Mode M9 | |||
|---|---|---|---|
| Quadrant | BADHDUFLAG | Total packets | Discarded packets |
| A | 0 | 21 | 0 |
| B | 0 | 21 | 1 |
| C | 0 | 21 | 0 |
| D | 0 | 21 | 0 |
| Mode M0 | |||
|---|---|---|---|
| Quadrant | BADHDUFLAG | Total packets | Discarded packets |
| A | 0 | 14771 | 184 |
| B | 0 | 15167 | 191 |
| C | 0 | 20147 | 425 |
| D | 0 | 15444 | 226 |
| Mode SS | |||
|---|---|---|---|
| Quadrant | BADHDUFLAG | Total packets | Discarded packets |
| A | 0 | 146 | 0 |
| B | 0 | 146 | 4 |
| C | 0 | 146 | 4 |
| D | 0 | 146 | 0 |
| Quadrant | Total seconds | Saturated seconds | Saturation percentage |
|---|---|---|---|
| A | 6965 | 83 | 1.191673% |
| B | 6966 | 124 | 1.780075% |
| C | 6929 | 185 | 2.669938% |
| D | 6957 | 130 | 1.868622% |
Noise dominated data is calculated using 1-second bins in cleaned event files. If a bin has >2000 counts, and if more than 50% of those come from <1% of pixels, then it is considered to be noise-dominated and hence unusable.
| Quadrant | # 1 sec bins | Bins with >0 counts | Bins with >2000 counts | High rate bins dominated by noise | Noise dominated (total time) | Noise dominated (detector-on time) | Marked lightcurve |
|---|---|---|---|---|---|---|---|
| A | 9129 | 7049 | 0 | 0 | 0.00% | 0.00% | 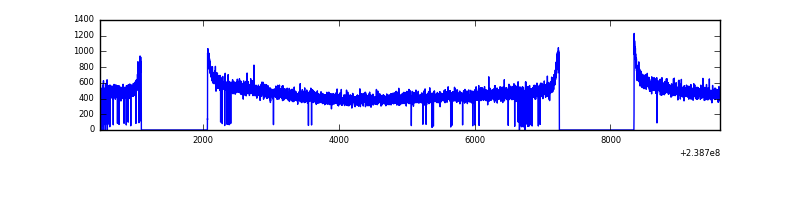 |
| B | 9128 | 7043 | 7 | 7 | 0.08% | 0.10% | 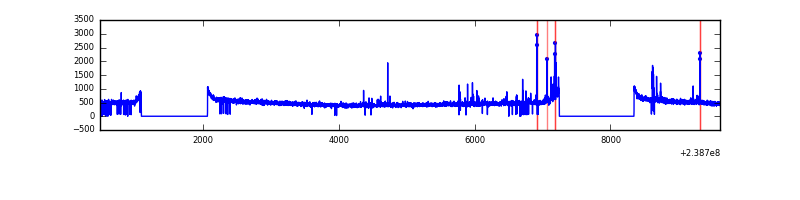 |
| C | 9125 | 7025 | 145 | 145 | 1.59% | 2.06% | 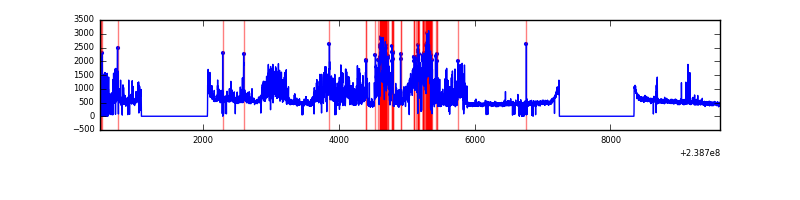 |
| D | 9129 | 7047 | 37 | 37 | 0.41% | 0.53% | 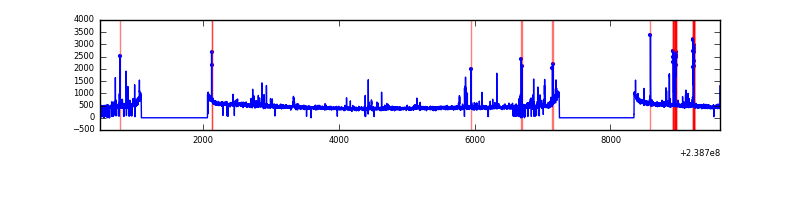 |
Top three noisy pixels from each quadrant. If the there are fewer than three noisy pixels in the level2.evt file, extra rows are filled as -1
| Pixel properties | Quadrant properties | ||||||
|---|---|---|---|---|---|---|---|
| Quadrant | DetID | PixID | Counts | Sigma | Mean | Median | Sigma |
| A | 0 | 226 | 7844 | 39.97 | 856 | 837 | 175.3 |
| A | 13 | 251 | 6983 | 35.06 | 856 | 837 | 175.3 |
| A | 12 | 194 | 6730 | 33.62 | 856 | 837 | 175.3 |
| B | 4 | 81 | 117769 | 705.59 | 860 | 838 | 165.7 |
| B | 12 | 111 | 19304 | 111.43 | 860 | 838 | 165.7 |
| B | 11 | 111 | 16115 | 92.18 | 860 | 838 | 165.7 |
| C | 4 | 254 | 1788826 | 9219.05 | 834 | 841 | 193.9 |
| C | 14 | 234 | 13533 | 65.44 | 834 | 841 | 193.9 |
| C | 9 | 54 | 6408 | 28.7 | 834 | 841 | 193.9 |
| D | 1 | 52 | 187259 | 863.55 | 829 | 813 | 215.9 |
| D | 10 | 172 | 59709 | 272.78 | 829 | 813 | 215.9 |
| D | 2 | 234 | 28386 | 127.71 | 829 | 813 | 215.9 |
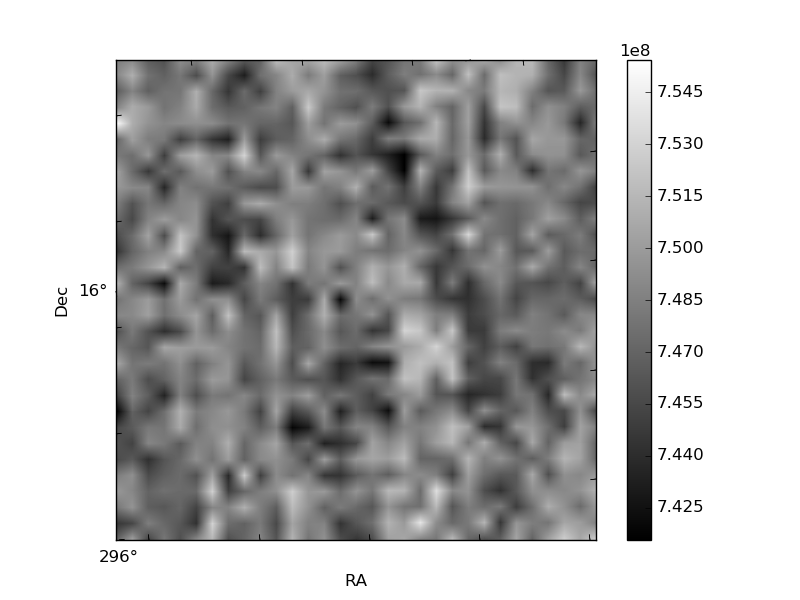
Histogram calculated using DETX and DETY for each event in the final _common_clean file
| Quadrant A | 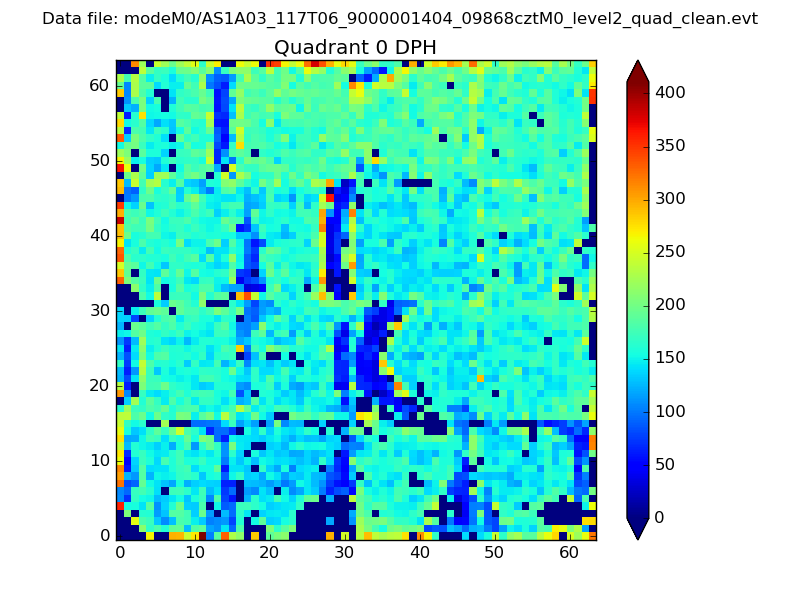 |
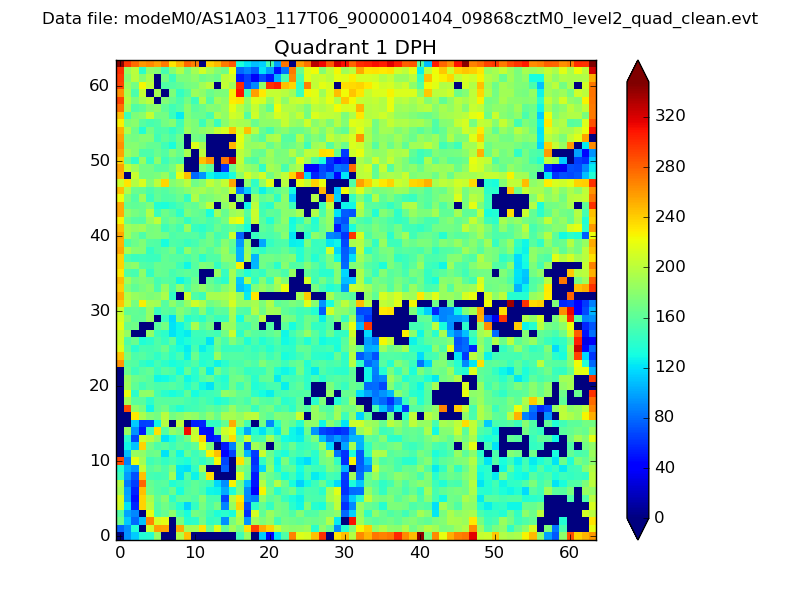 |
Quadrant B |
|---|---|---|---|
| Quadrant D | 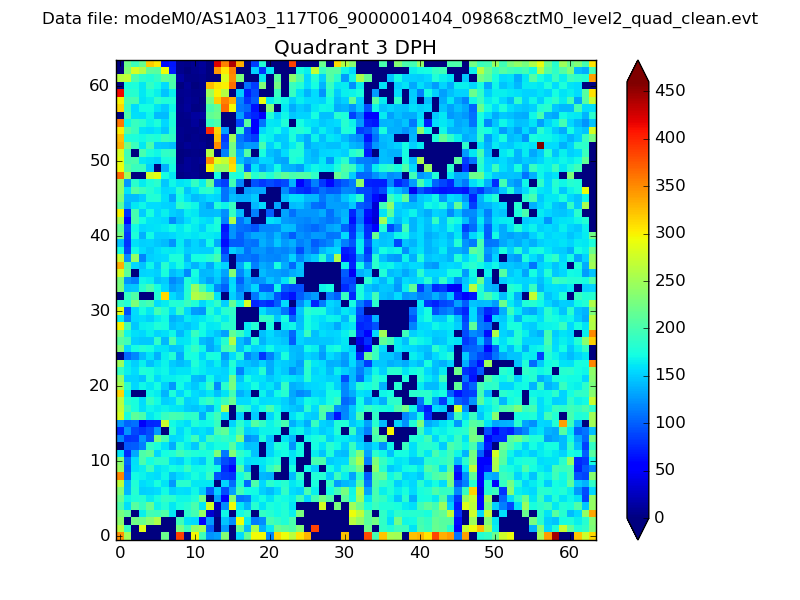 |
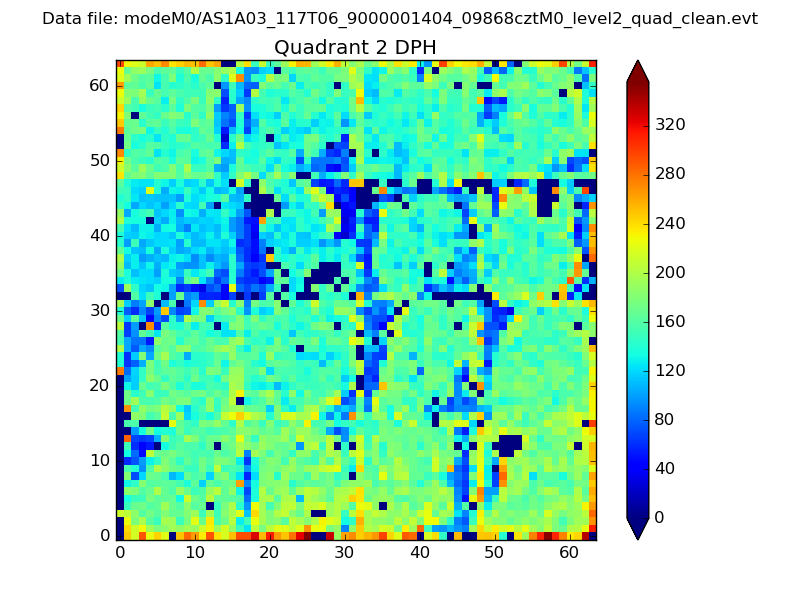 |
Quadrant C |
| Plot type | Count rate plots | Images |
|---|---|---|
| Comparison with Poisson distribution Blue bars denote a histogram of data divided into 1 sec bins. Red curve is a Poisson curve with rate = median count rate of data. |
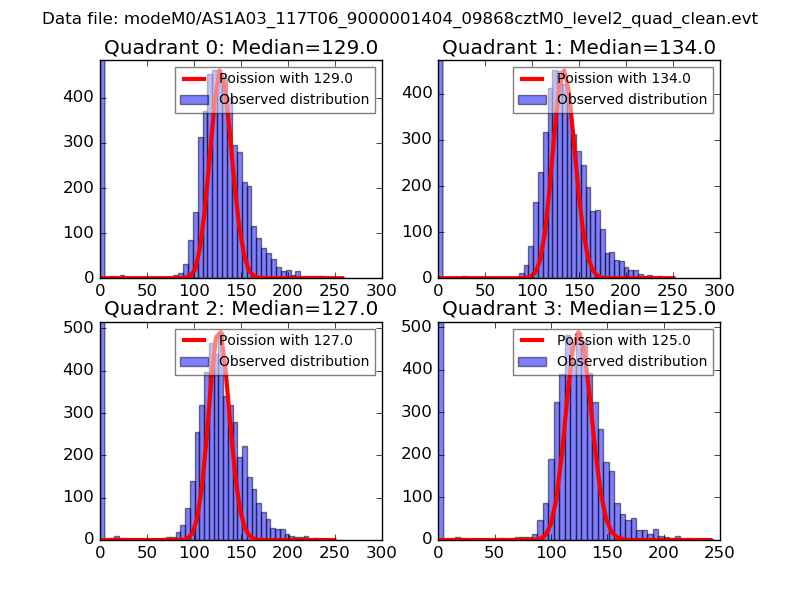 |
 |
| Quadrant-wise count rates Data is divided into 100 sec bins |
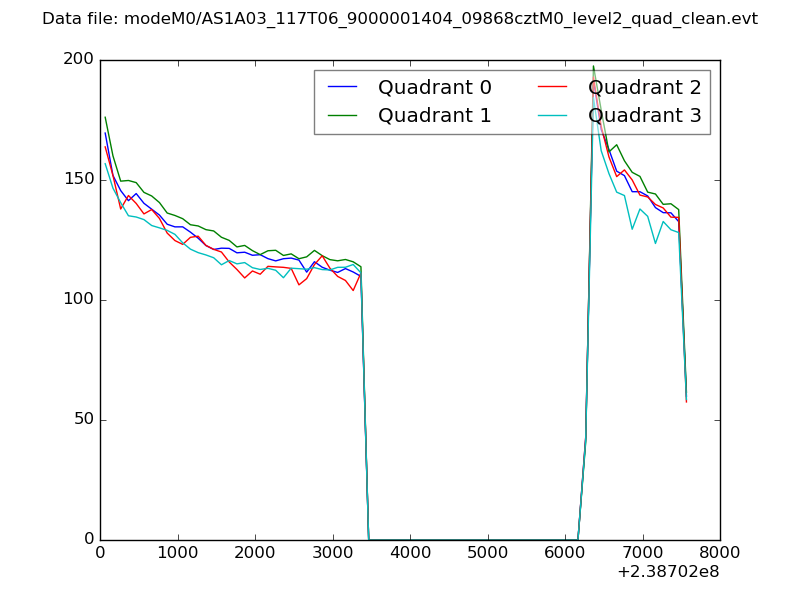 |
|
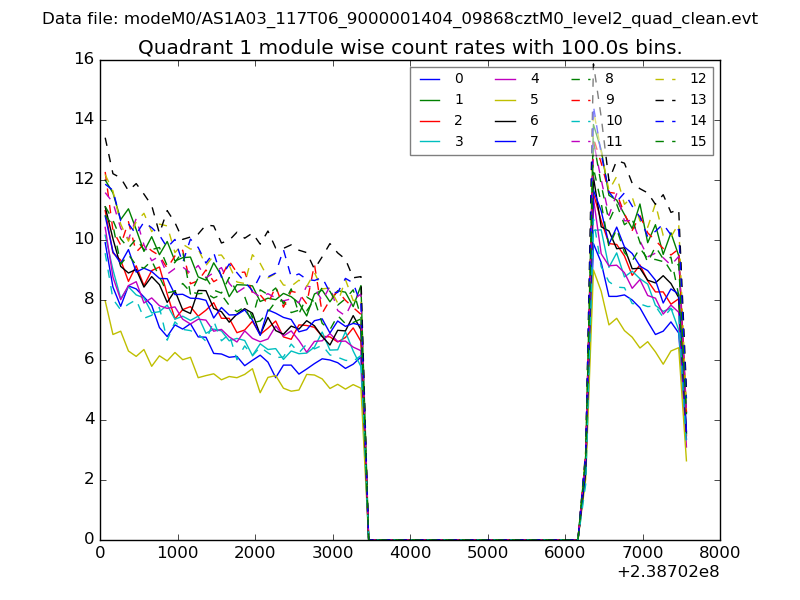
| Module-wise count rates for Quadrant A Data is divided into 100 sec bins |
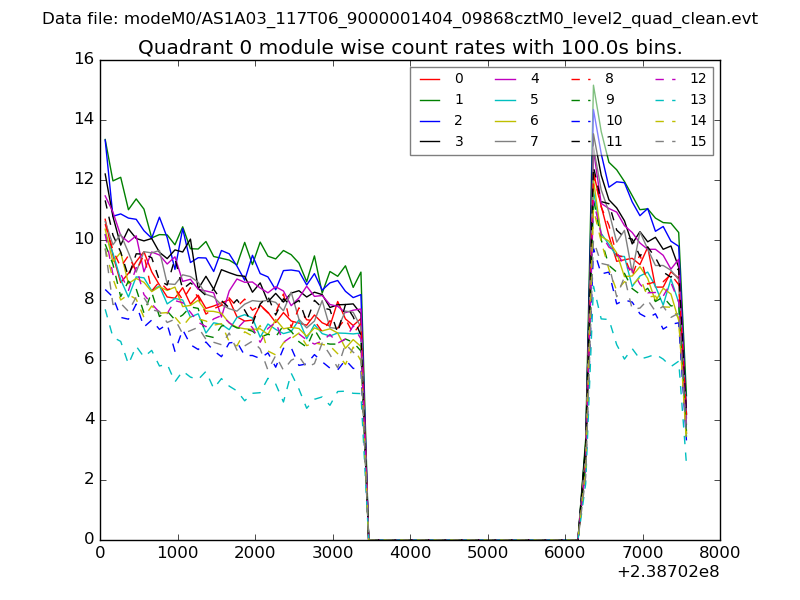 |
 |
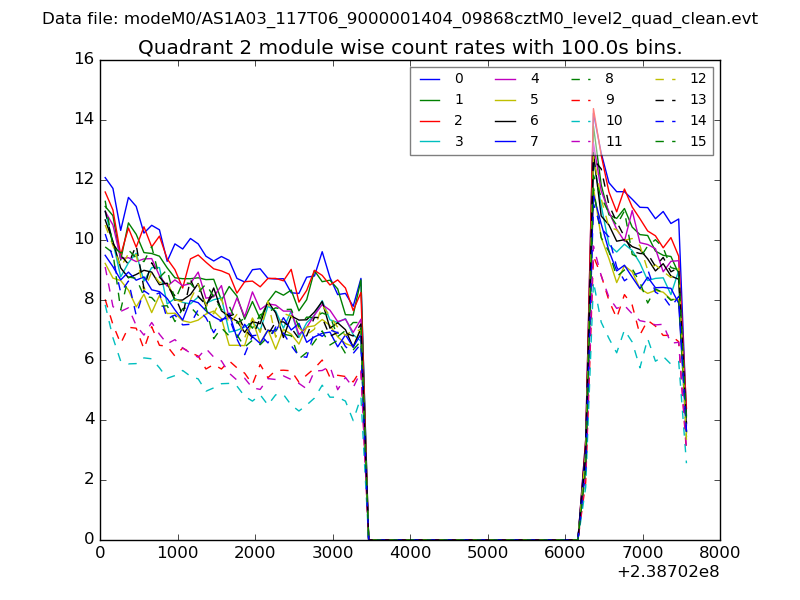
| Module-wise count rates for Quadrant B Data is divided into 100 sec bins |
 |
 |
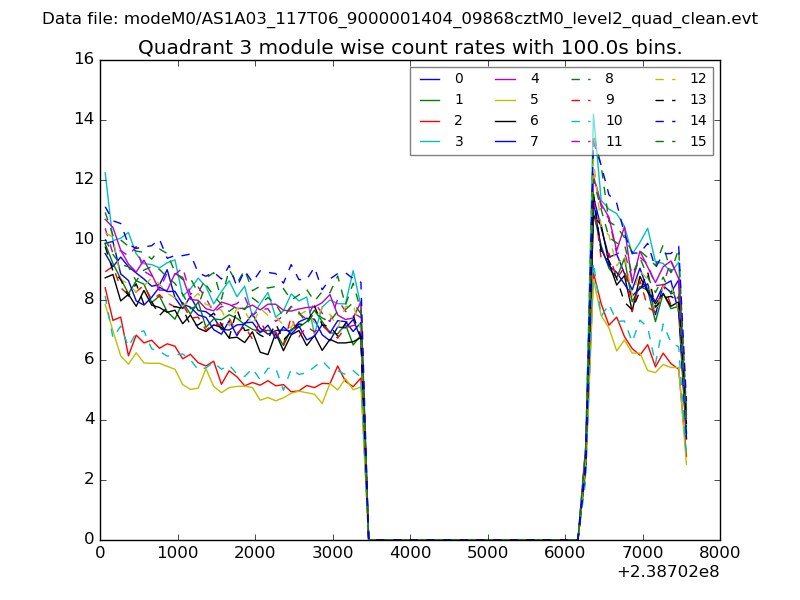
| Module-wise count rates for Quadrant C Data is divided into 100 sec bins |
 |
 |
| Module-wise count rates for Quadrant D Data is divided into 100 sec bins |
 |
 |
| Parameter | Plot |
|---|---|
| CZT HV Monitor | 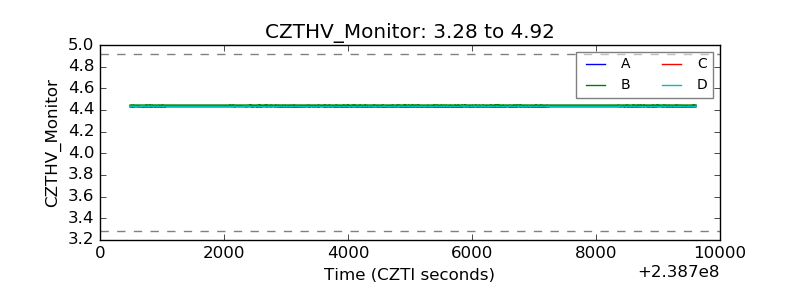 |
| D_VDD |  |
| Temperature 1 | 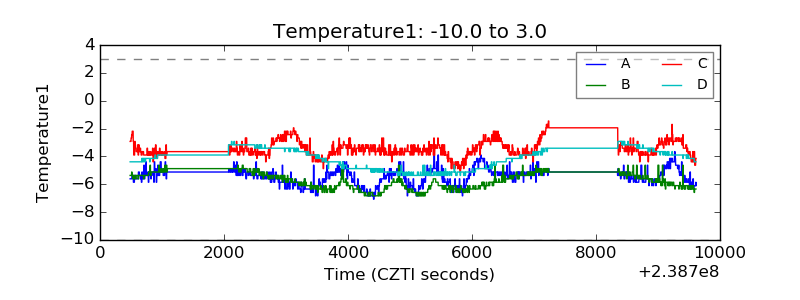 |
| Veto HV Monitor | 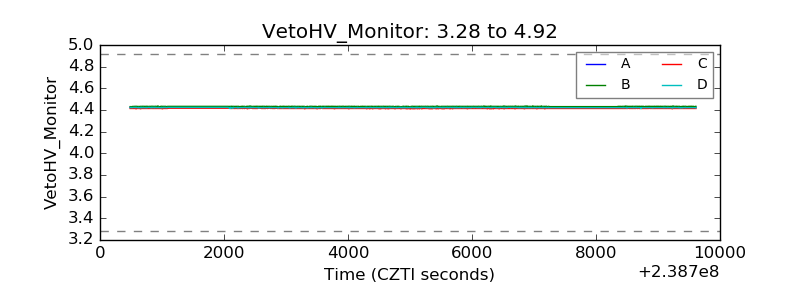 |
| Veto LLD | 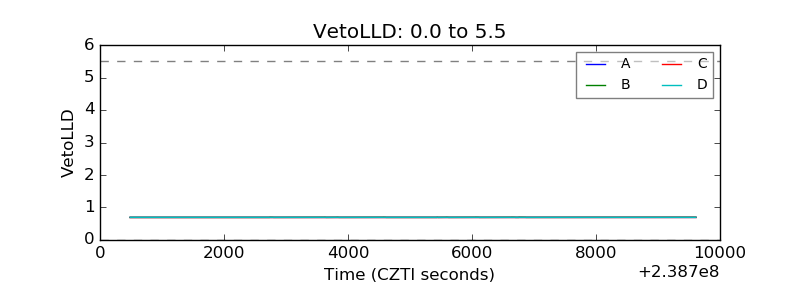 |
| Alpha Counter | 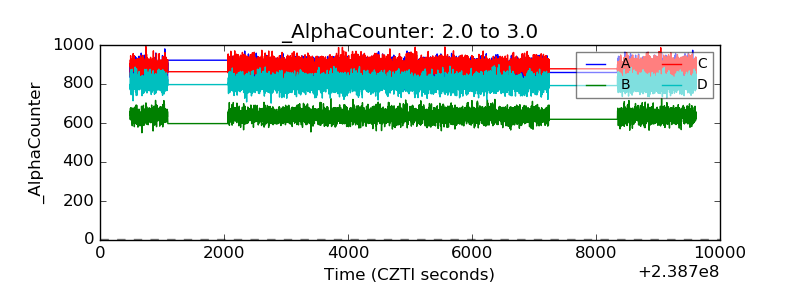 |
| _CPM_Rate | 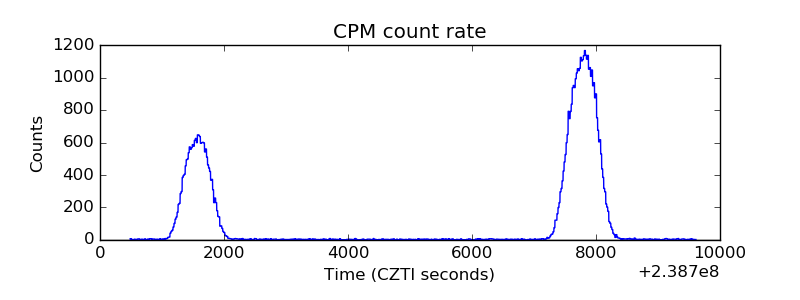 |
| CZT Counter | 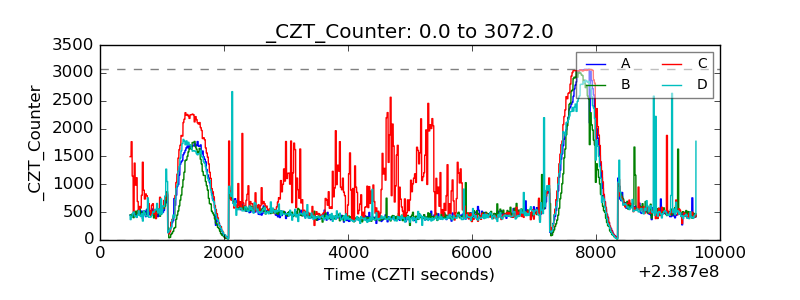 |
| +2.5 Volts monitor | 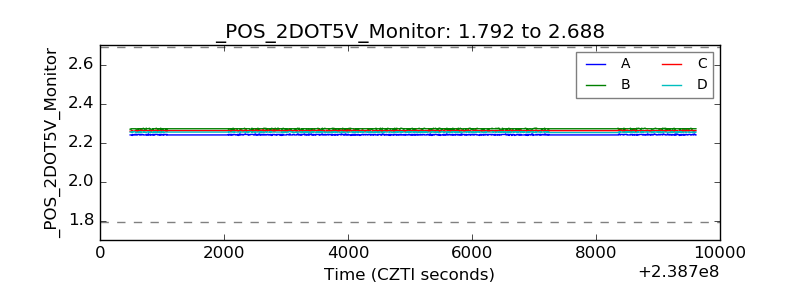 |
| +5 Volts monitor | 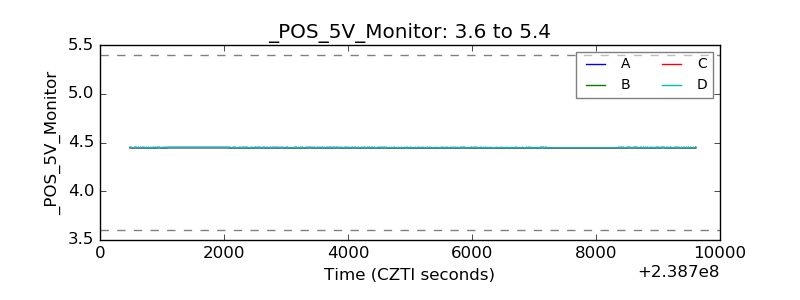 |
| _ROLL_ROT | 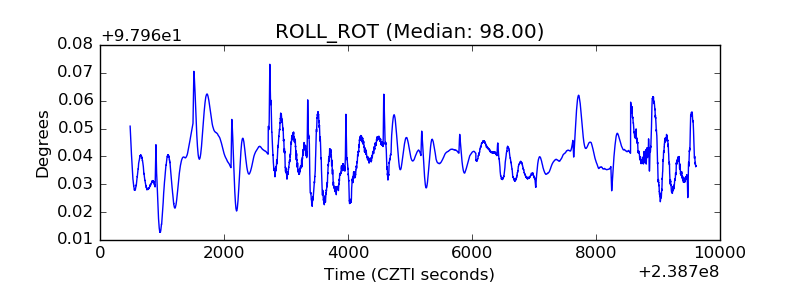 |
| _Roll_DEC | 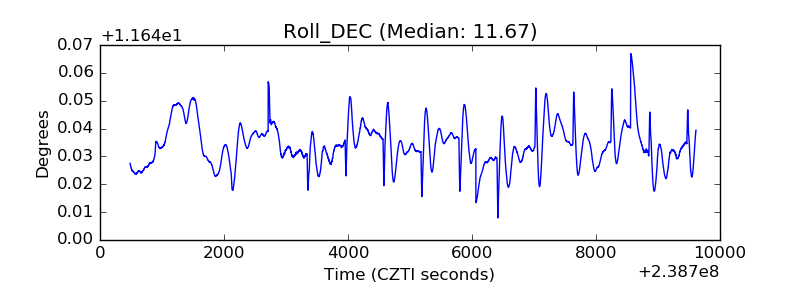 |
| _Roll_RA | 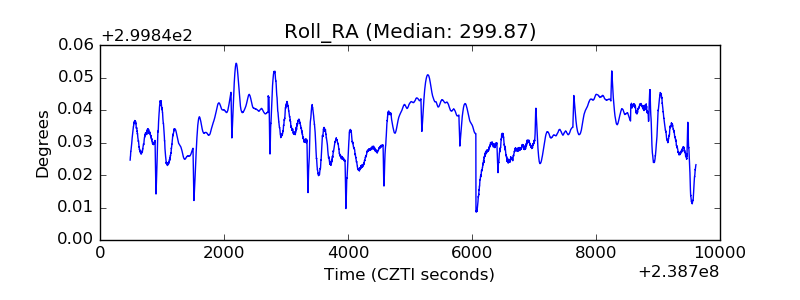 |
| Veto Counter | 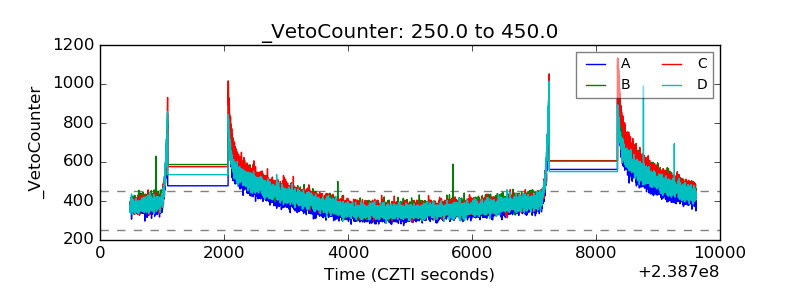 |