| Param | Original file | Final file |
|---|---|---|
| Filename | modeM0/AS1A03_117T06_9000001404_09871cztM0_level2.evt | modeM0/AS1A03_117T06_9000001404_09871cztM0_level2_quad_clean.evt |
| Size (bytes) | 428,204,160 | 85,582,080 |
| Size | 408.4 MB | 81.6 MB |
| Events in quadrant A | 2,910,435 | 547,508 |
| Events in quadrant B | 3,115,269 | 569,714 |
| Events in quadrant C | 2,980,932 | 543,259 |
| Events in quadrant D | 3,553,397 | 511,939 |
| Mode M9 | |||
|---|---|---|---|
| Quadrant | BADHDUFLAG | Total packets | Discarded packets |
| A | 0 | 23 | 0 |
| B | 0 | 23 | 0 |
| C | 0 | 23 | 0 |
| D | 0 | 24 | 0 |
| Mode M0 | |||
|---|---|---|---|
| Quadrant | BADHDUFLAG | Total packets | Discarded packets |
| A | 0 | 12453 | 9 |
| B | 0 | 13038 | 12 |
| C | 0 | 12808 | 8 |
| D | 0 | 14700 | 17 |
| Mode SS | |||
|---|---|---|---|
| Quadrant | BADHDUFLAG | Total packets | Discarded packets |
| A | 0 | 122 | 0 |
| B | 0 | 122 | 0 |
| C | 0 | 122 | 0 |
| D | 0 | 122 | 0 |
| Quadrant | Total seconds | Saturated seconds | Saturation percentage |
|---|---|---|---|
| A | 6005 | 20 | 0.333056% |
| B | 6003 | 69 | 1.149425% |
| C | 6005 | 32 | 0.532889% |
| D | 6004 | 130 | 2.165223% |
Noise dominated data is calculated using 1-second bins in cleaned event files. If a bin has >2000 counts, and if more than 50% of those come from <1% of pixels, then it is considered to be noise-dominated and hence unusable.
| Quadrant | # 1 sec bins | Bins with >0 counts | Bins with >2000 counts | High rate bins dominated by noise | Noise dominated (total time) | Noise dominated (detector-on time) | Marked lightcurve |
|---|---|---|---|---|---|---|---|
| A | 7368 | 6009 | 1 | 1 | 0.01% | 0.02% | 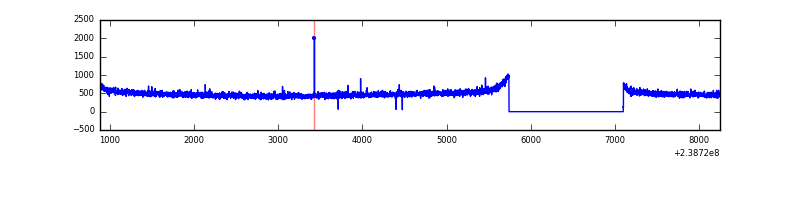 |
| B | 7368 | 6009 | 29 | 29 | 0.39% | 0.48% | 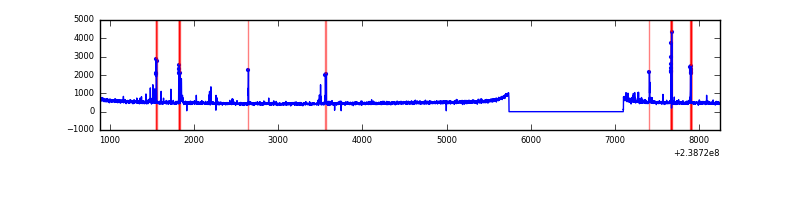 |
| C | 7368 | 6009 | 8 | 8 | 0.11% | 0.13% | 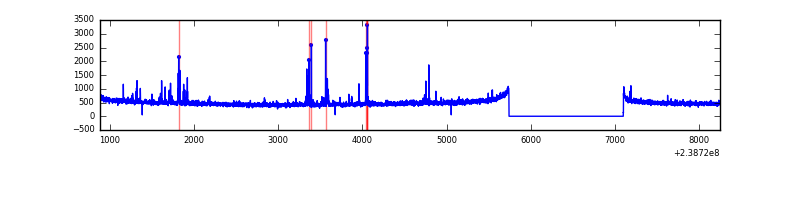 |
| D | 7368 | 6009 | 98 | 98 | 1.33% | 1.63% | 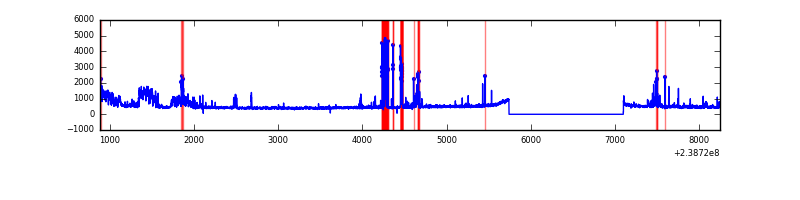 |
Top three noisy pixels from each quadrant. If the there are fewer than three noisy pixels in the level2.evt file, extra rows are filled as -1
| Pixel properties | Quadrant properties | ||||||
|---|---|---|---|---|---|---|---|
| Quadrant | DetID | PixID | Counts | Sigma | Mean | Median | Sigma |
| A | 13 | 251 | 18325 | 115.7 | 751 | 737 | 152.0 |
| A | 0 | 226 | 6857 | 40.26 | 751 | 737 | 152.0 |
| A | 12 | 194 | 5908 | 34.02 | 751 | 737 | 152.0 |
| B | 4 | 81 | 165677 | 1155.29 | 758 | 742 | 142.8 |
| B | 12 | 111 | 16599 | 111.07 | 758 | 742 | 142.8 |
| B | 11 | 111 | 13516 | 89.48 | 758 | 742 | 142.8 |
| C | 9 | 236 | 118936 | 703.45 | 731 | 738 | 168.0 |
| C | 13 | 61 | 5586 | 28.85 | 731 | 738 | 168.0 |
| C | 14 | 234 | 3666 | 17.43 | 731 | 738 | 168.0 |
| D | 1 | 52 | 672230 | 3637.59 | 707 | 693 | 184.6 |
| D | 10 | 172 | 73346 | 393.55 | 707 | 693 | 184.6 |
| D | 2 | 14 | 40924 | 217.92 | 707 | 693 | 184.6 |
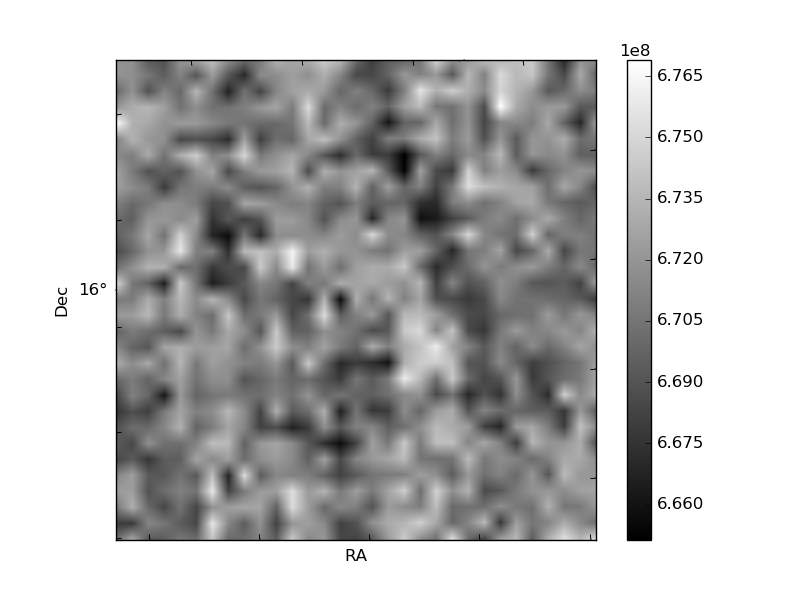
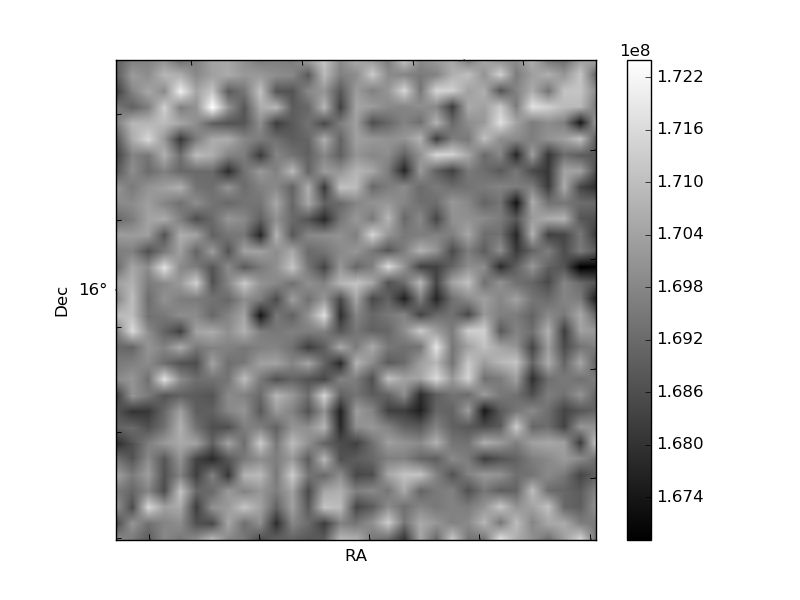
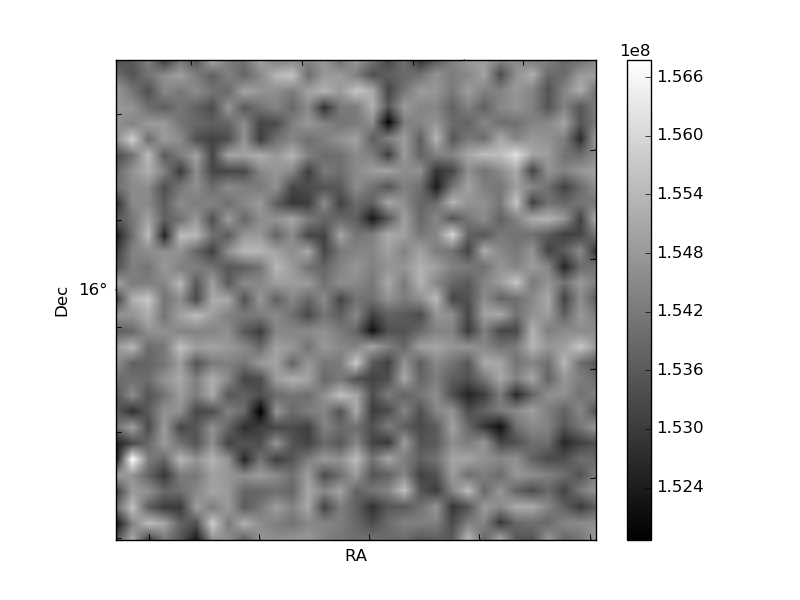
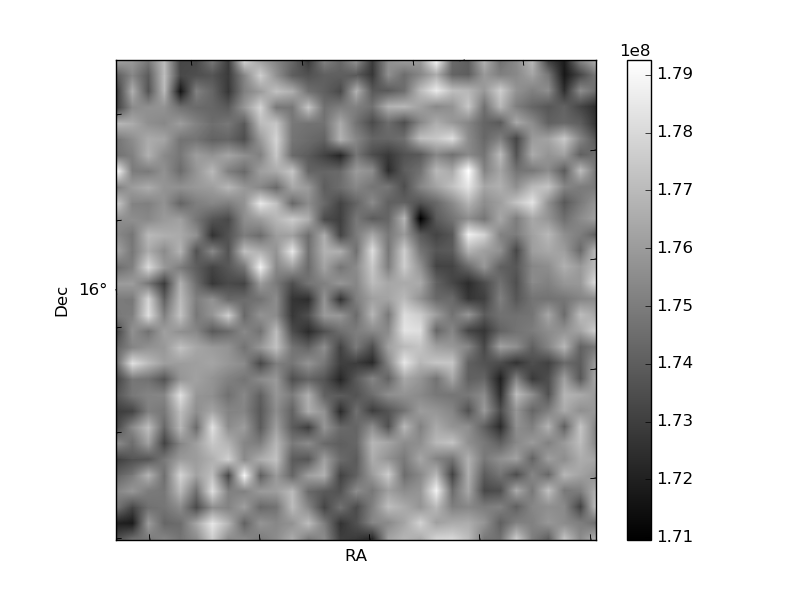
Histogram calculated using DETX and DETY for each event in the final _common_clean file
| Quadrant A | 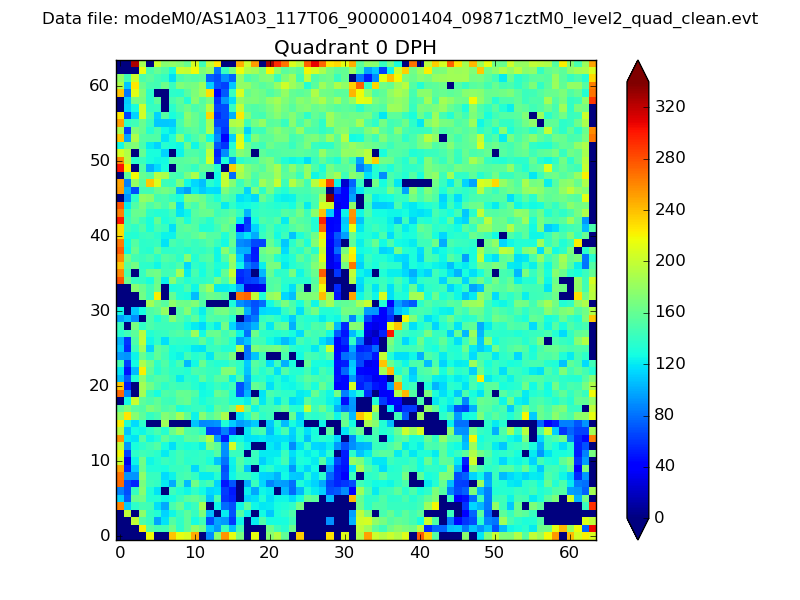 |
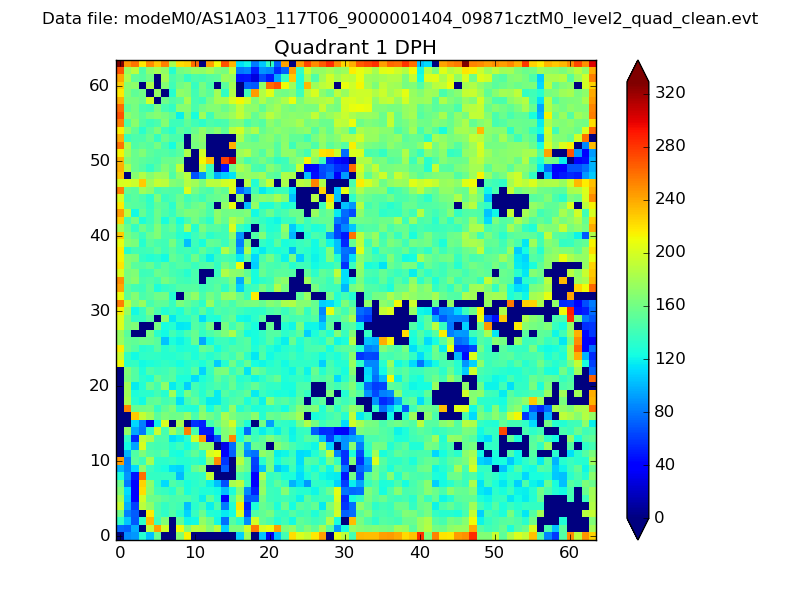 |
Quadrant B |
|---|---|---|---|
| Quadrant D | 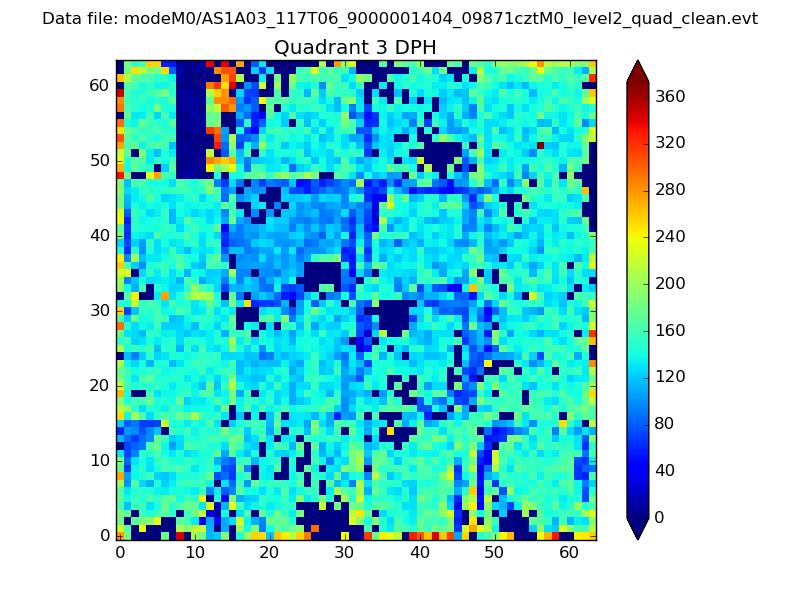 |
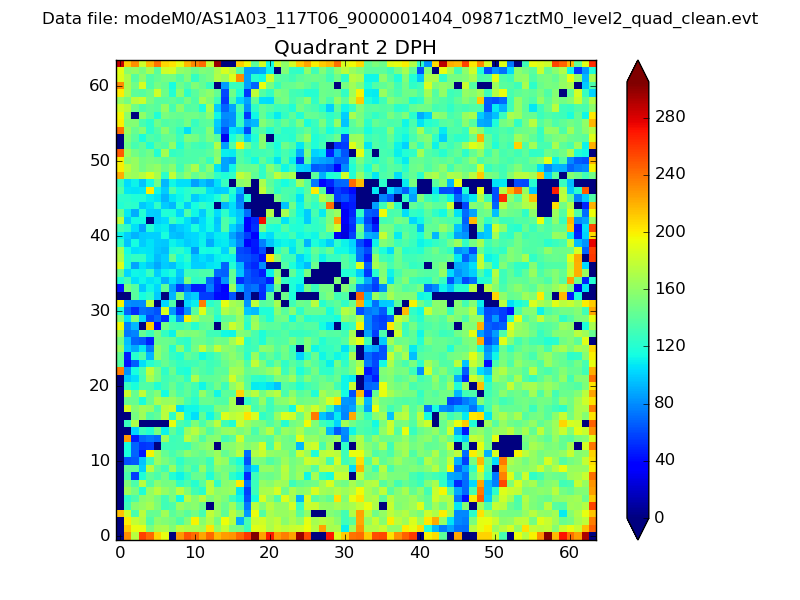 |
Quadrant C |
| Plot type | Count rate plots | Images |
|---|---|---|
| Comparison with Poisson distribution Blue bars denote a histogram of data divided into 1 sec bins. Red curve is a Poisson curve with rate = median count rate of data. |
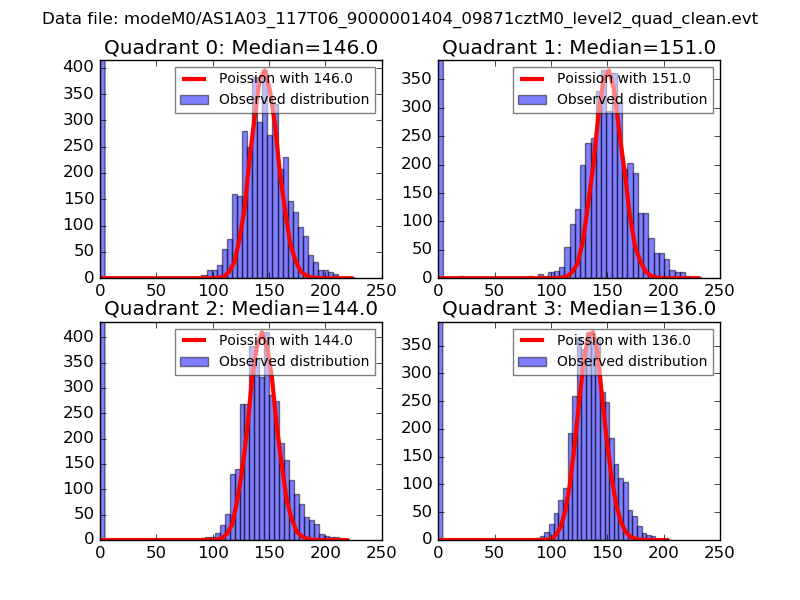 |
 |
| Quadrant-wise count rates Data is divided into 100 sec bins |
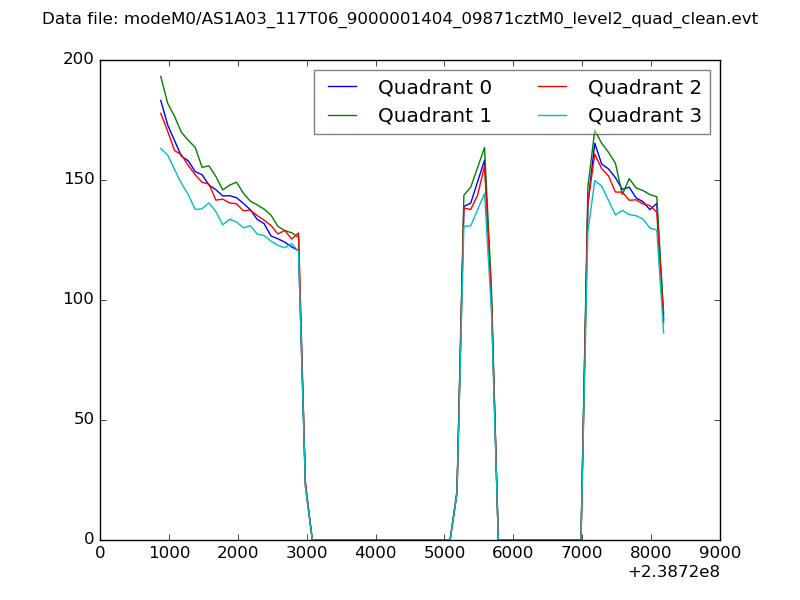 |
|
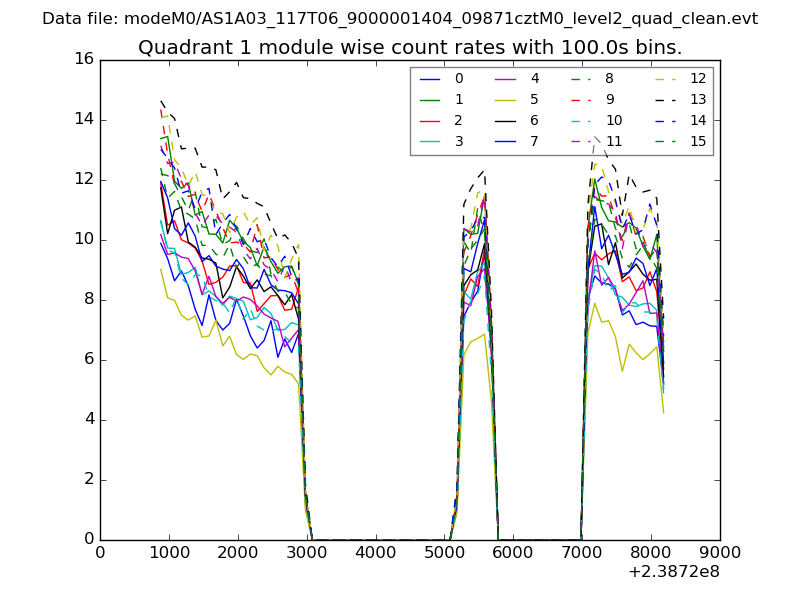
| Module-wise count rates for Quadrant A Data is divided into 100 sec bins |
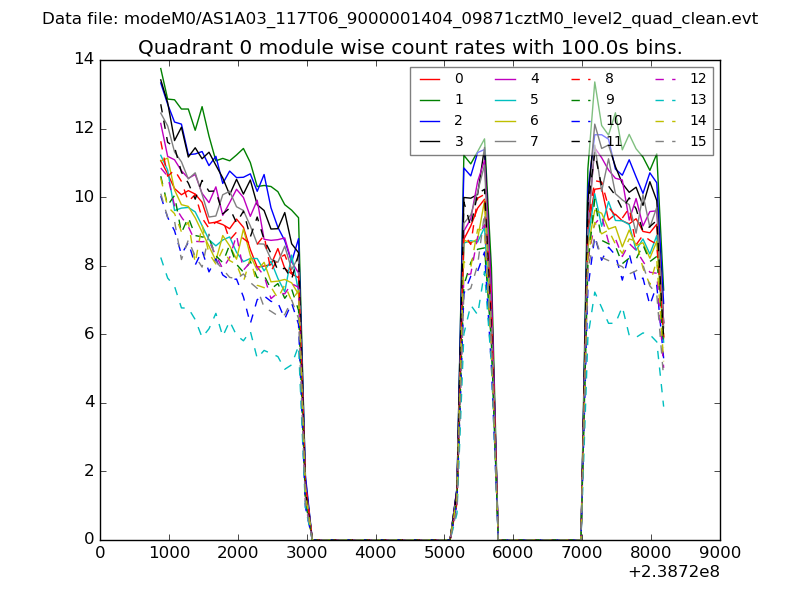 |
 |
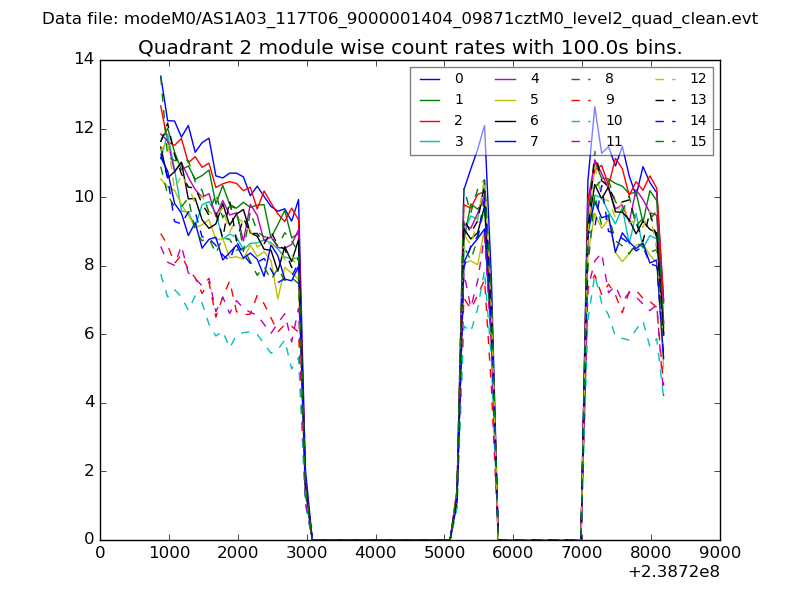
| Module-wise count rates for Quadrant B Data is divided into 100 sec bins |
 |
 |
| Module-wise count rates for Quadrant C Data is divided into 100 sec bins |
 |
 |
| Module-wise count rates for Quadrant D Data is divided into 100 sec bins |
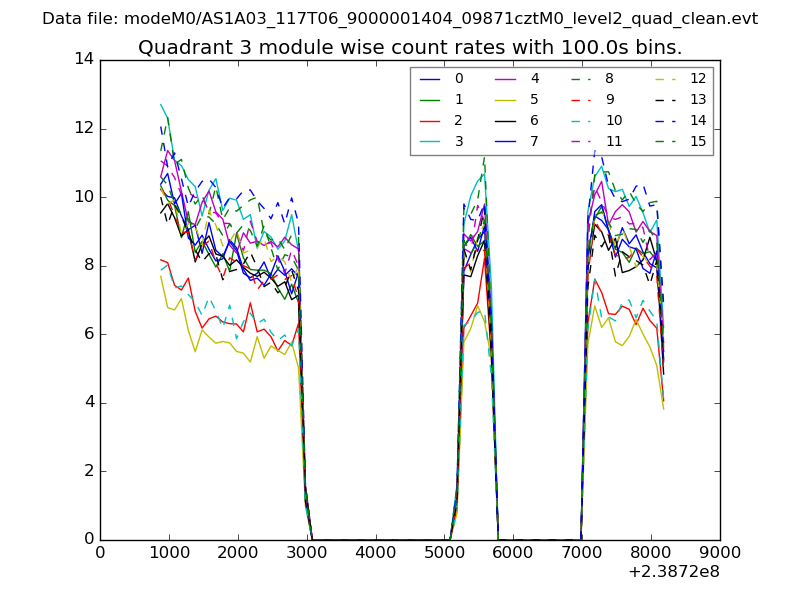 |
 |
| Parameter | Plot |
|---|---|
| CZT HV Monitor | 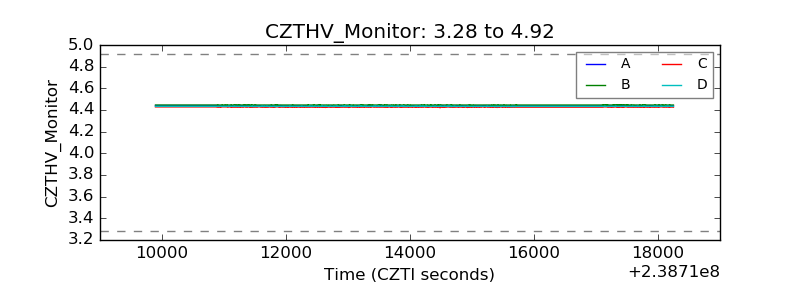 |
| D_VDD | 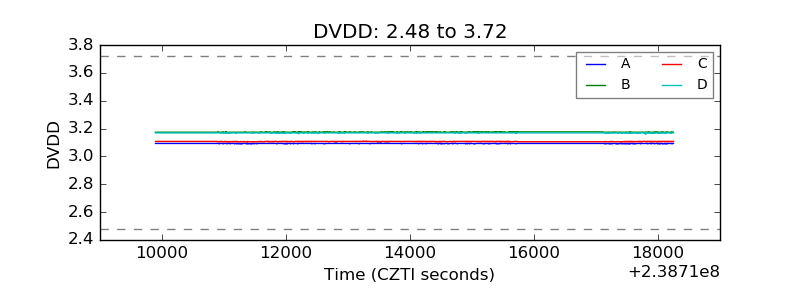 |
| Temperature 1 | 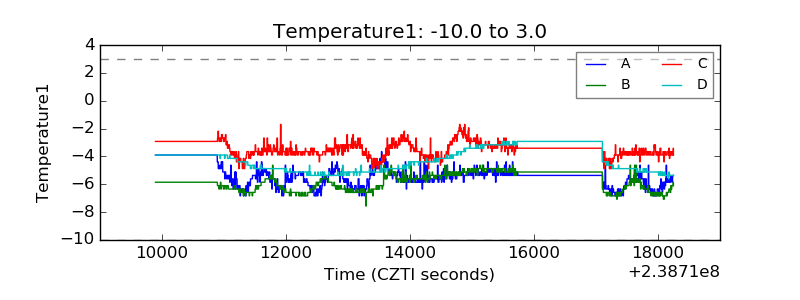 |
| Veto HV Monitor | 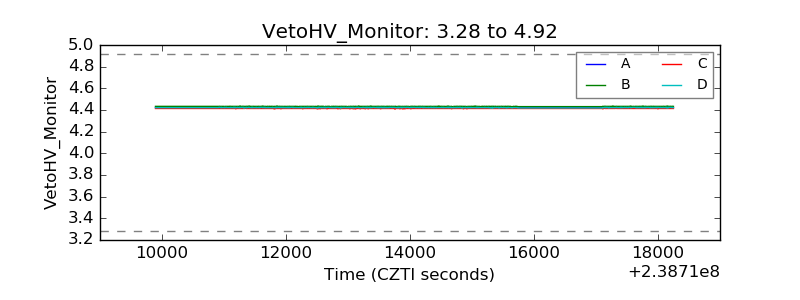 |
| Veto LLD | 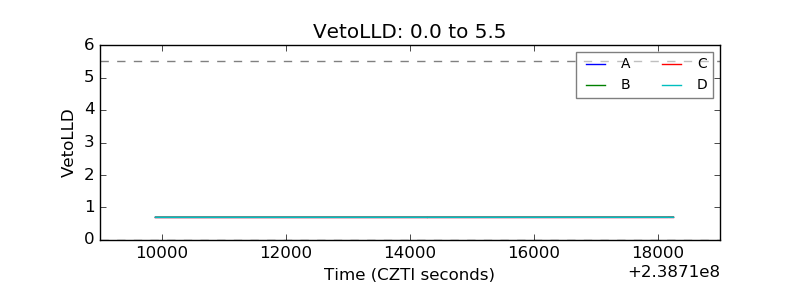 |
| Alpha Counter | 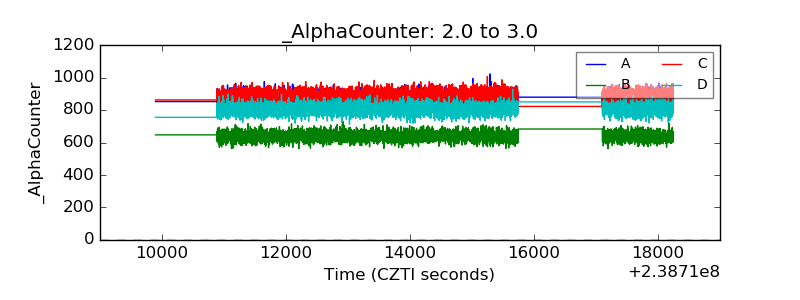 |
| _CPM_Rate | 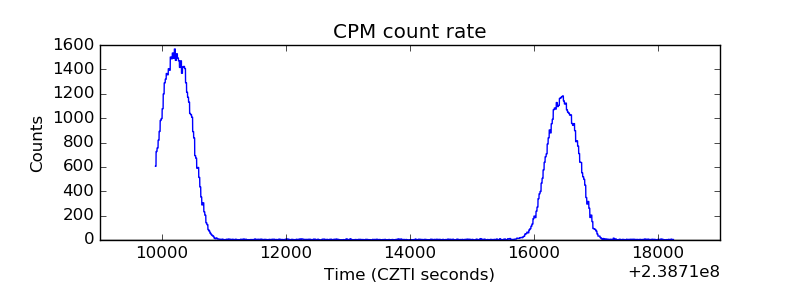 |
| CZT Counter | 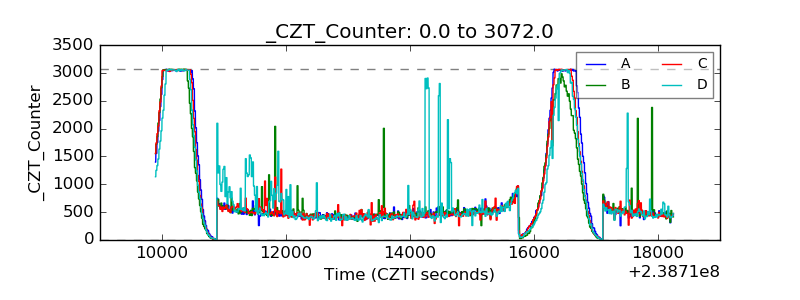 |
| +2.5 Volts monitor |  |
| +5 Volts monitor |  |
| _ROLL_ROT | 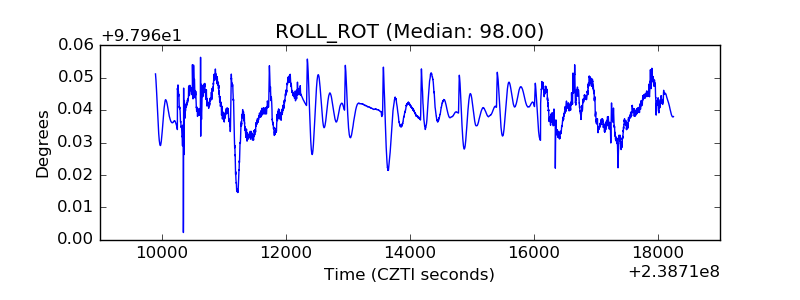 |
| _Roll_DEC | 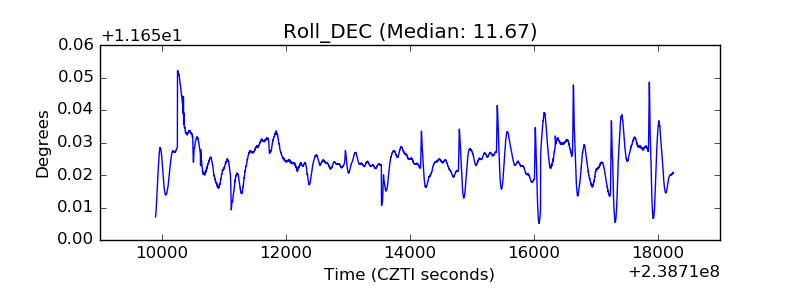 |
| _Roll_RA | 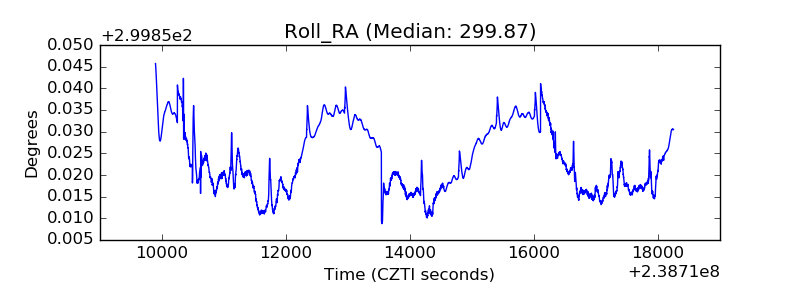 |
| Veto Counter | 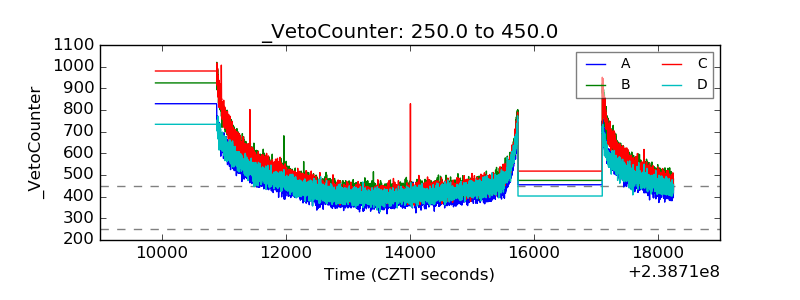 |