| Param | Original file | Final file |
|---|---|---|
| Filename | modeM0/AS1A03_117T06_9000001404_09872cztM0_level2.evt | modeM0/AS1A03_117T06_9000001404_09872cztM0_level2_quad_clean.evt |
| Size (bytes) | 415,399,680 | 86,284,800 |
| Size | 396.2 MB | 82.3 MB |
| Events in quadrant A | 2,970,325 | 550,269 |
| Events in quadrant B | 3,072,100 | 568,354 |
| Events in quadrant C | 3,019,940 | 542,520 |
| Events in quadrant D | 3,095,373 | 517,975 |
| Mode M9 | |||
|---|---|---|---|
| Quadrant | BADHDUFLAG | Total packets | Discarded packets |
| A | 0 | 17 | 0 |
| B | 0 | 17 | 0 |
| C | 0 | 17 | 0 |
| D | 0 | 18 | 0 |
| Mode M0 | |||
|---|---|---|---|
| Quadrant | BADHDUFLAG | Total packets | Discarded packets |
| A | 0 | 12866 | 3 |
| B | 0 | 13130 | 5 |
| C | 0 | 13213 | 6 |
| D | 0 | 13415 | 2 |
| Mode SS | |||
|---|---|---|---|
| Quadrant | BADHDUFLAG | Total packets | Discarded packets |
| A | 0 | 126 | 0 |
| B | 0 | 126 | 0 |
| C | 0 | 126 | 0 |
| D | 0 | 126 | 0 |
| Quadrant | Total seconds | Saturated seconds | Saturation percentage |
|---|---|---|---|
| A | 6216 | 8 | 0.128700% |
| B | 6215 | 47 | 0.756235% |
| C | 6215 | 55 | 0.884956% |
| D | 6216 | 26 | 0.418275% |
Noise dominated data is calculated using 1-second bins in cleaned event files. If a bin has >2000 counts, and if more than 50% of those come from <1% of pixels, then it is considered to be noise-dominated and hence unusable.
| Quadrant | # 1 sec bins | Bins with >0 counts | Bins with >2000 counts | High rate bins dominated by noise | Noise dominated (total time) | Noise dominated (detector-on time) | Marked lightcurve |
|---|---|---|---|---|---|---|---|
| A | 7566 | 6217 | 0 | 0 | 0.00% | 0.00% |  |
| B | 7566 | 6217 | 18 | 18 | 0.24% | 0.29% | 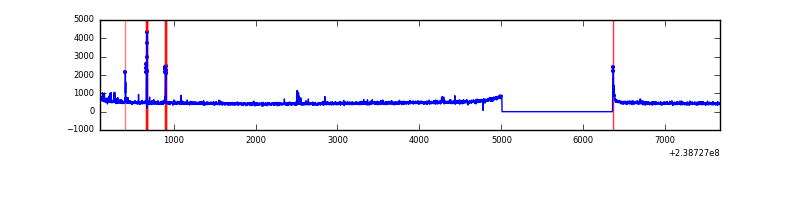 |
| C | 7566 | 6217 | 25 | 25 | 0.33% | 0.40% | 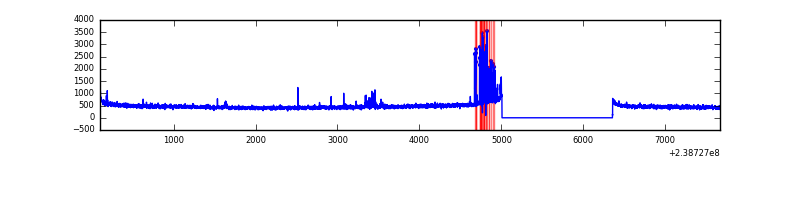 |
| D | 7566 | 6217 | 17 | 17 | 0.22% | 0.27% |  |
Top three noisy pixels from each quadrant. If the there are fewer than three noisy pixels in the level2.evt file, extra rows are filled as -1
| Pixel properties | Quadrant properties | ||||||
|---|---|---|---|---|---|---|---|
| Quadrant | DetID | PixID | Counts | Sigma | Mean | Median | Sigma |
| A | 15 | 174 | 33755 | 214.02 | 761 | 748 | 154.2 |
| A | 0 | 167 | 8927 | 53.03 | 761 | 748 | 154.2 |
| A | 0 | 226 | 7567 | 44.22 | 761 | 748 | 154.2 |
| B | 4 | 81 | 92051 | 626.08 | 766 | 749 | 145.8 |
| B | 12 | 111 | 17160 | 112.53 | 766 | 749 | 145.8 |
| B | 11 | 111 | 14084 | 91.44 | 766 | 749 | 145.8 |
| C | 14 | 234 | 132756 | 785.05 | 731 | 737 | 168.2 |
| C | 9 | 236 | 23321 | 134.3 | 731 | 737 | 168.2 |
| C | 1 | 3 | 7178 | 38.3 | 731 | 737 | 168.2 |
| D | 1 | 52 | 147790 | 785.01 | 722 | 706 | 187.4 |
| D | 10 | 172 | 85238 | 451.16 | 722 | 706 | 187.4 |
| D | 2 | 14 | 41008 | 215.1 | 722 | 706 | 187.4 |
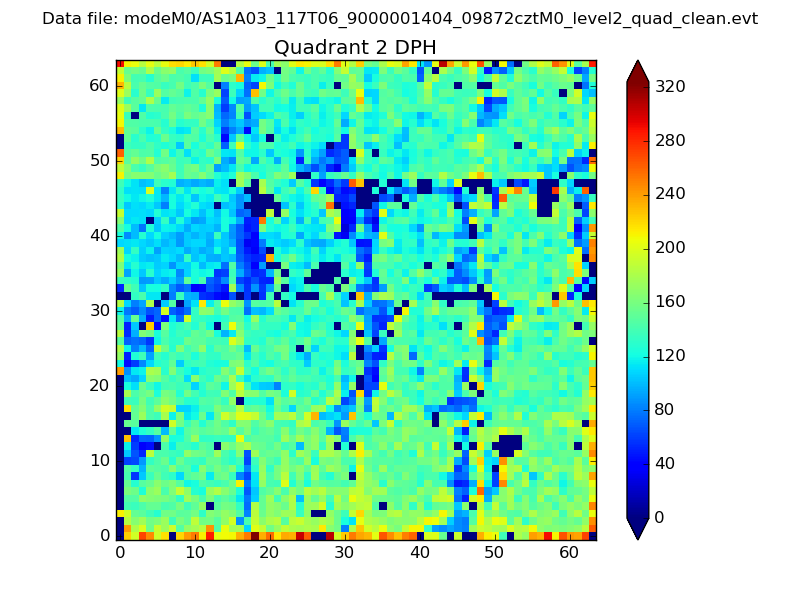
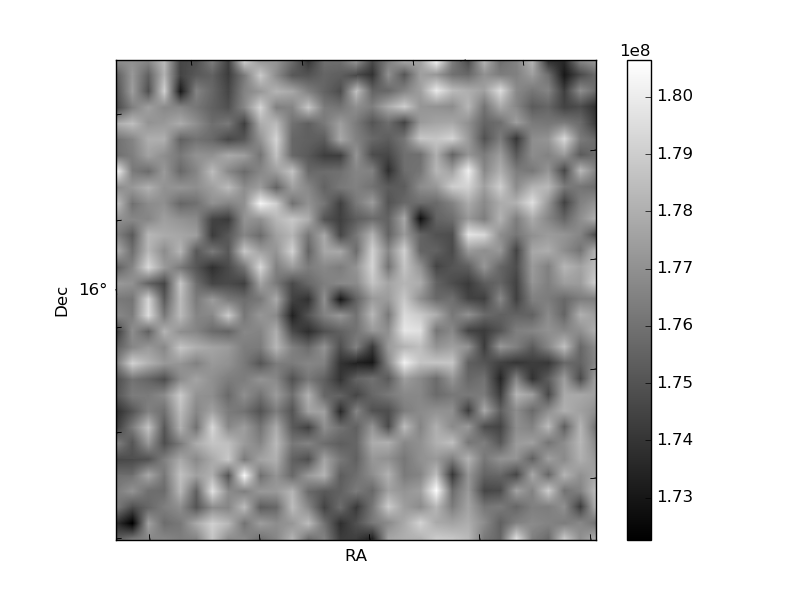
Histogram calculated using DETX and DETY for each event in the final _common_clean file
| Quadrant A | 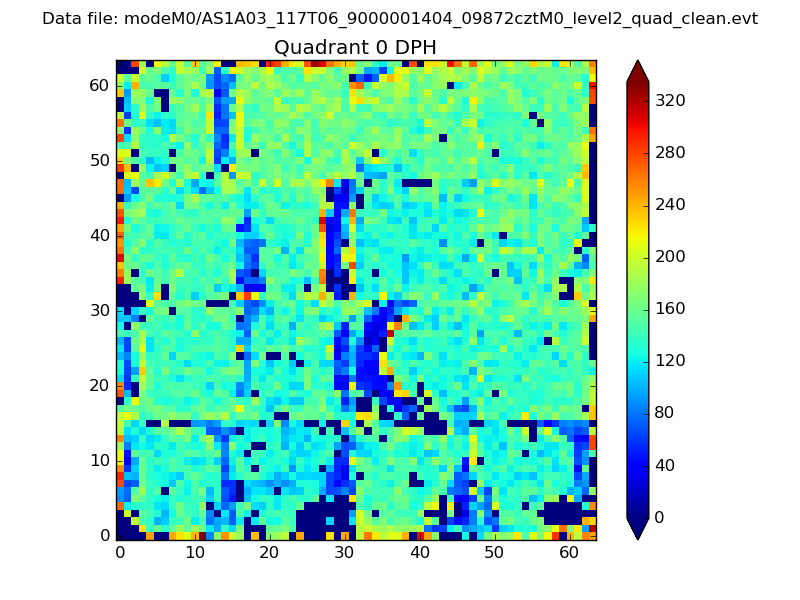 |
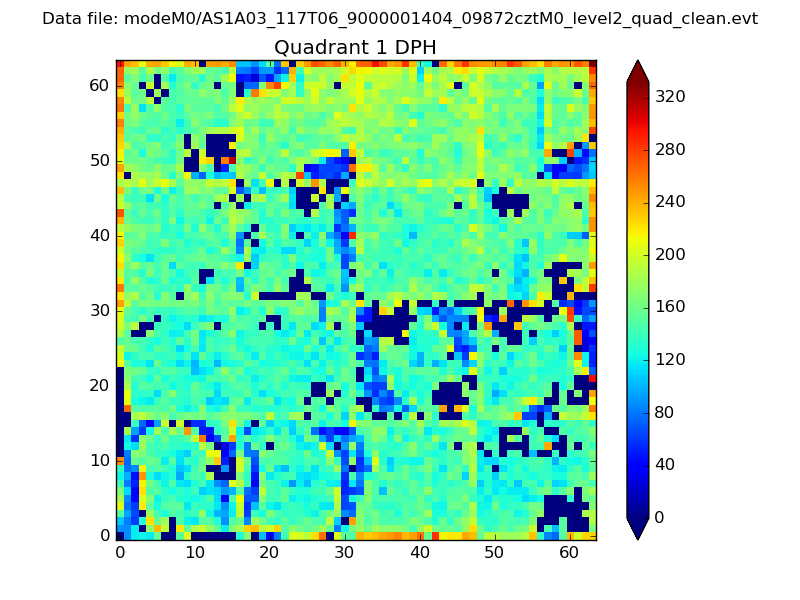 |
Quadrant B |
|---|---|---|---|
| Quadrant D | 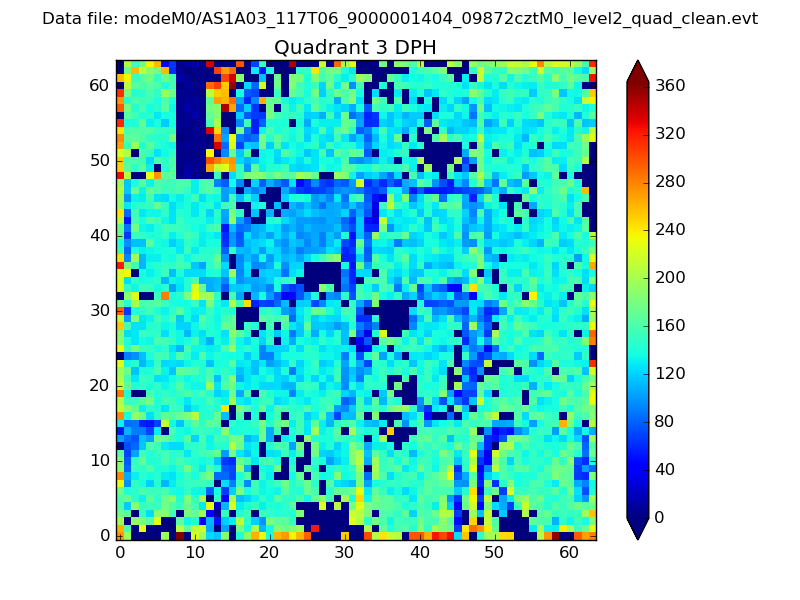 |
 |
Quadrant C |
| Plot type | Count rate plots | Images |
|---|---|---|
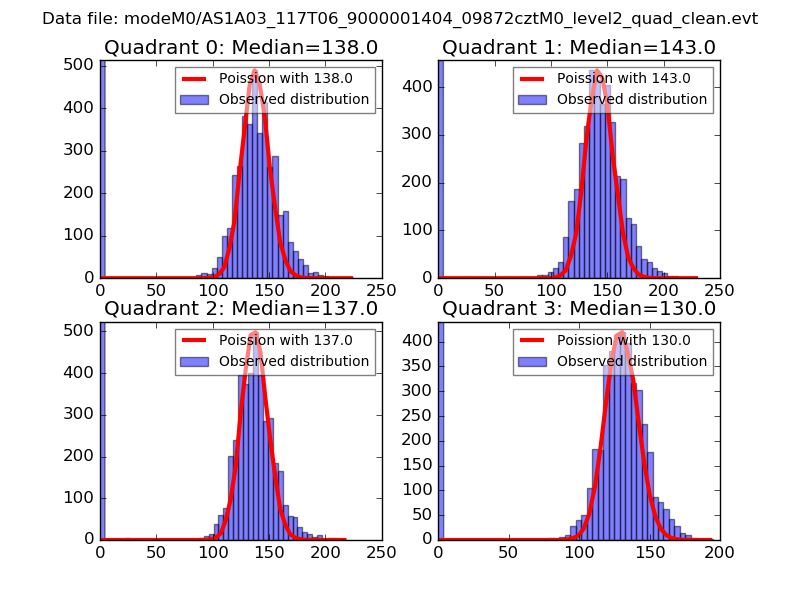
| Comparison with Poisson distribution Blue bars denote a histogram of data divided into 1 sec bins. Red curve is a Poisson curve with rate = median count rate of data. |
 |
 |
| Quadrant-wise count rates Data is divided into 100 sec bins |
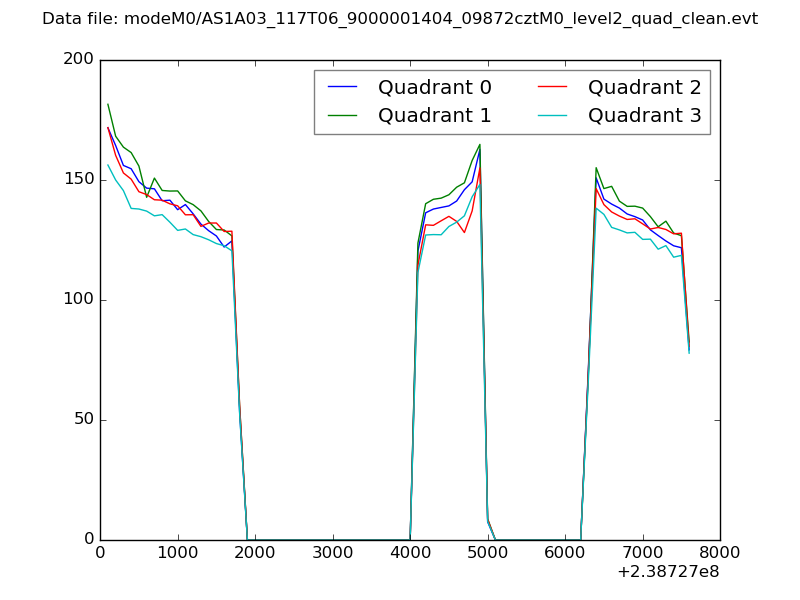 |
|
| Module-wise count rates for Quadrant A Data is divided into 100 sec bins |
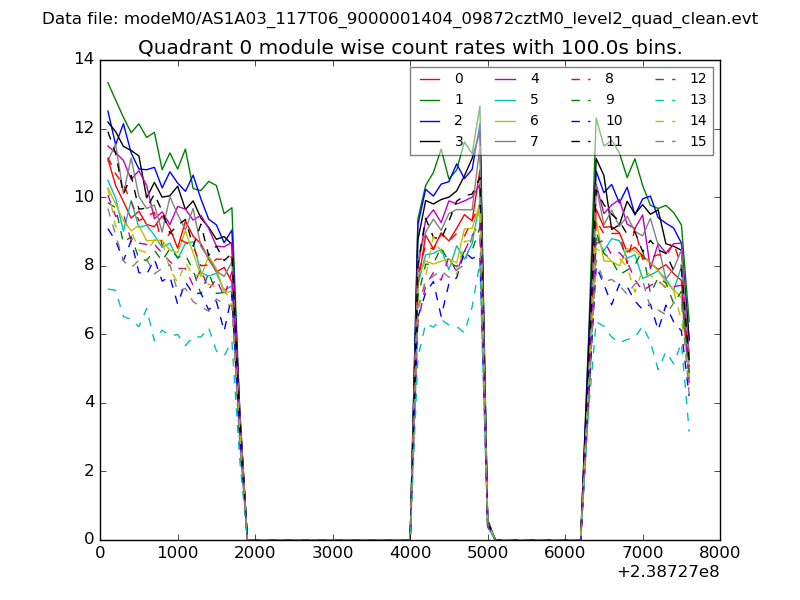 |
 |
| Module-wise count rates for Quadrant B Data is divided into 100 sec bins |
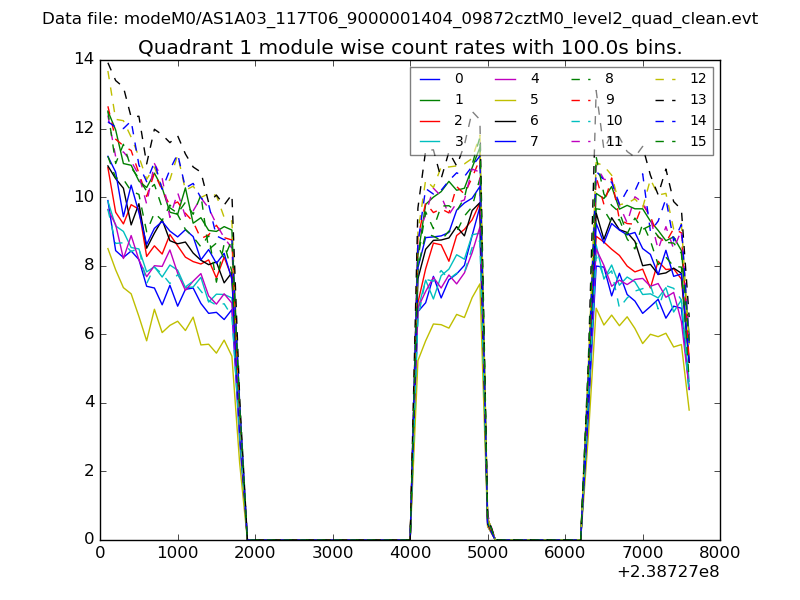 |
 |
| Module-wise count rates for Quadrant C Data is divided into 100 sec bins |
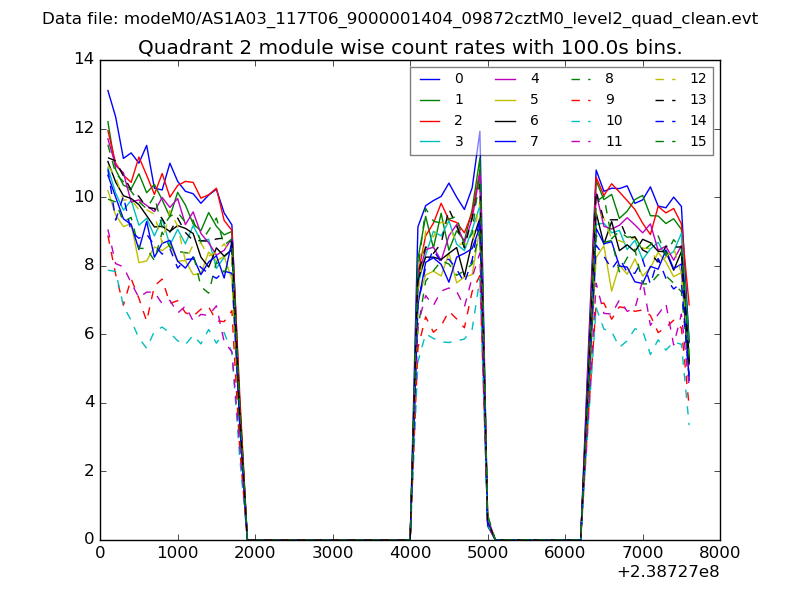 |
 |
| Module-wise count rates for Quadrant D Data is divided into 100 sec bins |
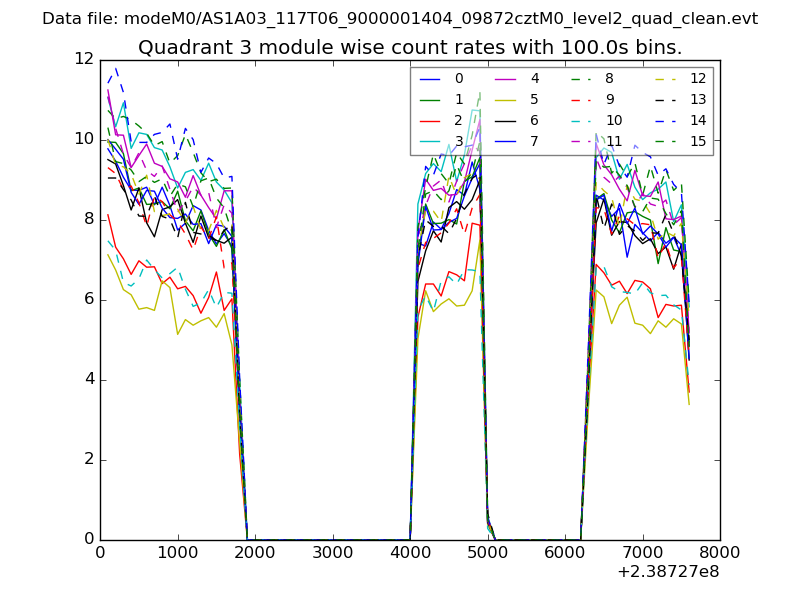 |
 |
| Parameter | Plot |
|---|---|
| CZT HV Monitor | 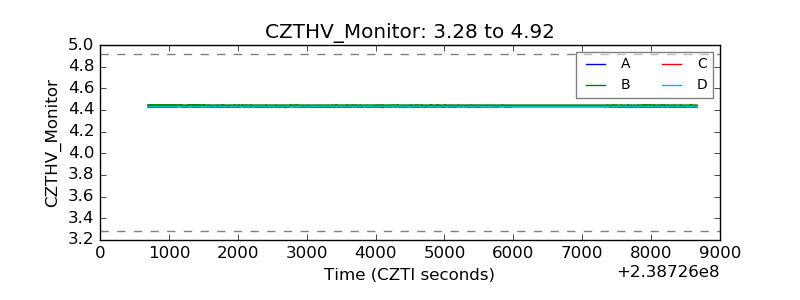 |
| D_VDD | 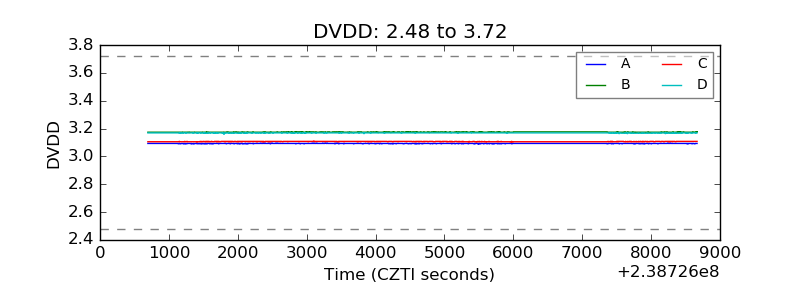 |
| Temperature 1 | 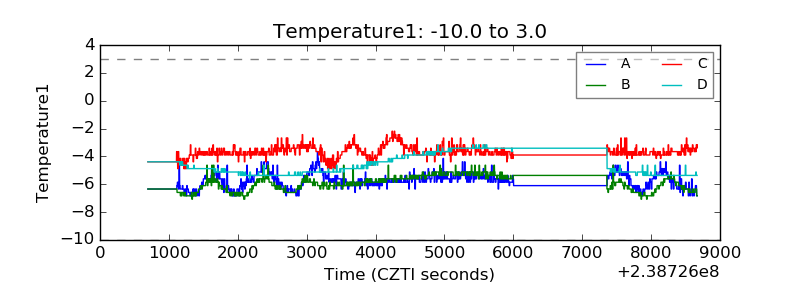 |
| Veto HV Monitor | 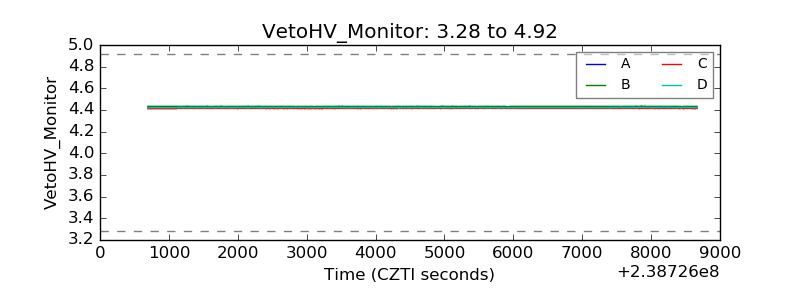 |
| Veto LLD | 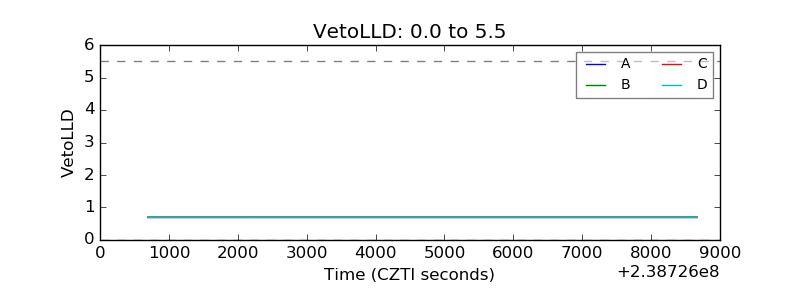 |
| Alpha Counter | 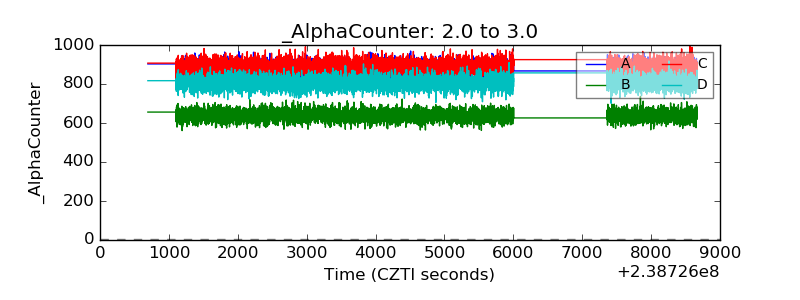 |
| _CPM_Rate | 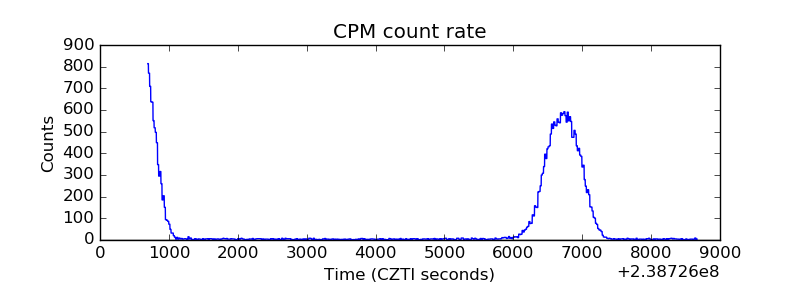 |
| CZT Counter | 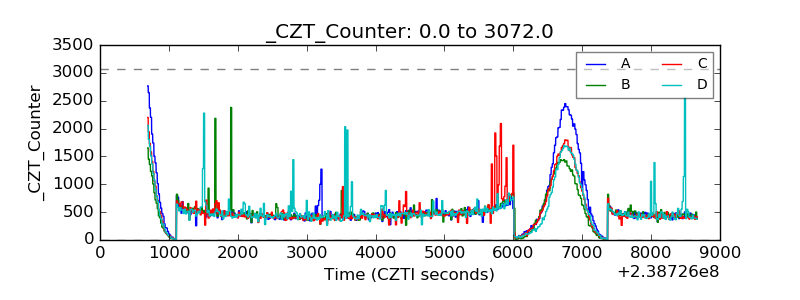 |
| +2.5 Volts monitor |  |
| +5 Volts monitor |  |
| _ROLL_ROT | 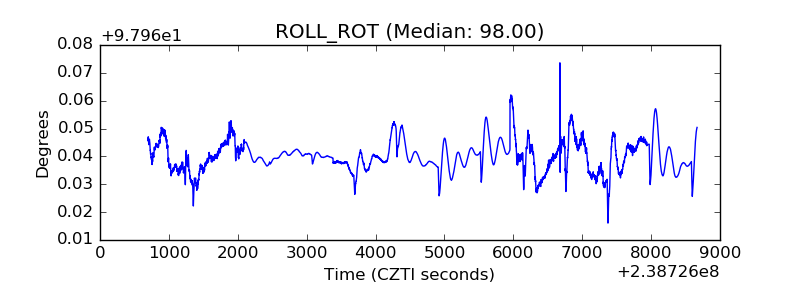 |
| _Roll_DEC | 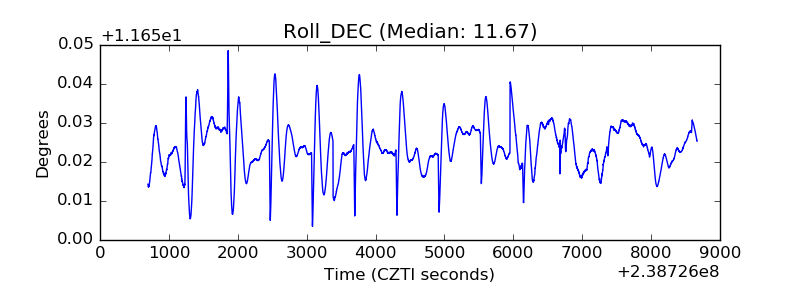 |
| _Roll_RA | 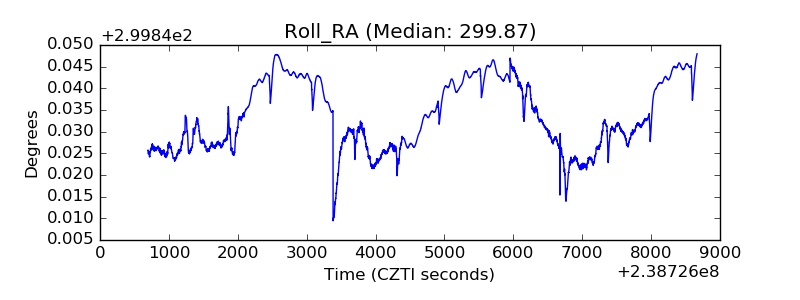 |
| Veto Counter | 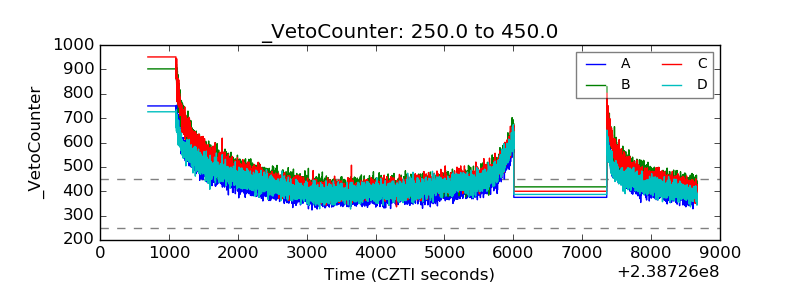 |