| Param | Original file | Final file |
|---|---|---|
| Filename | modeM0/AS1A03_117T06_9000001404_09873cztM0_level2.evt | modeM0/AS1A03_117T06_9000001404_09873cztM0_level2_quad_clean.evt |
| Size (bytes) | 432,325,440 | 82,186,560 |
| Size | 412.3 MB | 78.4 MB |
| Events in quadrant A | 3,019,532 | 512,014 |
| Events in quadrant B | 3,102,074 | 529,960 |
| Events in quadrant C | 3,172,031 | 508,858 |
| Events in quadrant D | 3,355,850 | 483,079 |
| Mode M9 | |||
|---|---|---|---|
| Quadrant | BADHDUFLAG | Total packets | Discarded packets |
| A | 0 | 17 | 0 |
| B | 0 | 17 | 0 |
| C | 0 | 17 | 0 |
| D | 0 | 18 | 0 |
| Mode M0 | |||
|---|---|---|---|
| Quadrant | BADHDUFLAG | Total packets | Discarded packets |
| A | 0 | 13332 | 6 |
| B | 0 | 13439 | 2 |
| C | 0 | 13899 | 6 |
| D | 0 | 14564 | 2 |
| Mode SS | |||
|---|---|---|---|
| Quadrant | BADHDUFLAG | Total packets | Discarded packets |
| A | 0 | 134 | 0 |
| B | 0 | 134 | 0 |
| C | 0 | 134 | 0 |
| D | 0 | 134 | 0 |
| Quadrant | Total seconds | Saturated seconds | Saturation percentage |
|---|---|---|---|
| A | 6516 | 27 | 0.414365% |
| B | 6517 | 56 | 0.859291% |
| C | 6515 | 37 | 0.567920% |
| D | 6517 | 74 | 1.135492% |
Noise dominated data is calculated using 1-second bins in cleaned event files. If a bin has >2000 counts, and if more than 50% of those come from <1% of pixels, then it is considered to be noise-dominated and hence unusable.
| Quadrant | # 1 sec bins | Bins with >0 counts | Bins with >2000 counts | High rate bins dominated by noise | Noise dominated (total time) | Noise dominated (detector-on time) | Marked lightcurve |
|---|---|---|---|---|---|---|---|
| A | 7572 | 6518 | 0 | 0 | 0.00% | 0.00% | 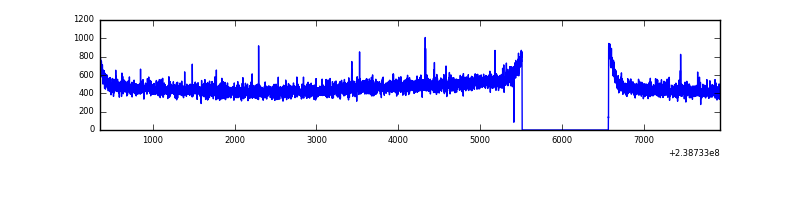 |
| B | 7572 | 6518 | 2 | 2 | 0.03% | 0.03% | 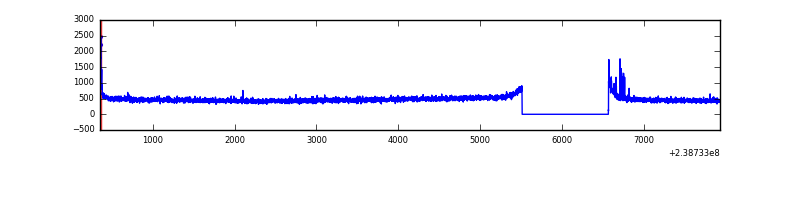 |
| C | 7572 | 6518 | 9 | 9 | 0.12% | 0.14% |  |
| D | 7572 | 6518 | 51 | 51 | 0.67% | 0.78% | 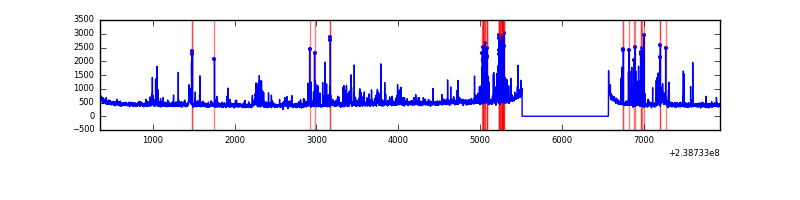 |
Top three noisy pixels from each quadrant. If the there are fewer than three noisy pixels in the level2.evt file, extra rows are filled as -1
| Pixel properties | Quadrant properties | ||||||
|---|---|---|---|---|---|---|---|
| Quadrant | DetID | PixID | Counts | Sigma | Mean | Median | Sigma |
| A | 0 | 226 | 7157 | 40.39 | 782 | 766 | 158.2 |
| A | 12 | 194 | 6039 | 33.32 | 782 | 766 | 158.2 |
| A | 13 | 253 | 4127 | 21.24 | 782 | 766 | 158.2 |
| B | 4 | 81 | 40689 | 266.0 | 787 | 771 | 150.1 |
| B | 12 | 111 | 17916 | 114.25 | 787 | 771 | 150.1 |
| B | 11 | 111 | 14856 | 93.86 | 787 | 771 | 150.1 |
| C | 4 | 254 | 143965 | 813.96 | 756 | 759 | 175.9 |
| C | 1 | 3 | 50545 | 282.97 | 756 | 759 | 175.9 |
| C | 14 | 234 | 17807 | 96.9 | 756 | 759 | 175.9 |
| D | 10 | 253 | 196561 | 1013.29 | 744 | 731 | 193.3 |
| D | 10 | 172 | 185480 | 955.95 | 744 | 731 | 193.3 |
| D | 1 | 52 | 108931 | 559.86 | 744 | 731 | 193.3 |
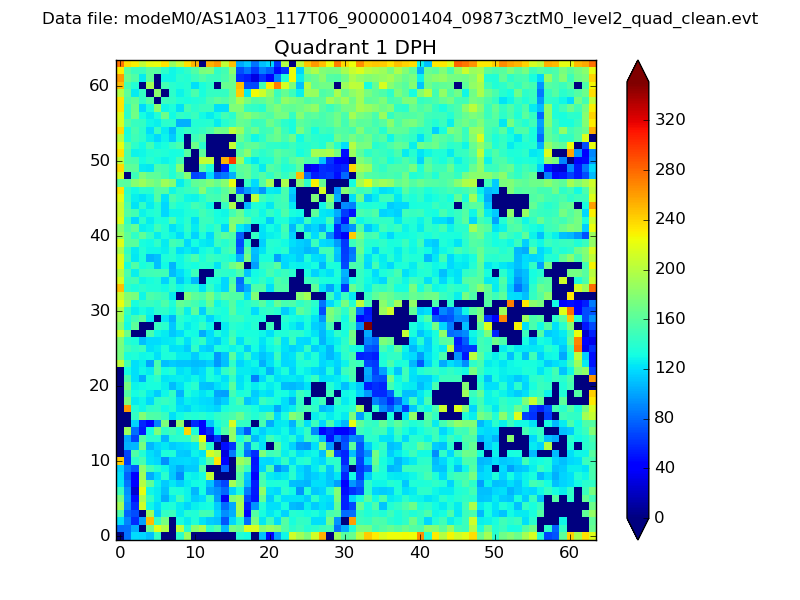
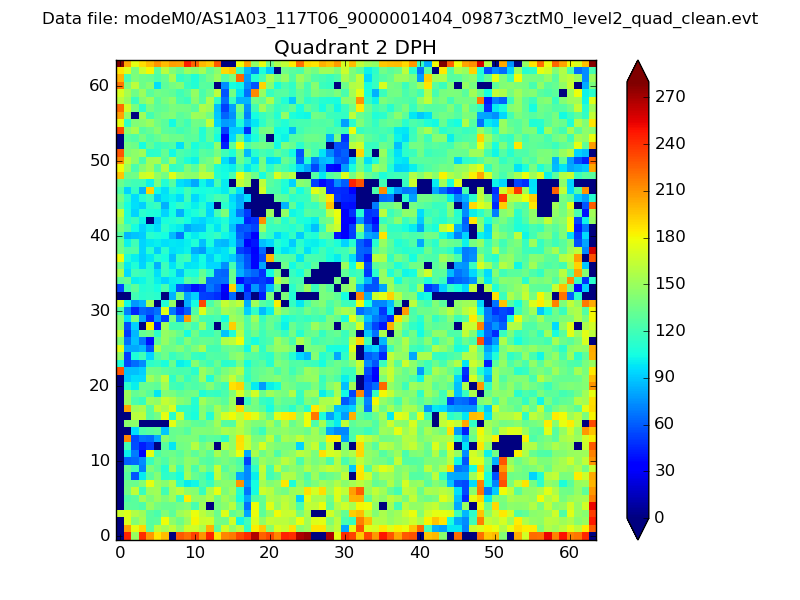
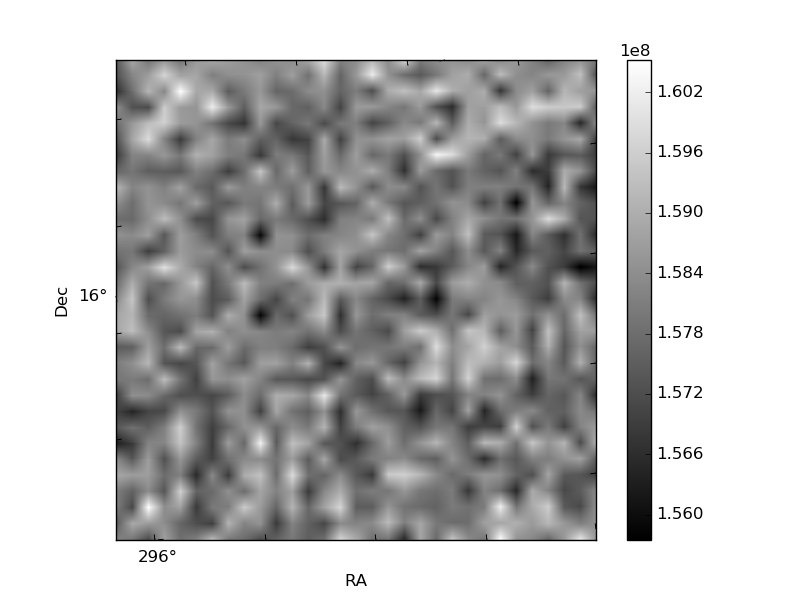
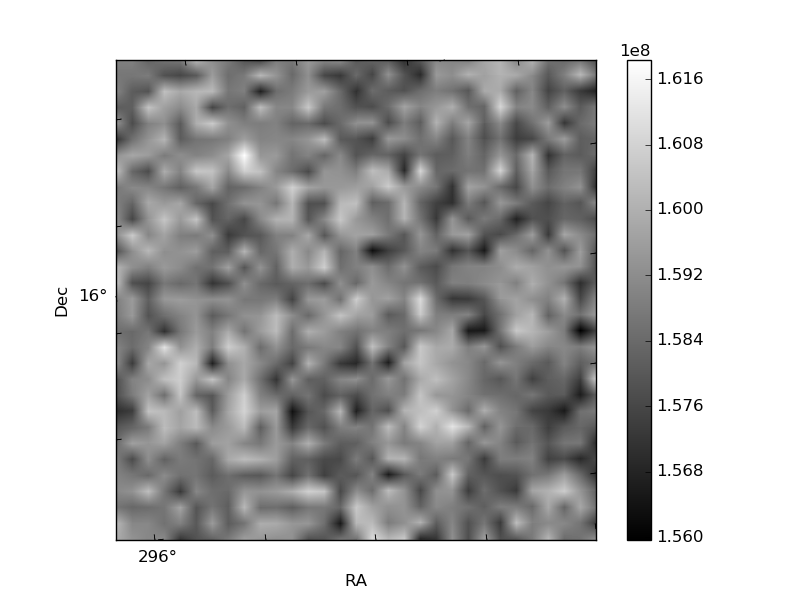
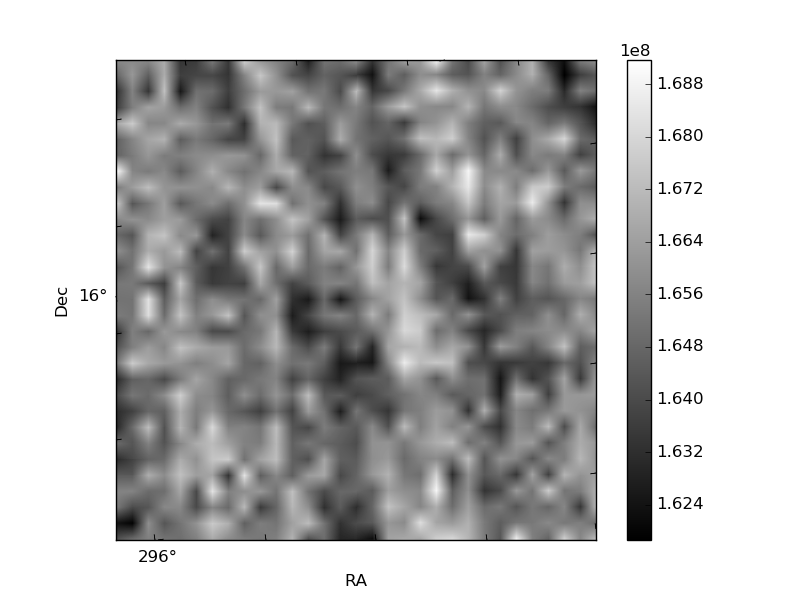
Histogram calculated using DETX and DETY for each event in the final _common_clean file
| Quadrant A |  |
 |
Quadrant B |
|---|---|---|---|
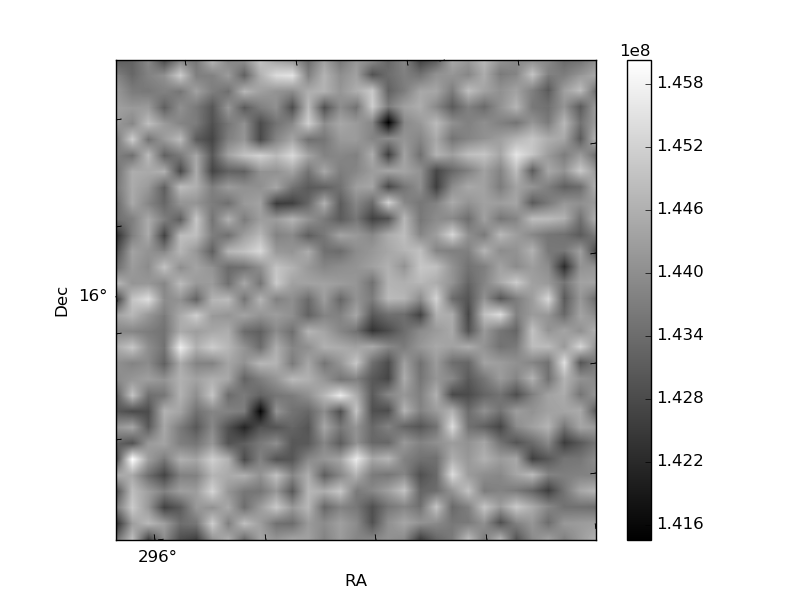
| Quadrant D | 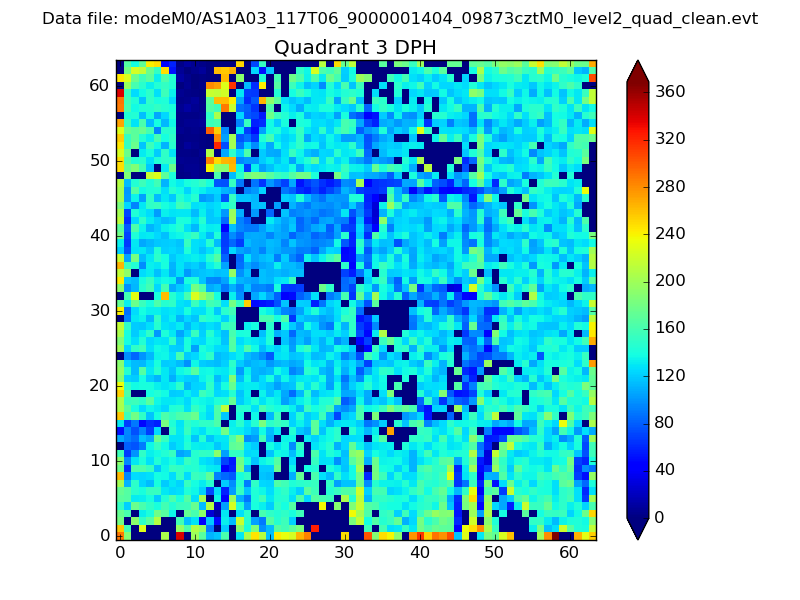 |
 |
Quadrant C |
| Plot type | Count rate plots | Images |
|---|---|---|
| Comparison with Poisson distribution Blue bars denote a histogram of data divided into 1 sec bins. Red curve is a Poisson curve with rate = median count rate of data. |
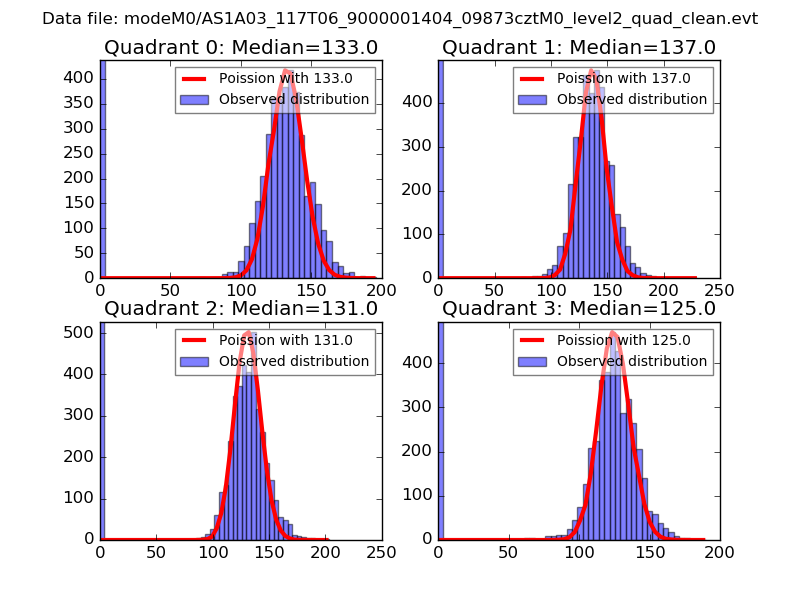 |
 |
| Quadrant-wise count rates Data is divided into 100 sec bins |
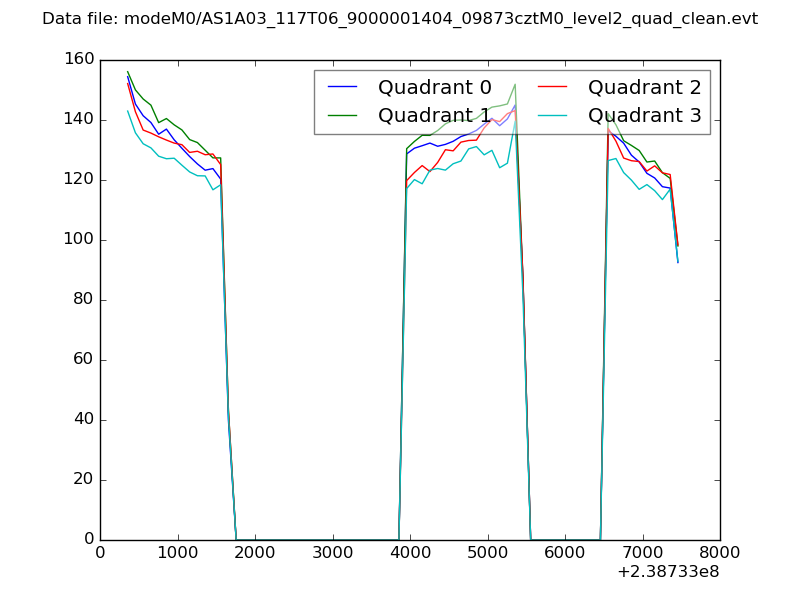 |
|
| Module-wise count rates for Quadrant A Data is divided into 100 sec bins |
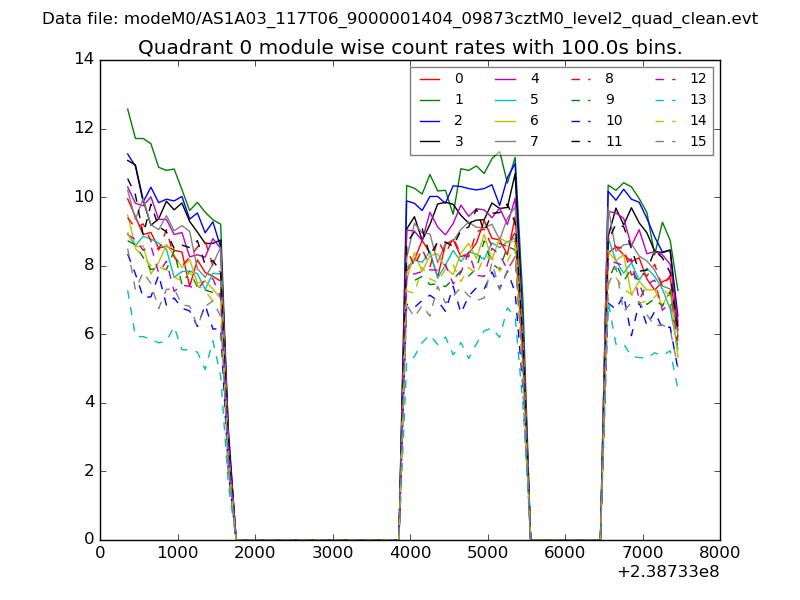 |
 |
| Module-wise count rates for Quadrant B Data is divided into 100 sec bins |
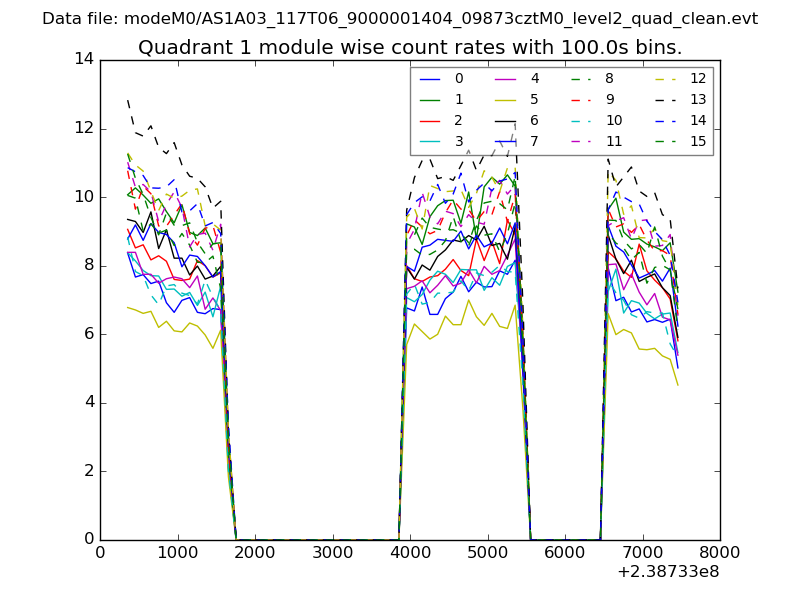 |
 |
| Module-wise count rates for Quadrant C Data is divided into 100 sec bins |
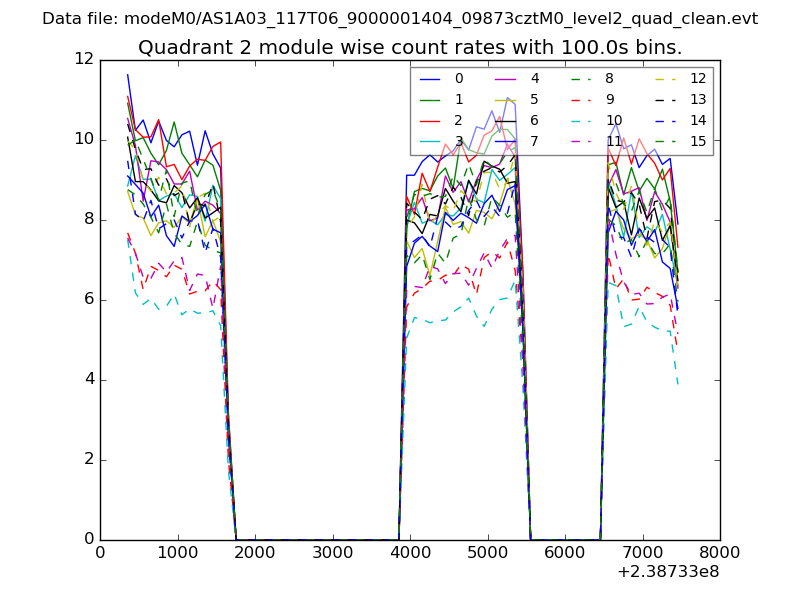 |
 |
| Module-wise count rates for Quadrant D Data is divided into 100 sec bins |
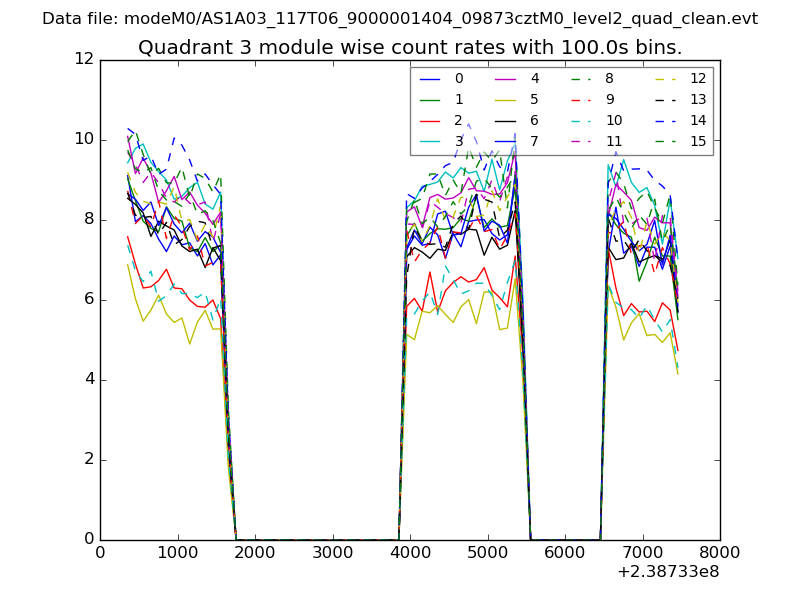 |
 |
| Parameter | Plot |
|---|---|
| CZT HV Monitor | 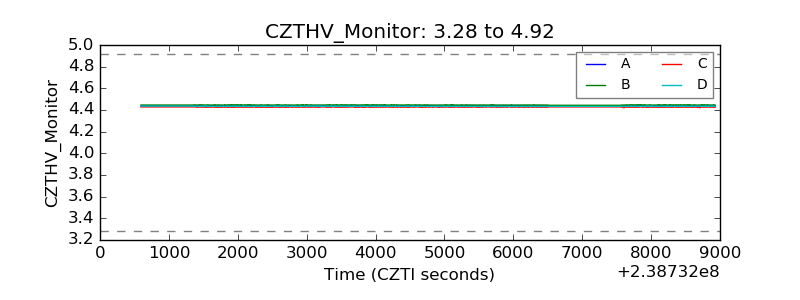 |
| D_VDD | 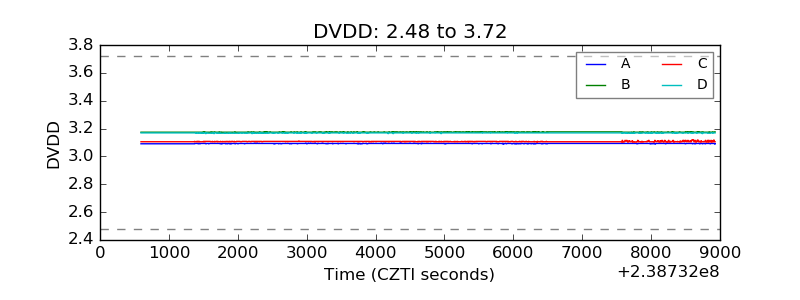 |
| Temperature 1 | 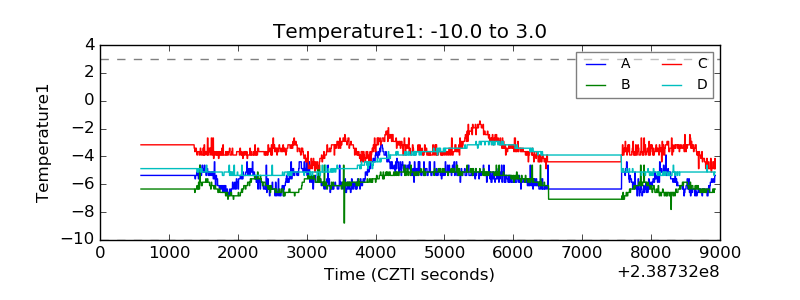 |
| Veto HV Monitor | 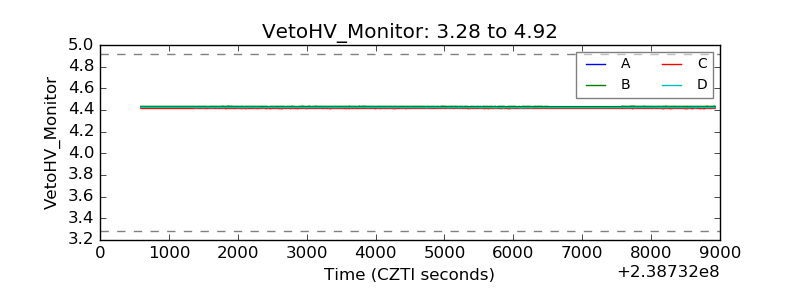 |
| Veto LLD | 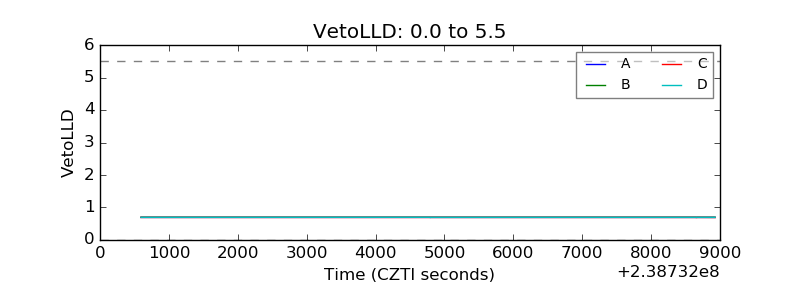 |
| Alpha Counter | 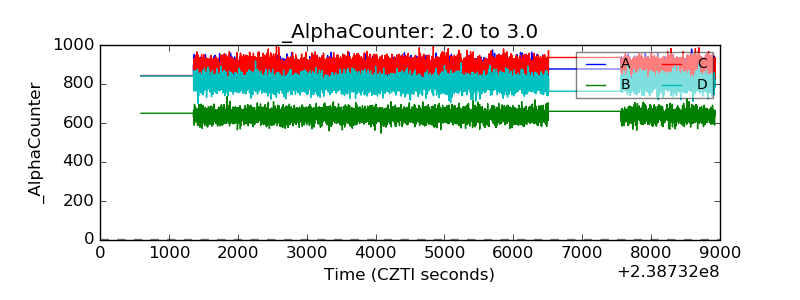 |
| _CPM_Rate | 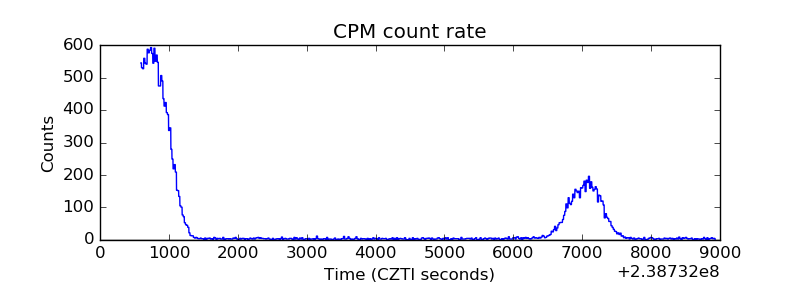 |
| CZT Counter | 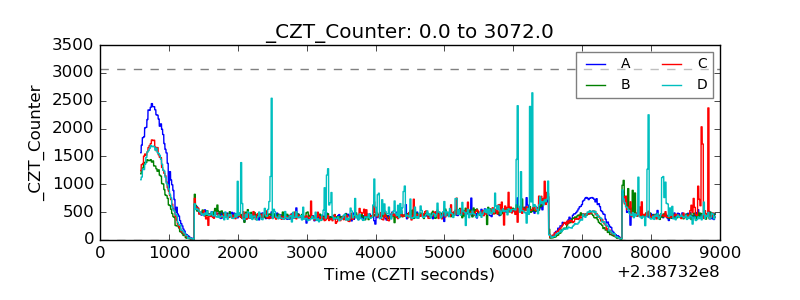 |
| +2.5 Volts monitor |  |
| +5 Volts monitor |  |
| _ROLL_ROT | 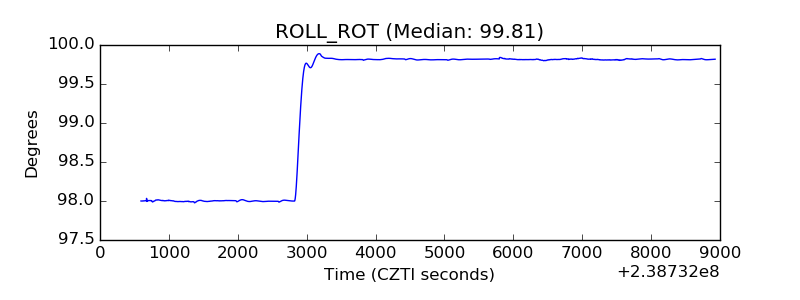 |
| _Roll_DEC | 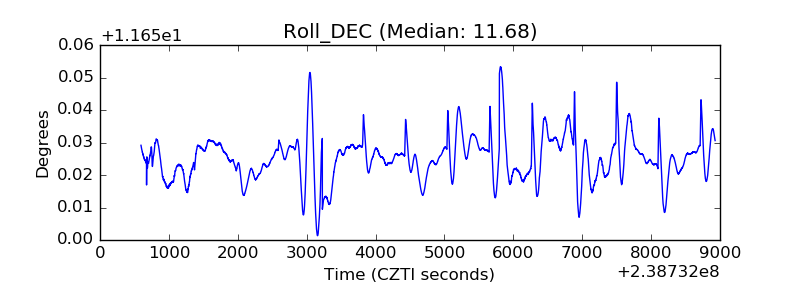 |
| _Roll_RA | 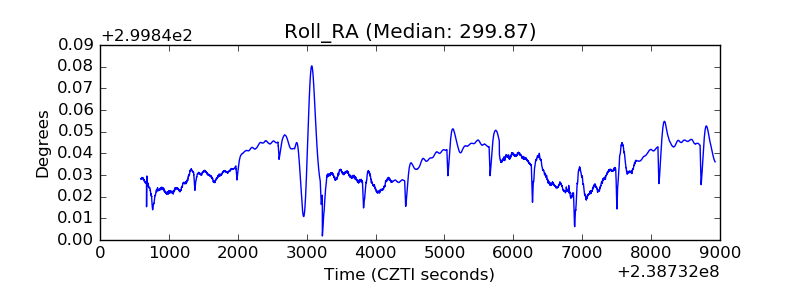 |
| Veto Counter | 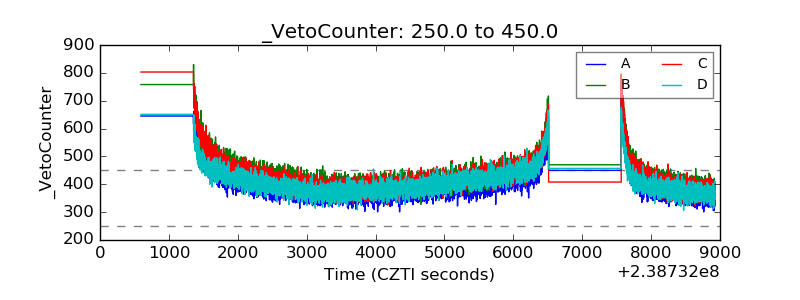 |