| Param | Original file | Final file |
|---|---|---|
| Filename | modeM0/AS1A03_117T06_9000001404_09875cztM0_level2.evt | modeM0/AS1A03_117T06_9000001404_09875cztM0_level2_quad_clean.evt |
| Size (bytes) | 616,656,960 | 103,170,240 |
| Size | 588.1 MB | 98.4 MB |
| Events in quadrant A | 4,121,154 | 635,803 |
| Events in quadrant B | 4,172,675 | 656,573 |
| Events in quadrant C | 4,916,903 | 624,684 |
| Events in quadrant D | 4,883,603 | 611,933 |
| Mode M9 | |||
|---|---|---|---|
| Quadrant | BADHDUFLAG | Total packets | Discarded packets |
| A | 0 | 8 | 0 |
| B | 0 | 8 | 0 |
| C | 0 | 8 | 0 |
| D | 0 | 8 | 0 |
| Mode M0 | |||
|---|---|---|---|
| Quadrant | BADHDUFLAG | Total packets | Discarded packets |
| A | 0 | 18136 | 5 |
| B | 0 | 18114 | 11 |
| C | 0 | 20699 | 8 |
| D | 0 | 20413 | 2 |
| Mode SS | |||
|---|---|---|---|
| Quadrant | BADHDUFLAG | Total packets | Discarded packets |
| A | 0 | 174 | 0 |
| B | 0 | 174 | 0 |
| C | 0 | 174 | 0 |
| D | 0 | 174 | 0 |
| Quadrant | Total seconds | Saturated seconds | Saturation percentage |
|---|---|---|---|
| A | 8575 | 401 | 4.676385% |
| B | 8572 | 399 | 4.654690% |
| C | 8575 | 569 | 6.635569% |
| D | 8576 | 399 | 4.652519% |
Noise dominated data is calculated using 1-second bins in cleaned event files. If a bin has >2000 counts, and if more than 50% of those come from <1% of pixels, then it is considered to be noise-dominated and hence unusable.
| Quadrant | # 1 sec bins | Bins with >0 counts | Bins with >2000 counts | High rate bins dominated by noise | Noise dominated (total time) | Noise dominated (detector-on time) | Marked lightcurve |
|---|---|---|---|---|---|---|---|
| A | 9251 | 8580 | 0 | 0 | 0.00% | 0.00% | 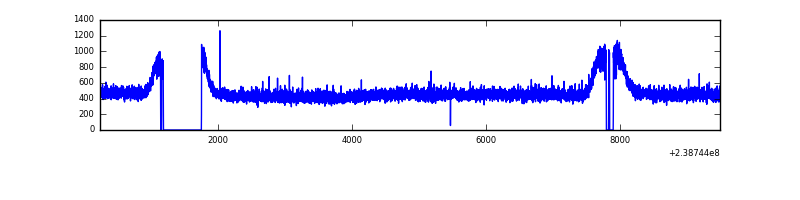 |
| B | 9251 | 8580 | 0 | 0 | 0.00% | 0.00% | 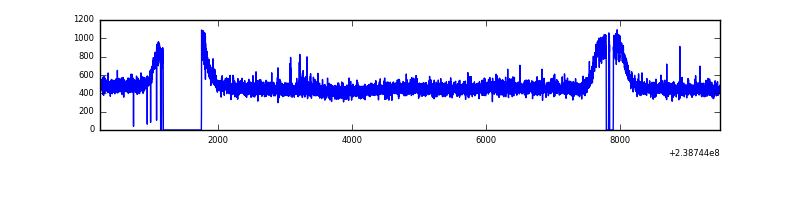 |
| C | 9251 | 8580 | 169 | 169 | 1.83% | 1.97% | 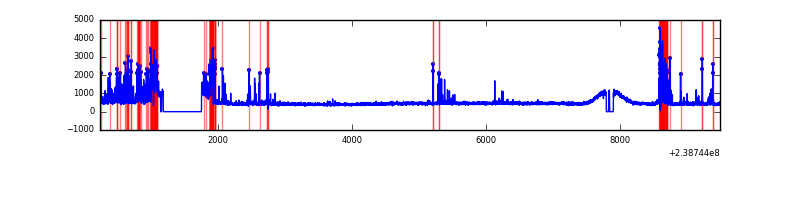 |
| D | 9251 | 8580 | 95 | 95 | 1.03% | 1.11% | 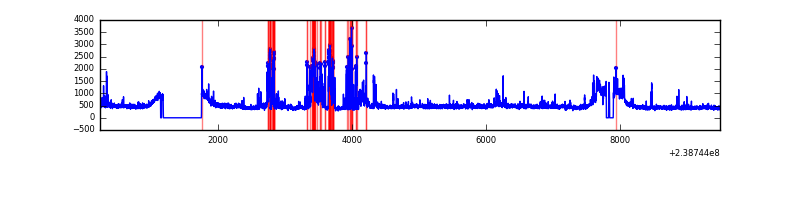 |
Top three noisy pixels from each quadrant. If the there are fewer than three noisy pixels in the level2.evt file, extra rows are filled as -1
| Pixel properties | Quadrant properties | ||||||
|---|---|---|---|---|---|---|---|
| Quadrant | DetID | PixID | Counts | Sigma | Mean | Median | Sigma |
| A | 13 | 14 | 17728 | 76.07 | 1064 | 1039 | 219.4 |
| A | 0 | 226 | 9784 | 39.86 | 1064 | 1039 | 219.4 |
| A | 12 | 194 | 8349 | 33.32 | 1064 | 1039 | 219.4 |
| B | 0 | 85 | 35742 | 165.84 | 1063 | 1036 | 209.3 |
| B | 12 | 111 | 25828 | 118.46 | 1063 | 1036 | 209.3 |
| B | 11 | 111 | 21348 | 97.06 | 1063 | 1036 | 209.3 |
| C | 4 | 254 | 879519 | 3644.76 | 1019 | 1023 | 241.0 |
| C | 14 | 234 | 53129 | 216.18 | 1019 | 1023 | 241.0 |
| C | 13 | 61 | 7689 | 27.66 | 1019 | 1023 | 241.0 |
| D | 10 | 253 | 509693 | 1907.19 | 1021 | 998 | 266.7 |
| D | 1 | 52 | 300936 | 1124.52 | 1021 | 998 | 266.7 |
| D | 10 | 199 | 154152 | 574.2 | 1021 | 998 | 266.7 |
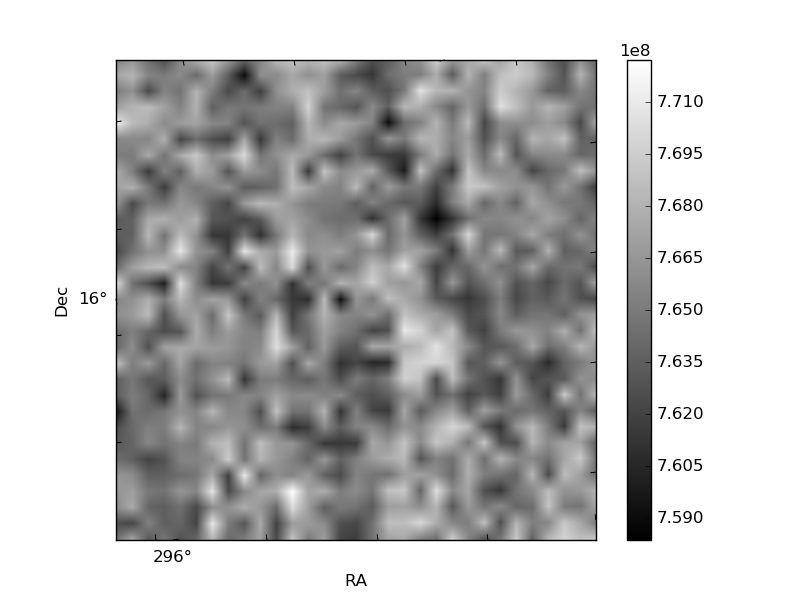
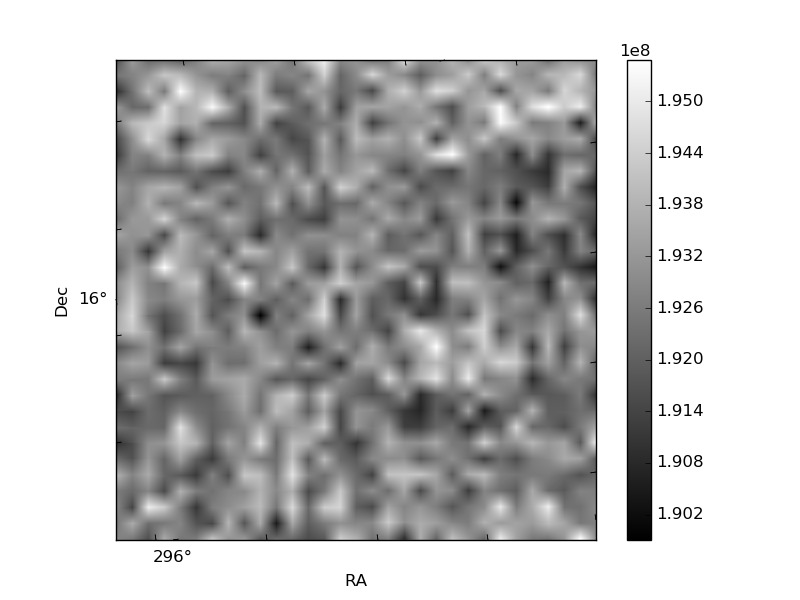
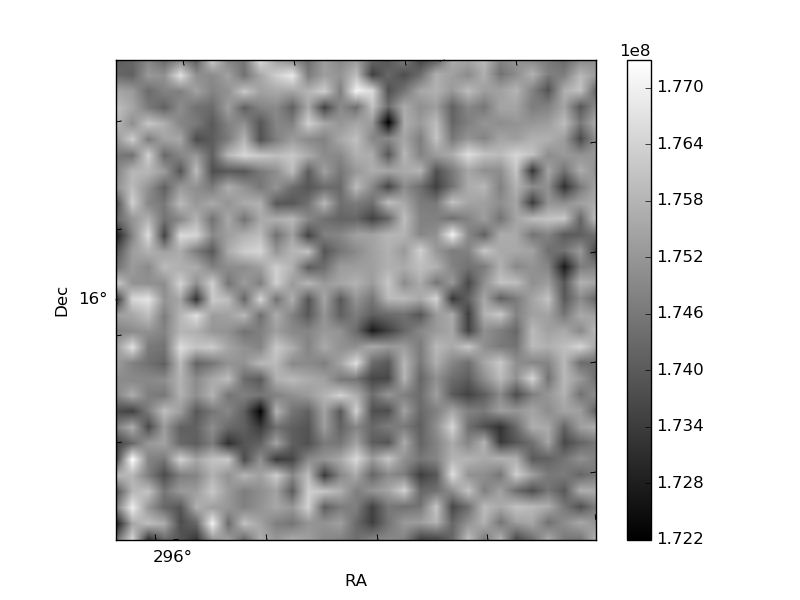
Histogram calculated using DETX and DETY for each event in the final _common_clean file
| Quadrant A | 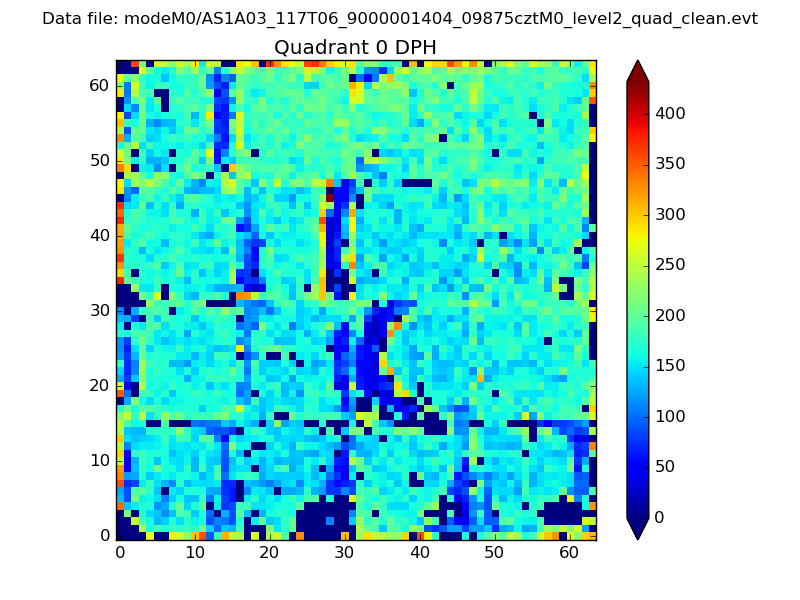 |
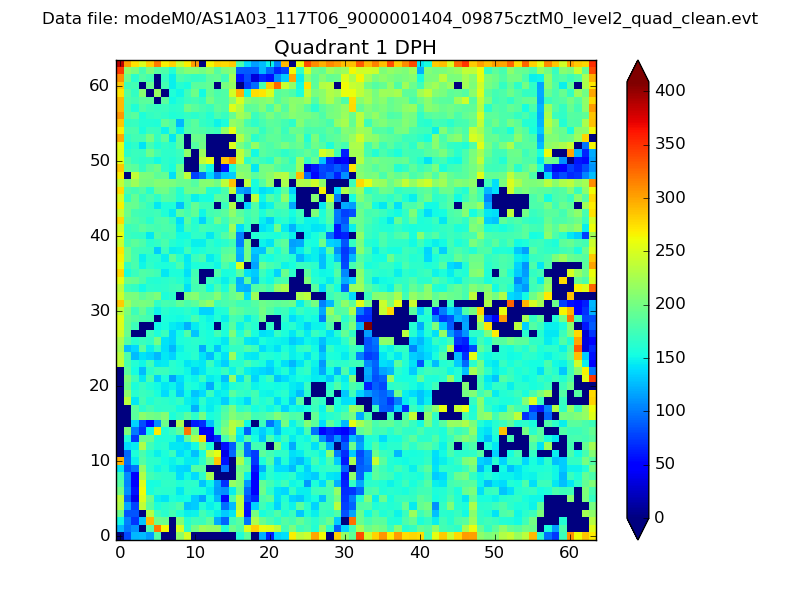 |
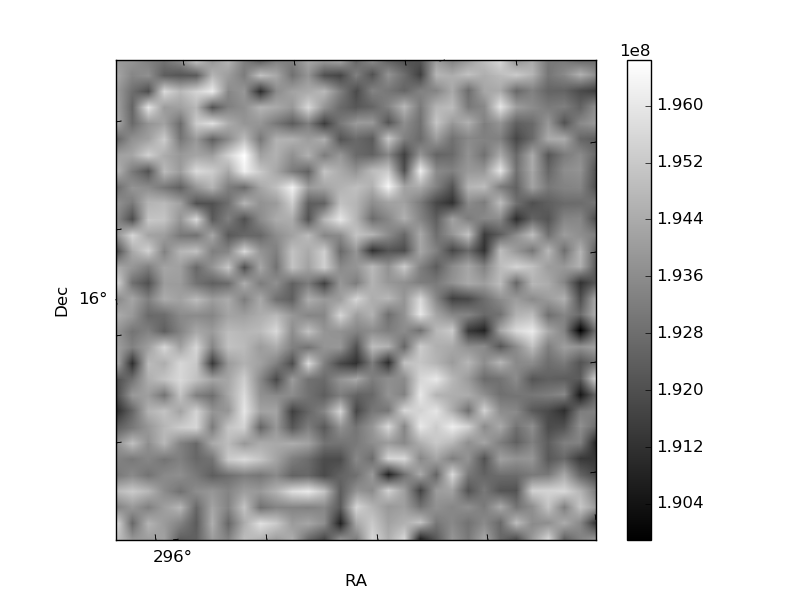
Quadrant B |
|---|---|---|---|
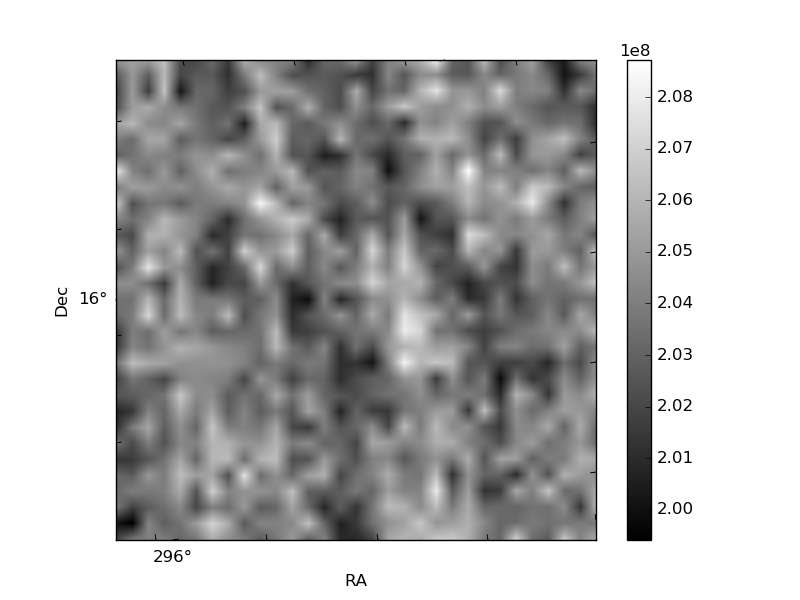
| Quadrant D | 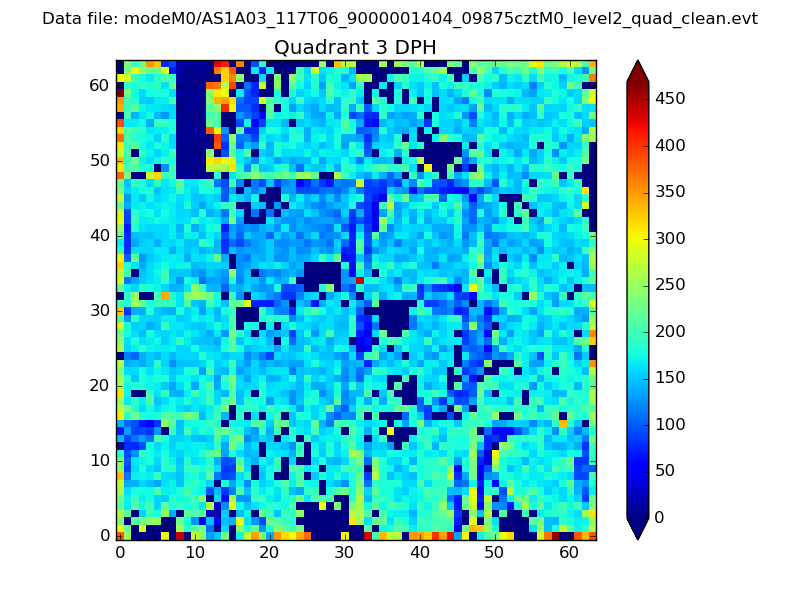 |
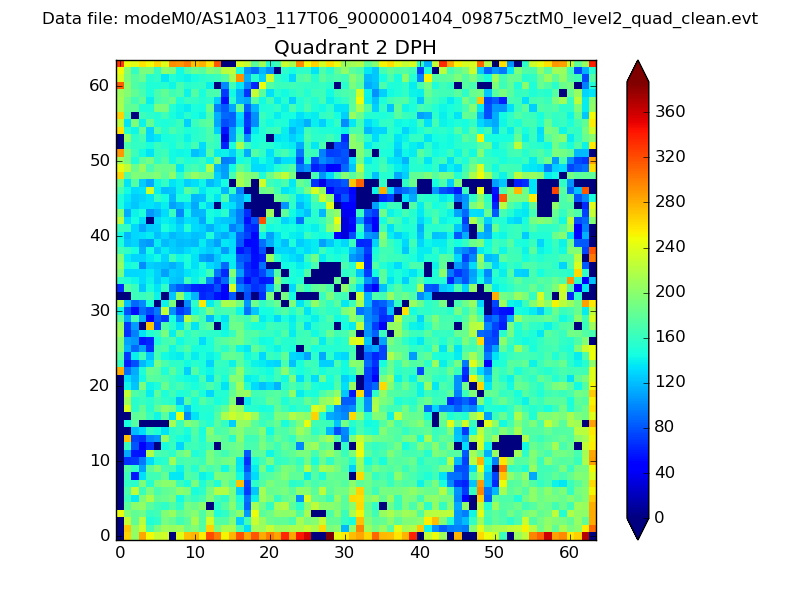 |
Quadrant C |
| Plot type | Count rate plots | Images |
|---|---|---|
| Comparison with Poisson distribution Blue bars denote a histogram of data divided into 1 sec bins. Red curve is a Poisson curve with rate = median count rate of data. |
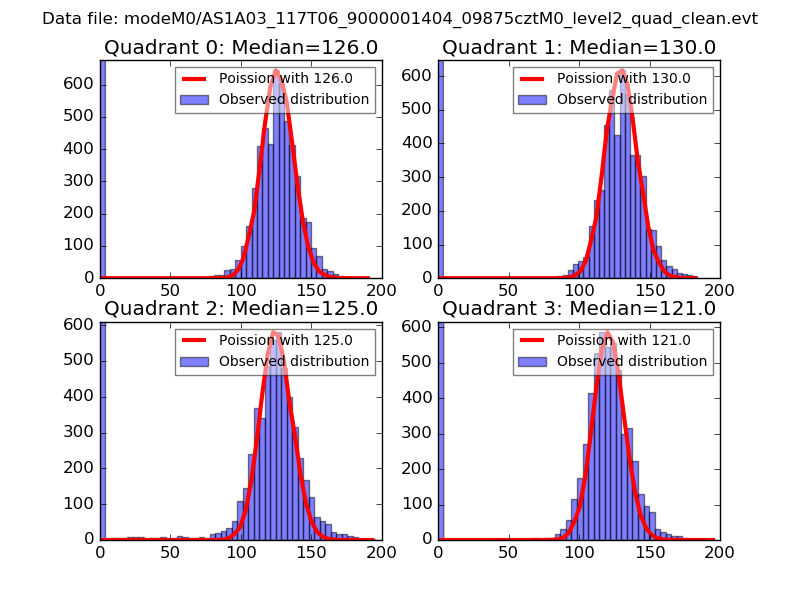 |
 |
| Quadrant-wise count rates Data is divided into 100 sec bins |
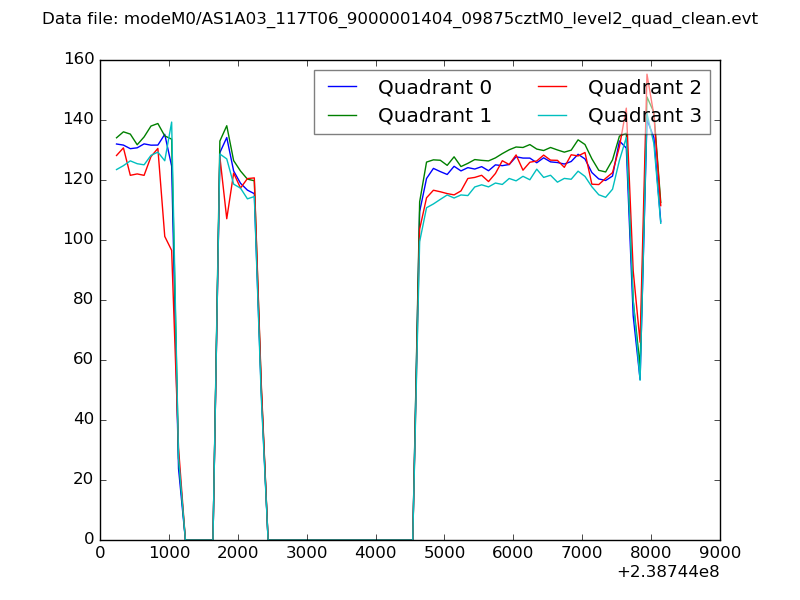 |
|
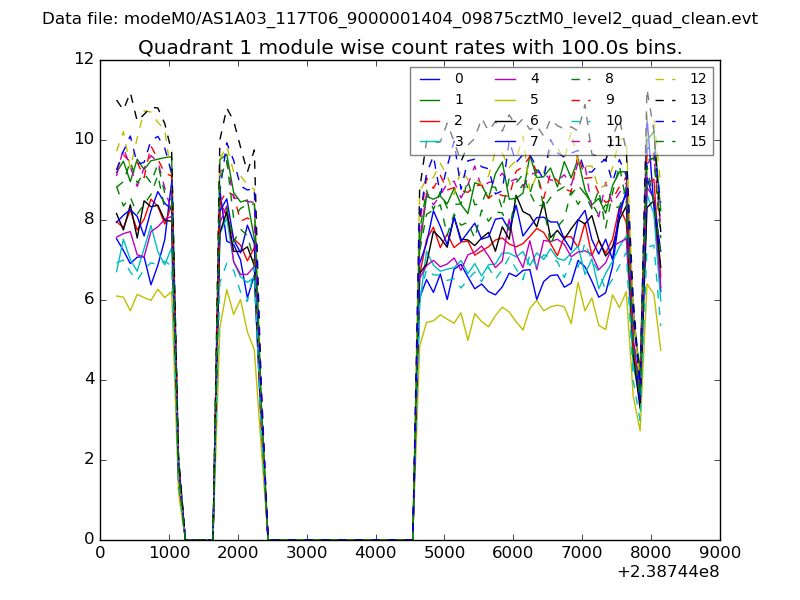
| Module-wise count rates for Quadrant A Data is divided into 100 sec bins |
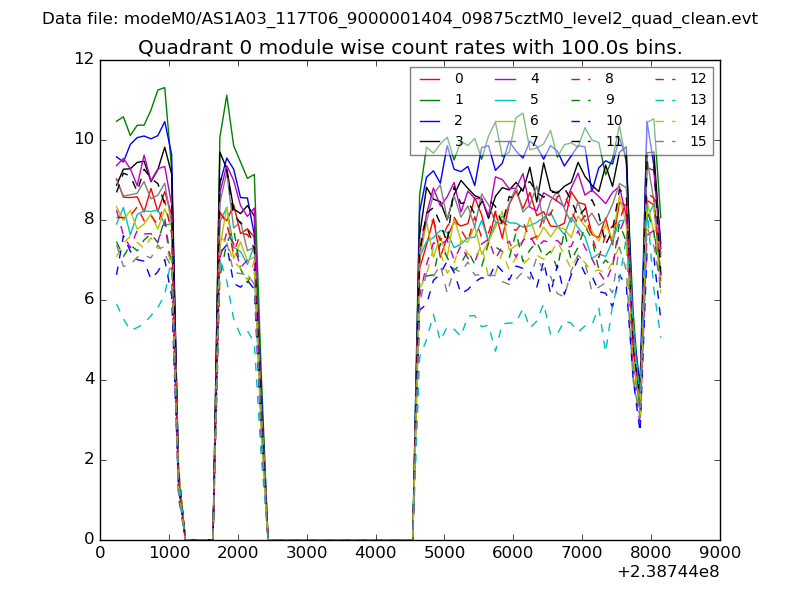 |
 |
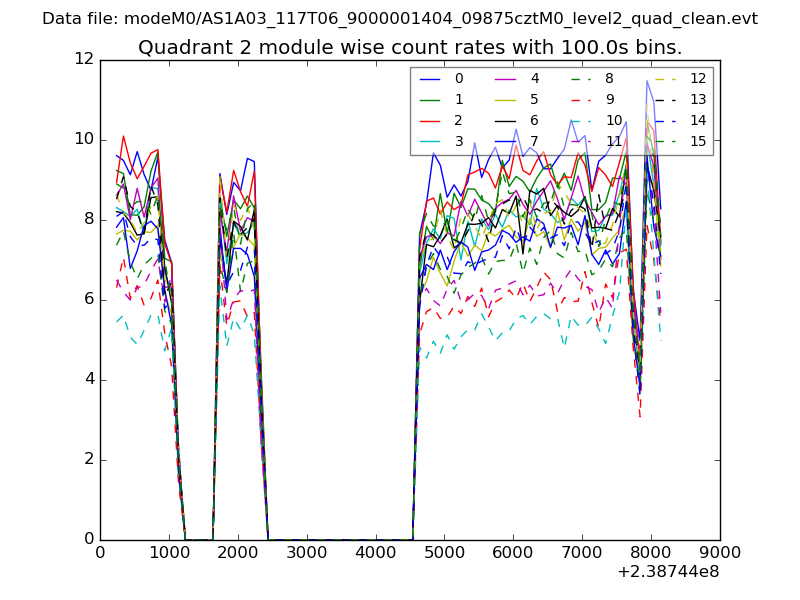
| Module-wise count rates for Quadrant B Data is divided into 100 sec bins |
 |
 |
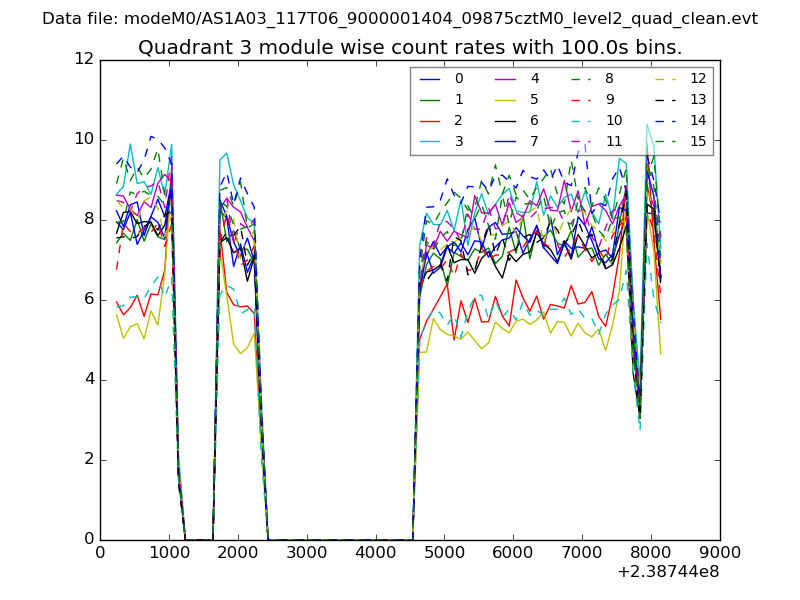
| Module-wise count rates for Quadrant C Data is divided into 100 sec bins |
 |
 |
| Module-wise count rates for Quadrant D Data is divided into 100 sec bins |
 |
 |
| Parameter | Plot |
|---|---|
| CZT HV Monitor | 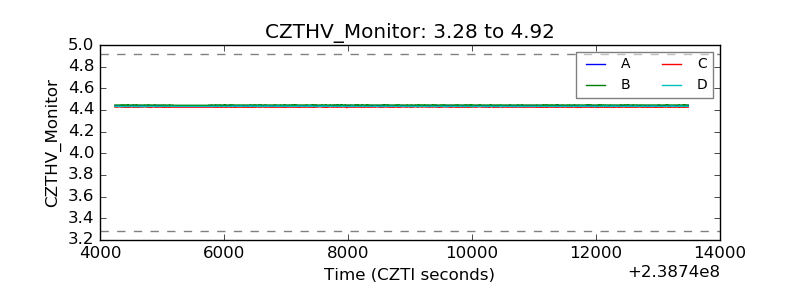 |
| D_VDD | 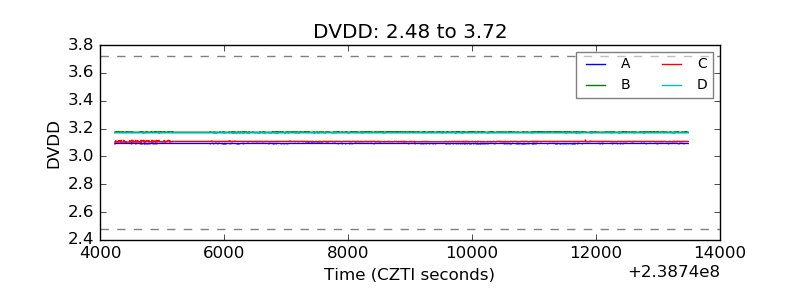 |
| Temperature 1 | 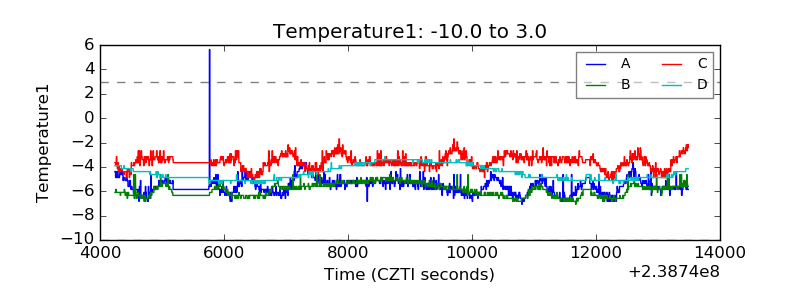 |
| Veto HV Monitor | 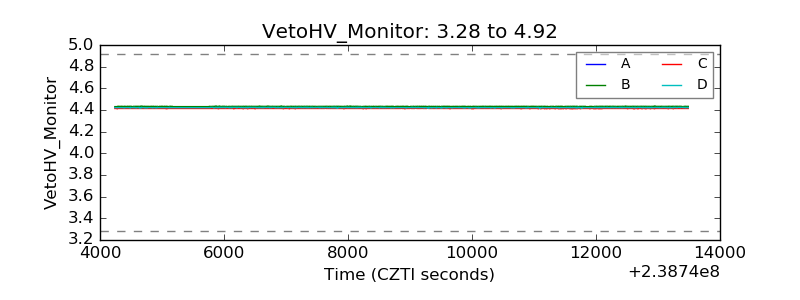 |
| Veto LLD | 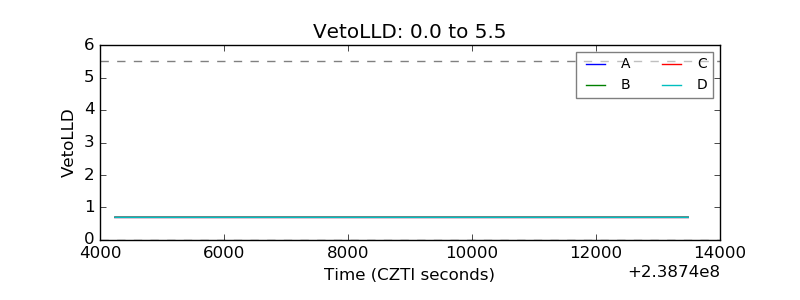 |
| Alpha Counter | 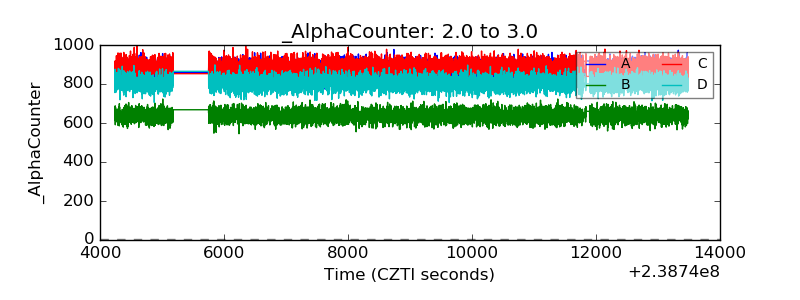 |
| _CPM_Rate | 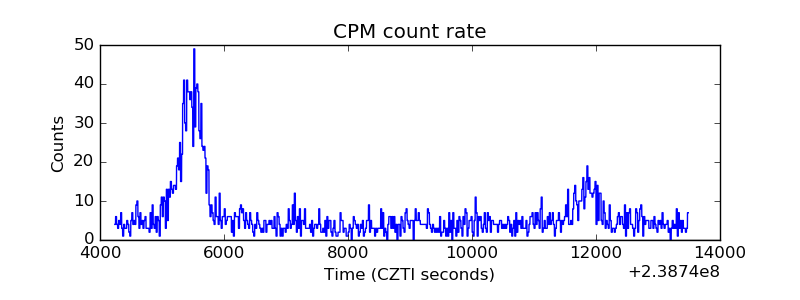 |
| CZT Counter | 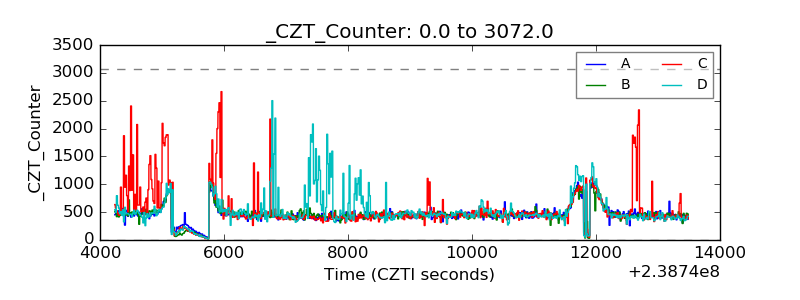 |
| +2.5 Volts monitor | 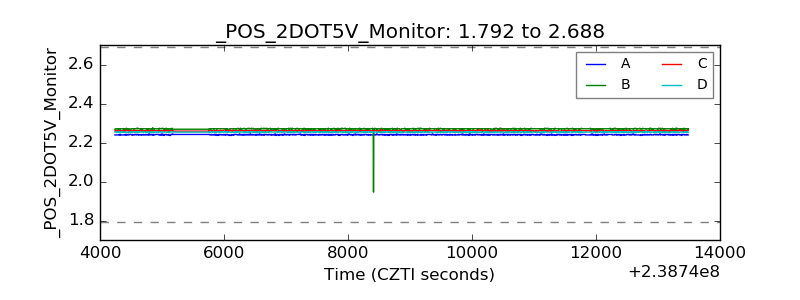 |
| +5 Volts monitor | 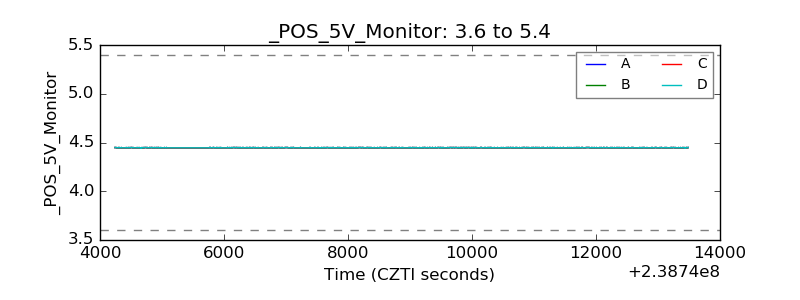 |
| _ROLL_ROT | 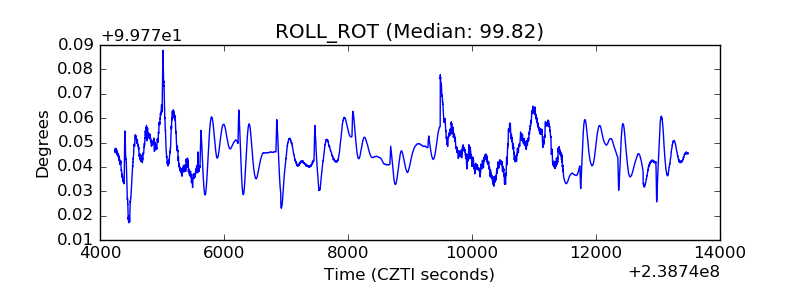 |
| _Roll_DEC | 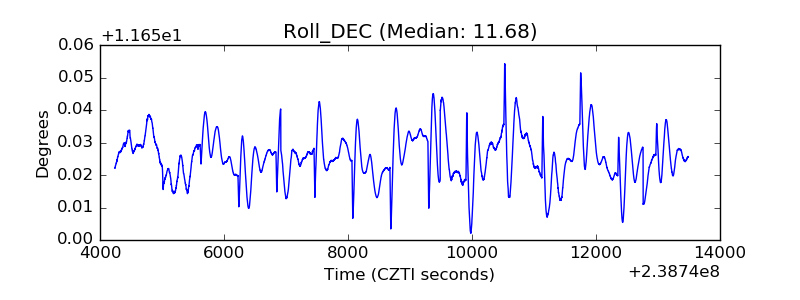 |
| _Roll_RA | 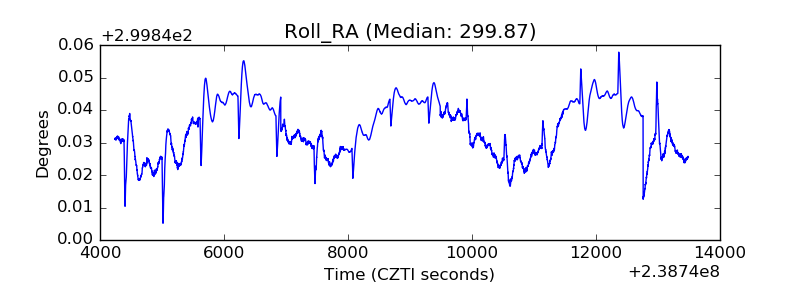 |
| Veto Counter | 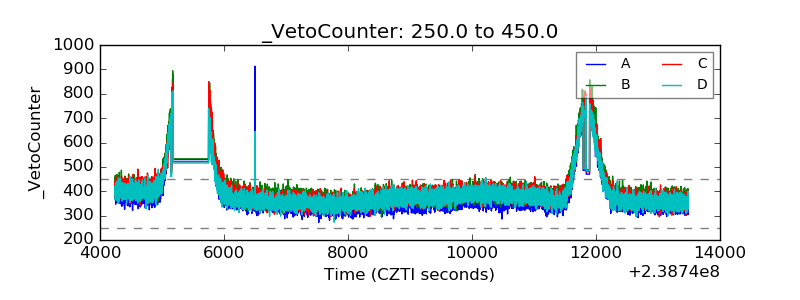 |