| Param | Original file | Final file |
|---|---|---|
| Filename | modeM0/AS1A03_117T06_9000001404_09876cztM0_level2.evt | modeM0/AS1A03_117T06_9000001404_09876cztM0_level2_quad_clean.evt |
| Size (bytes) | 546,180,480 | 81,541,440 |
| Size | 520.9 MB | 77.8 MB |
| Events in quadrant A | 3,984,717 | 482,586 |
| Events in quadrant B | 3,836,965 | 496,870 |
| Events in quadrant C | 4,333,108 | 478,649 |
| Events in quadrant D | 3,850,663 | 462,756 |
| Mode M9 | |||
|---|---|---|---|
| Quadrant | BADHDUFLAG | Total packets | Discarded packets |
| A | 0 | 3 | 0 |
| B | 0 | 3 | 0 |
| C | 0 | 3 | 0 |
| D | 0 | 3 | 0 |
| Mode M0 | |||
|---|---|---|---|
| Quadrant | BADHDUFLAG | Total packets | Discarded packets |
| A | 0 | 17287 | 3 |
| B | 0 | 16687 | 2 |
| C | 0 | 18488 | 11 |
| D | 0 | 17254 | 2 |
| Mode SS | |||
|---|---|---|---|
| Quadrant | BADHDUFLAG | Total packets | Discarded packets |
| A | 0 | 160 | 0 |
| B | 0 | 160 | 0 |
| C | 0 | 160 | 0 |
| D | 0 | 160 | 0 |
| Quadrant | Total seconds | Saturated seconds | Saturation percentage |
|---|---|---|---|
| A | 7893 | 436 | 5.523882% |
| B | 7893 | 401 | 5.080451% |
| C | 7891 | 465 | 5.892789% |
| D | 7893 | 330 | 4.180920% |
Noise dominated data is calculated using 1-second bins in cleaned event files. If a bin has >2000 counts, and if more than 50% of those come from <1% of pixels, then it is considered to be noise-dominated and hence unusable.
| Quadrant | # 1 sec bins | Bins with >0 counts | Bins with >2000 counts | High rate bins dominated by noise | Noise dominated (total time) | Noise dominated (detector-on time) | Marked lightcurve |
|---|---|---|---|---|---|---|---|
| A | 7998 | 7896 | 46 | 46 | 0.58% | 0.58% | 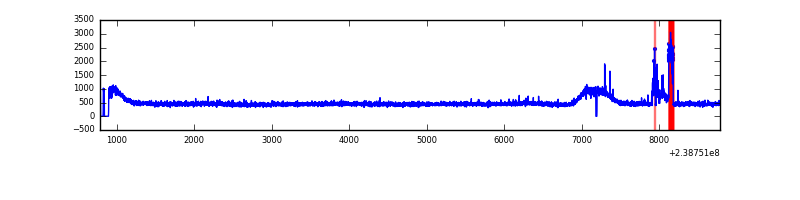 |
| B | 7998 | 7896 | 0 | 0 | 0.00% | 0.00% | 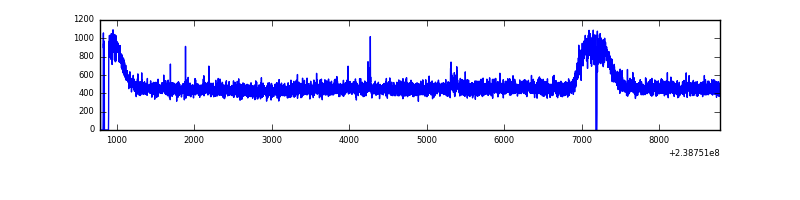 |
| C | 7998 | 7896 | 98 | 98 | 1.23% | 1.24% | 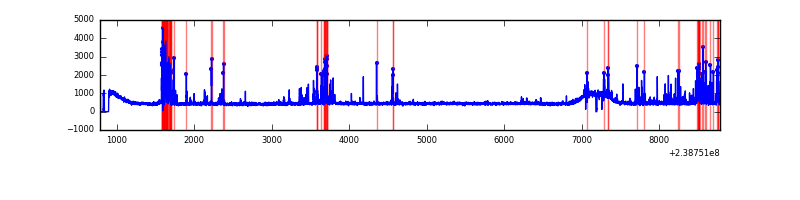 |
| D | 7998 | 7896 | 8 | 8 | 0.10% | 0.10% | 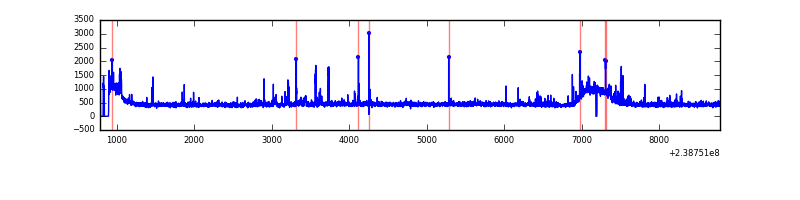 |
Top three noisy pixels from each quadrant. If the there are fewer than three noisy pixels in the level2.evt file, extra rows are filled as -1
| Pixel properties | Quadrant properties | ||||||
|---|---|---|---|---|---|---|---|
| Quadrant | DetID | PixID | Counts | Sigma | Mean | Median | Sigma |
| A | 15 | 174 | 187904 | 933.78 | 972 | 948 | 200.2 |
| A | 13 | 14 | 34164 | 165.9 | 972 | 948 | 200.2 |
| A | 15 | 239 | 16974 | 80.04 | 972 | 948 | 200.2 |
| B | 0 | 85 | 42185 | 213.6 | 973 | 946 | 193.1 |
| B | 12 | 111 | 23955 | 119.18 | 973 | 946 | 193.1 |
| B | 11 | 111 | 19587 | 96.55 | 973 | 946 | 193.1 |
| C | 4 | 254 | 639559 | 2862.54 | 939 | 943 | 223.1 |
| C | 14 | 234 | 21968 | 94.24 | 939 | 943 | 223.1 |
| C | 13 | 61 | 7035 | 27.3 | 939 | 943 | 223.1 |
| D | 1 | 52 | 141492 | 575.63 | 938 | 916 | 244.2 |
| D | 10 | 199 | 105512 | 428.3 | 938 | 916 | 244.2 |
| D | 2 | 234 | 29666 | 117.73 | 938 | 916 | 244.2 |
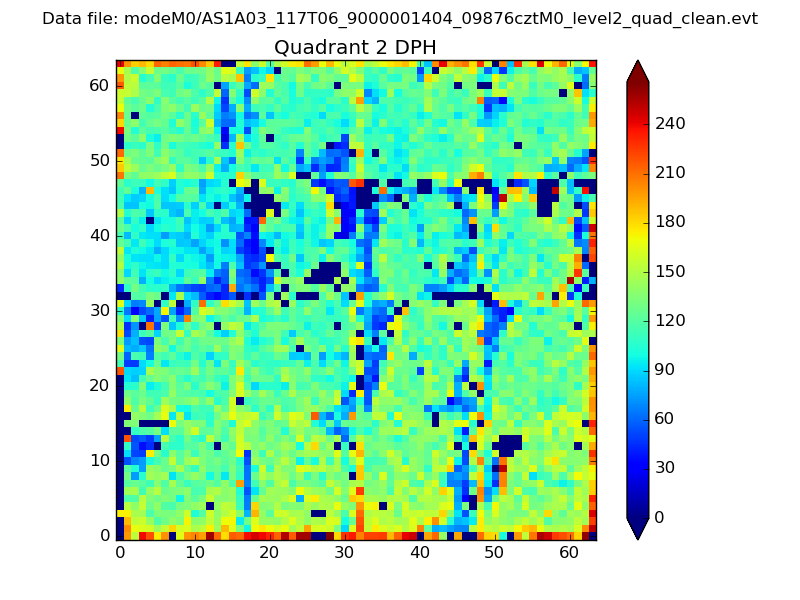
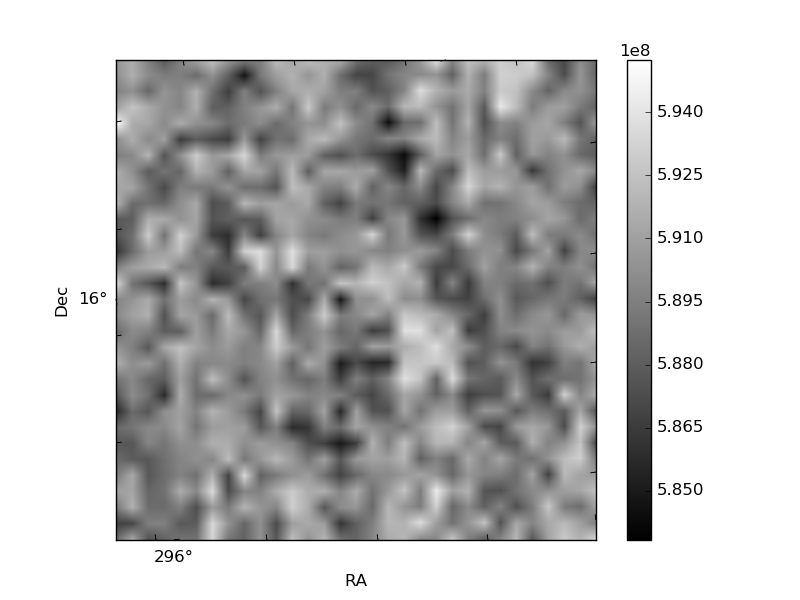
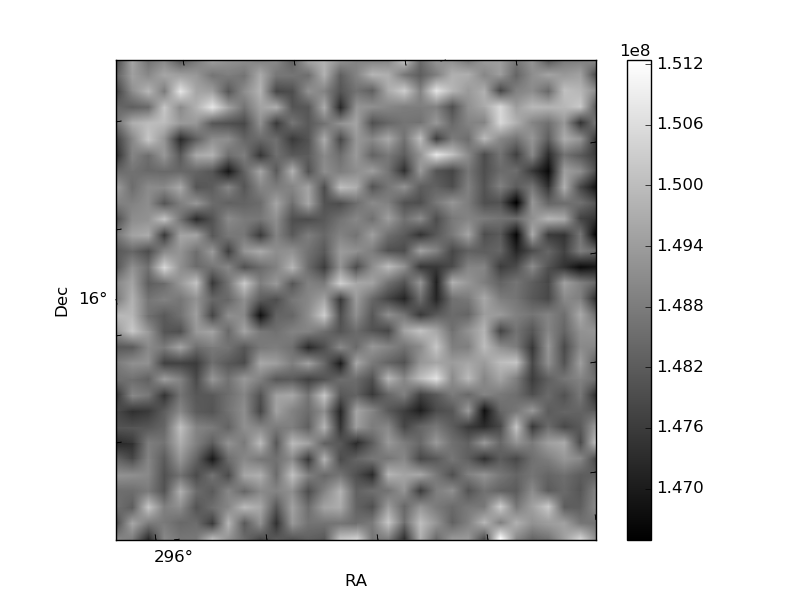
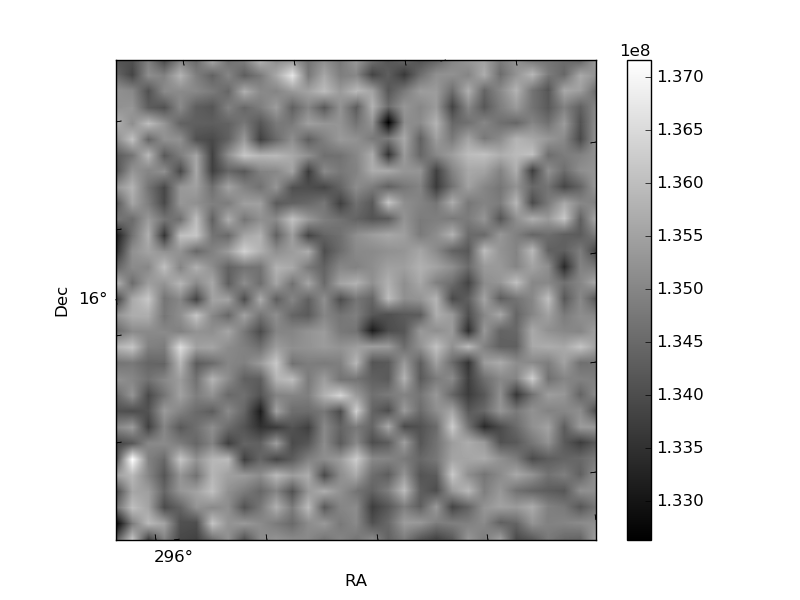
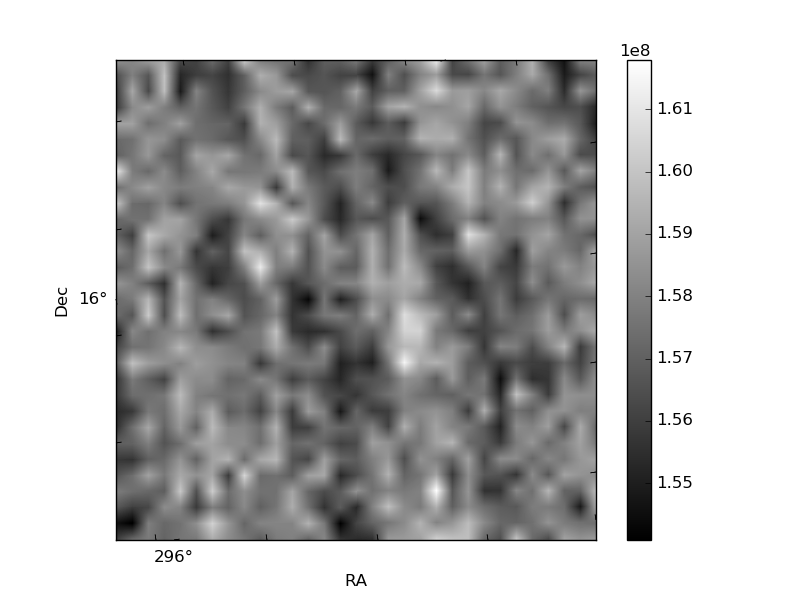
Histogram calculated using DETX and DETY for each event in the final _common_clean file
| Quadrant A | 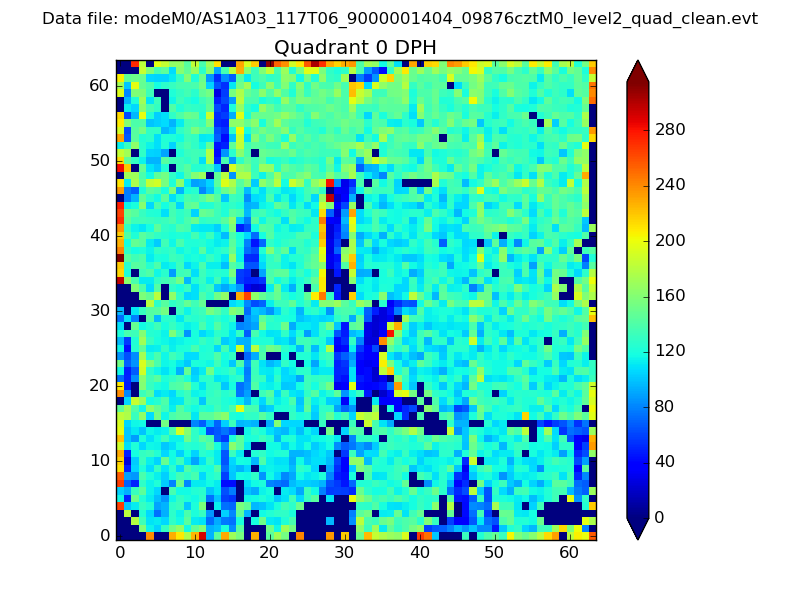 |
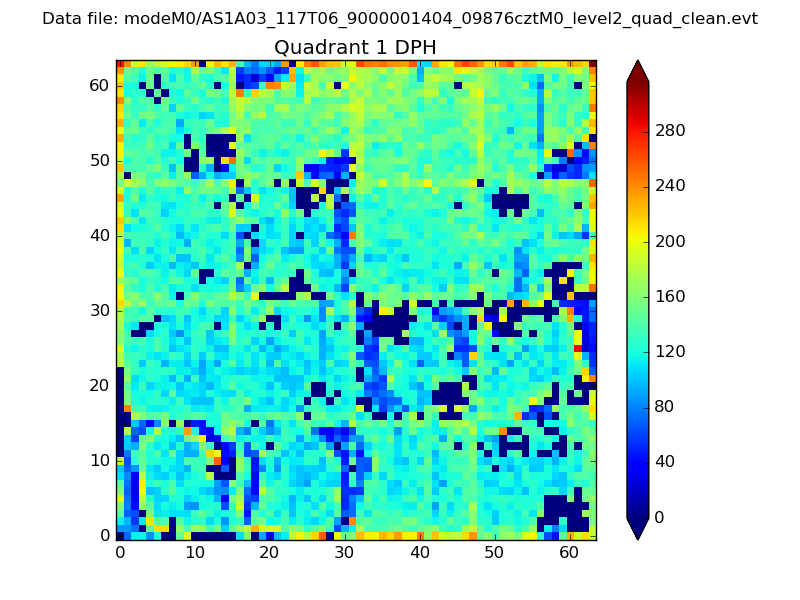 |
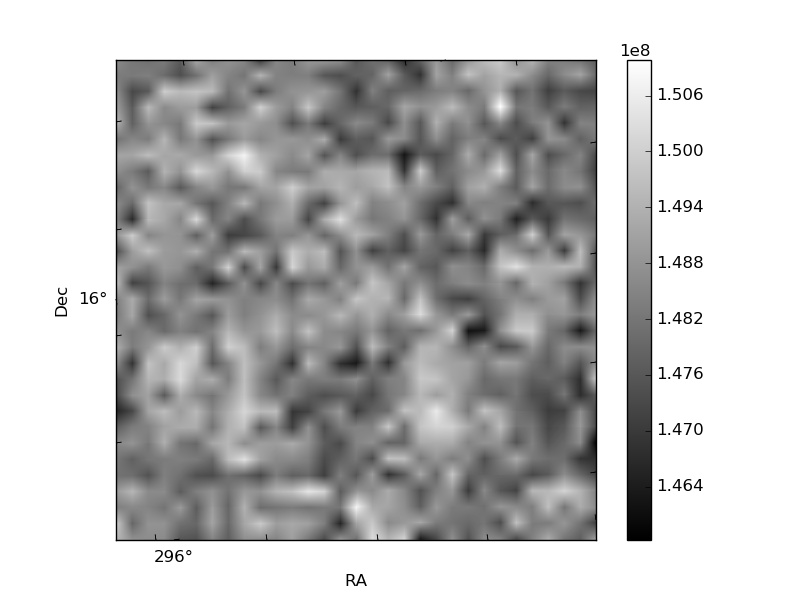
Quadrant B |
|---|---|---|---|
| Quadrant D | 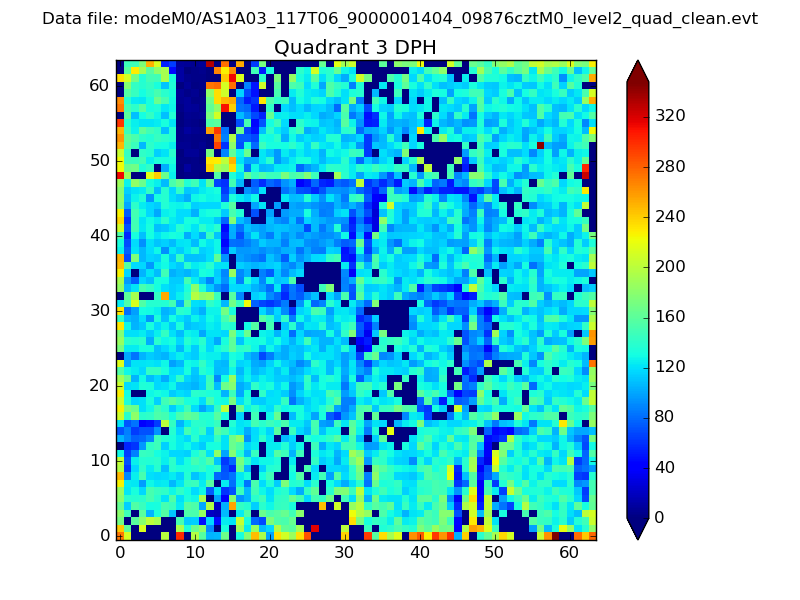 |
 |
Quadrant C |
| Plot type | Count rate plots | Images |
|---|---|---|
| Comparison with Poisson distribution Blue bars denote a histogram of data divided into 1 sec bins. Red curve is a Poisson curve with rate = median count rate of data. |
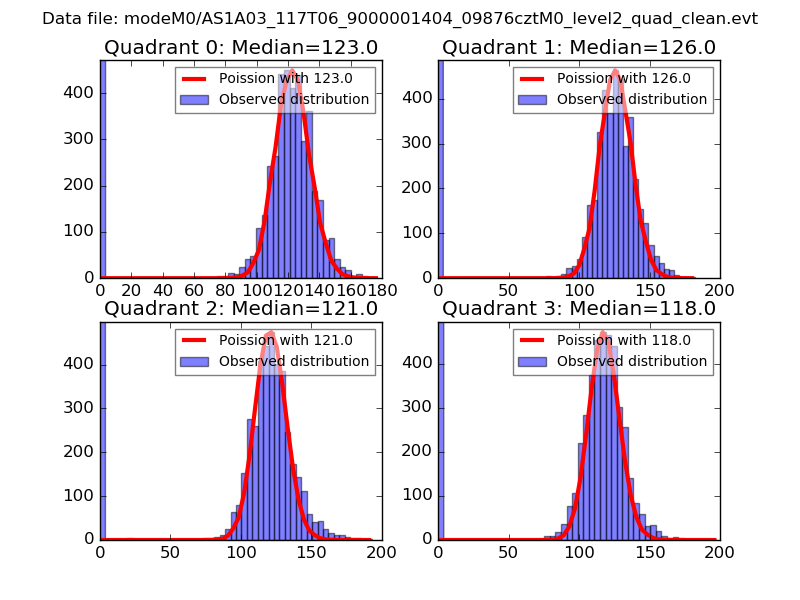 |
 |
| Quadrant-wise count rates Data is divided into 100 sec bins |
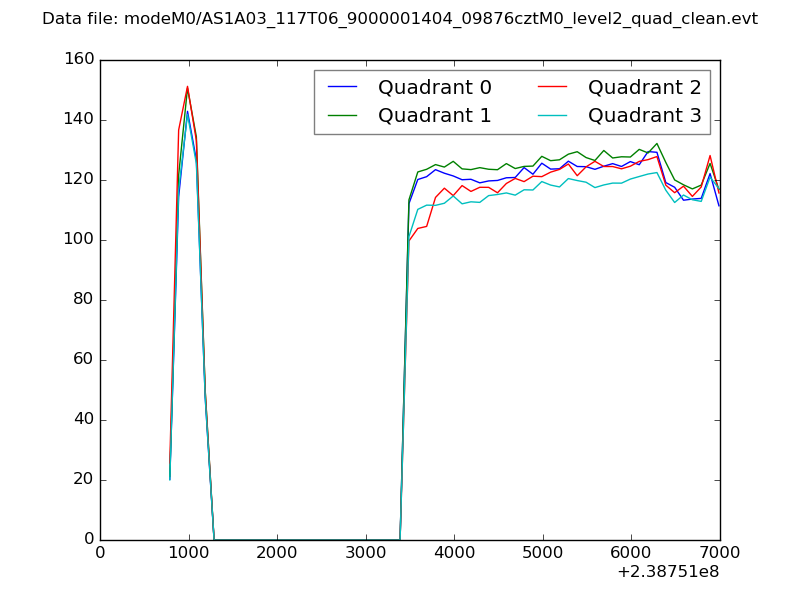 |
|
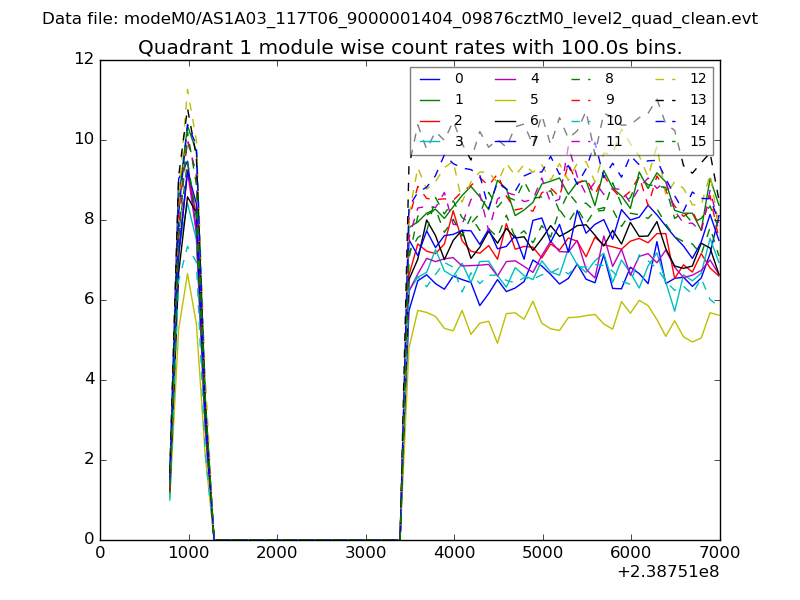
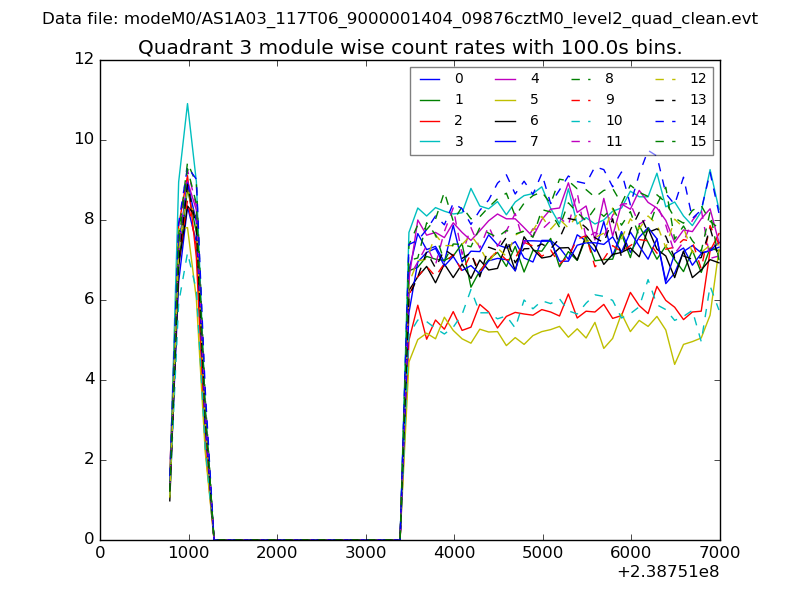
| Module-wise count rates for Quadrant A Data is divided into 100 sec bins |
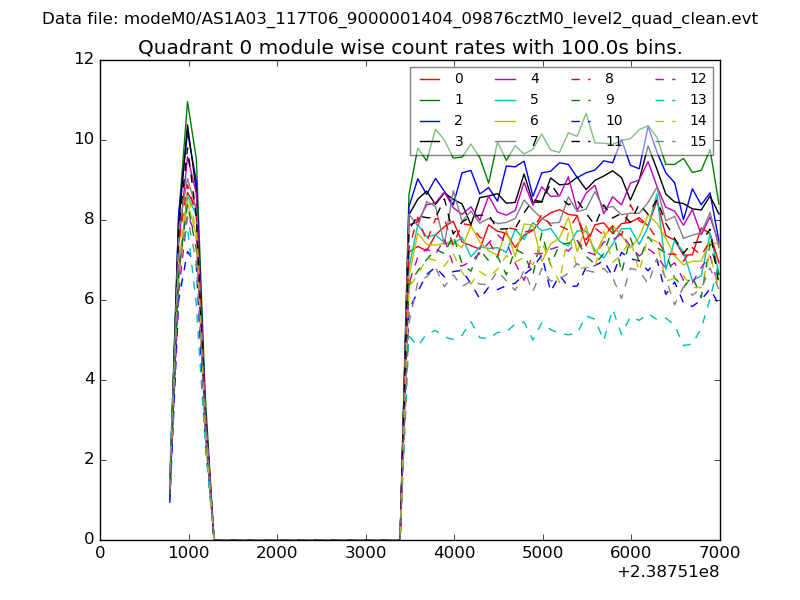 |
 |
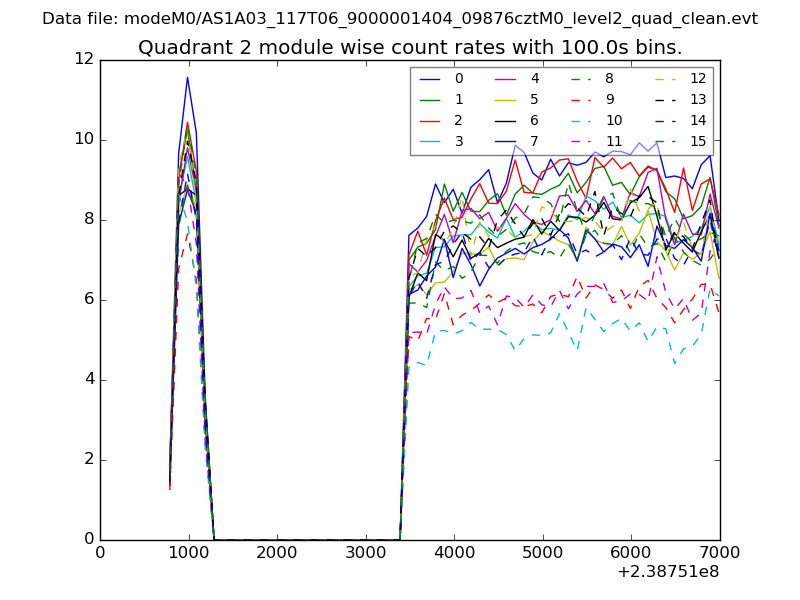
| Module-wise count rates for Quadrant B Data is divided into 100 sec bins |
 |
 |
| Module-wise count rates for Quadrant C Data is divided into 100 sec bins |
 |
 |
| Module-wise count rates for Quadrant D Data is divided into 100 sec bins |
 |
 |
| Parameter | Plot |
|---|---|
| CZT HV Monitor | 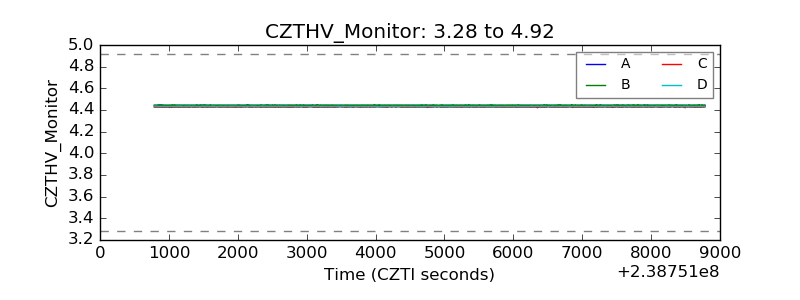 |
| D_VDD | 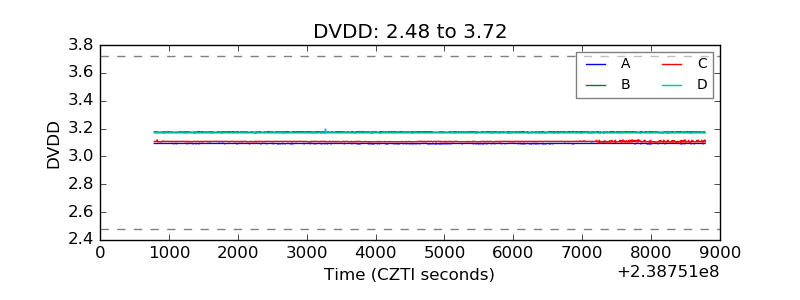 |
| Temperature 1 | 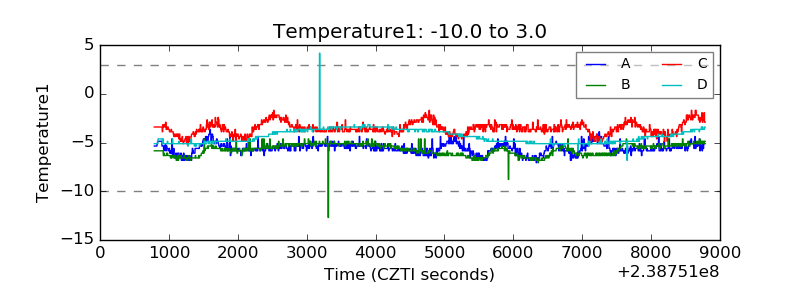 |
| Veto HV Monitor | 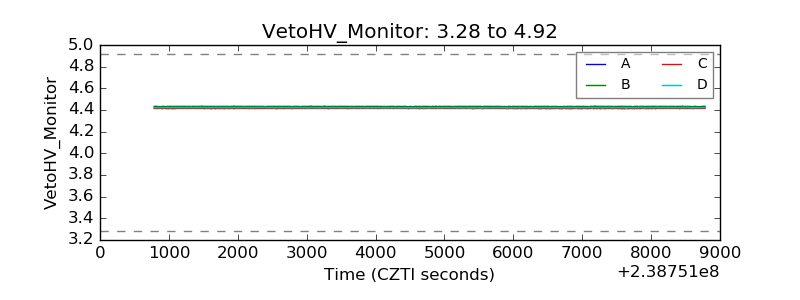 |
| Veto LLD | 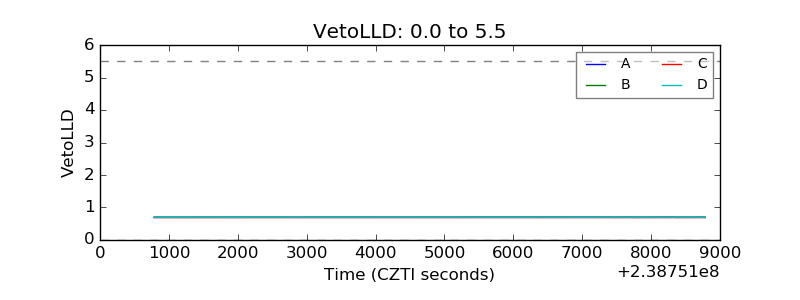 |
| Alpha Counter | 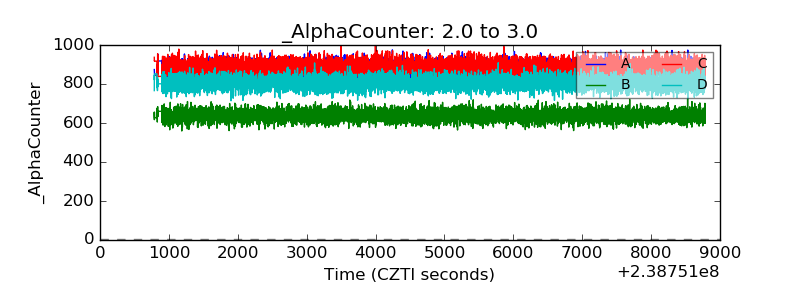 |
| _CPM_Rate | 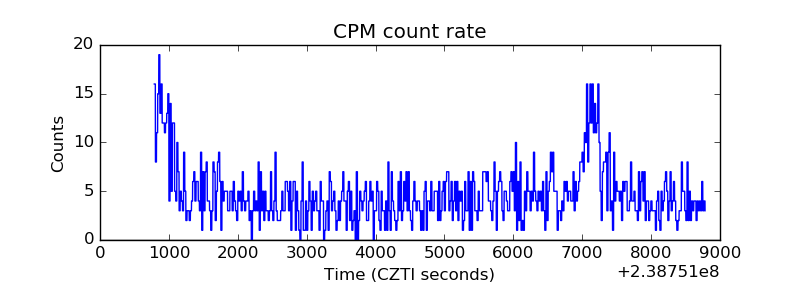 |
| CZT Counter | 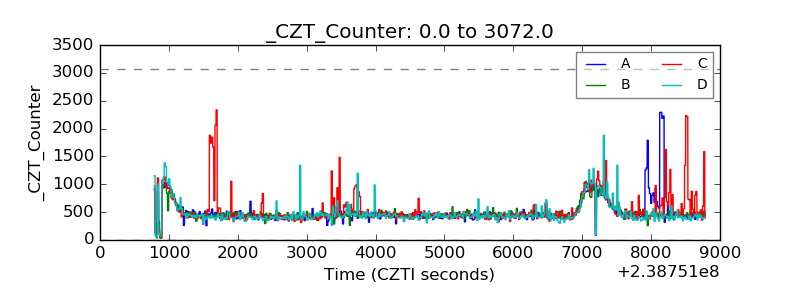 |
| +2.5 Volts monitor |  |
| +5 Volts monitor |  |
| _ROLL_ROT |  |
| _Roll_DEC |  |
| _Roll_RA | 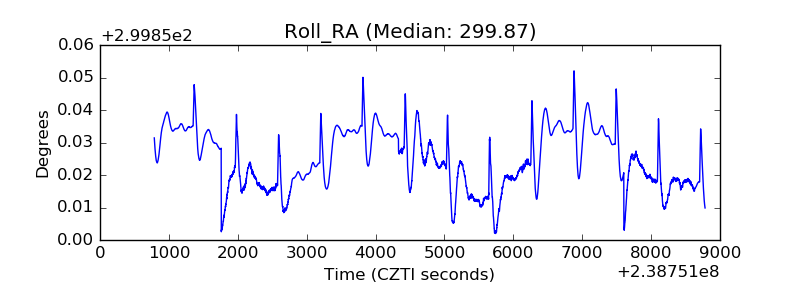 |
| Veto Counter | 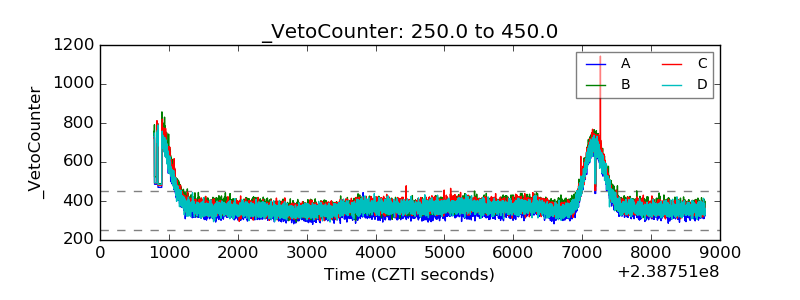 |