| Param | Original file | Final file |
|---|---|---|
| Filename | modeM0/AS1A03_117T06_9000001404_09877cztM0_level2.evt | modeM0/AS1A03_117T06_9000001404_09877cztM0_level2_quad_clean.evt |
| Size (bytes) | 602,418,240 | 85,392,000 |
| Size | 574.5 MB | 81.4 MB |
| Events in quadrant A | 4,353,798 | 505,077 |
| Events in quadrant B | 4,112,659 | 519,198 |
| Events in quadrant C | 4,737,795 | 497,484 |
| Events in quadrant D | 4,467,771 | 478,619 |
| Mode M9 | |||
|---|---|---|---|
| Quadrant | BADHDUFLAG | Total packets | Discarded packets |
| A | 0 | 4 | 0 |
| B | 0 | 4 | 0 |
| C | 0 | 4 | 0 |
| D | 0 | 4 | 0 |
| Mode M0 | |||
|---|---|---|---|
| Quadrant | BADHDUFLAG | Total packets | Discarded packets |
| A | 0 | 18695 | 41 |
| B | 0 | 17844 | 31 |
| C | 0 | 19974 | 78 |
| D | 0 | 19389 | 33 |
| Mode SS | |||
|---|---|---|---|
| Quadrant | BADHDUFLAG | Total packets | Discarded packets |
| A | 0 | 170 | 0 |
| B | 0 | 170 | 0 |
| C | 0 | 170 | 0 |
| D | 0 | 170 | 0 |
| Quadrant | Total seconds | Saturated seconds | Saturation percentage |
|---|---|---|---|
| A | 8435 | 442 | 5.240071% |
| B | 8435 | 407 | 4.825133% |
| C | 8425 | 511 | 6.065282% |
| D | 8435 | 454 | 5.382336% |
Noise dominated data is calculated using 1-second bins in cleaned event files. If a bin has >2000 counts, and if more than 50% of those come from <1% of pixels, then it is considered to be noise-dominated and hence unusable.
| Quadrant | # 1 sec bins | Bins with >0 counts | Bins with >2000 counts | High rate bins dominated by noise | Noise dominated (total time) | Noise dominated (detector-on time) | Marked lightcurve |
|---|---|---|---|---|---|---|---|
| A | 8765 | 8450 | 47 | 47 | 0.54% | 0.56% | 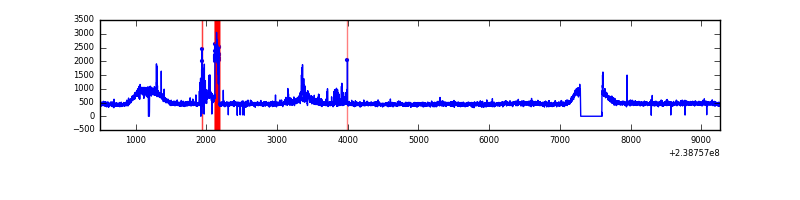 |
| B | 8765 | 8450 | 1 | 1 | 0.01% | 0.01% | 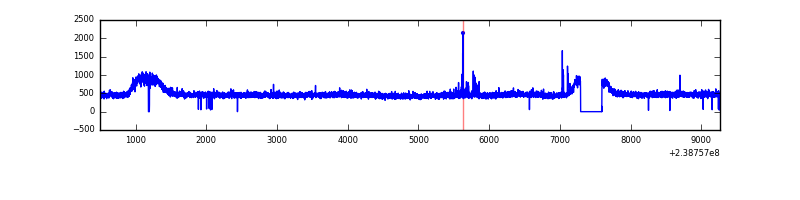 |
| C | 8763 | 8449 | 90 | 90 | 1.03% | 1.07% | 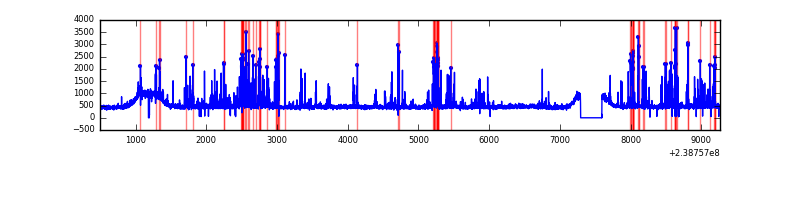 |
| D | 8765 | 8450 | 138 | 138 | 1.57% | 1.63% | 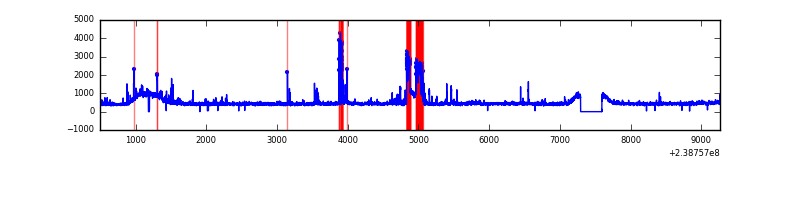 |
Top three noisy pixels from each quadrant. If the there are fewer than three noisy pixels in the level2.evt file, extra rows are filled as -1
| Pixel properties | Quadrant properties | ||||||
|---|---|---|---|---|---|---|---|
| Quadrant | DetID | PixID | Counts | Sigma | Mean | Median | Sigma |
| A | 15 | 174 | 185453 | 865.95 | 1033 | 1007 | 213.0 |
| A | 15 | 239 | 152160 | 709.65 | 1033 | 1007 | 213.0 |
| A | 13 | 14 | 26695 | 120.6 | 1033 | 1007 | 213.0 |
| B | 4 | 81 | 38168 | 182.11 | 1034 | 1007 | 204.1 |
| B | 0 | 85 | 31040 | 147.18 | 1034 | 1007 | 204.1 |
| B | 12 | 111 | 25113 | 118.13 | 1034 | 1007 | 204.1 |
| C | 4 | 254 | 813139 | 3441.02 | 996 | 998 | 236.0 |
| C | 8 | 128 | 14693 | 58.03 | 996 | 998 | 236.0 |
| C | 14 | 67 | 9024 | 34.01 | 996 | 998 | 236.0 |
| D | 1 | 52 | 629538 | 2415.53 | 993 | 969 | 260.2 |
| D | 2 | 234 | 31080 | 115.71 | 993 | 969 | 260.2 |
| D | 2 | 14 | 18220 | 66.29 | 993 | 969 | 260.2 |
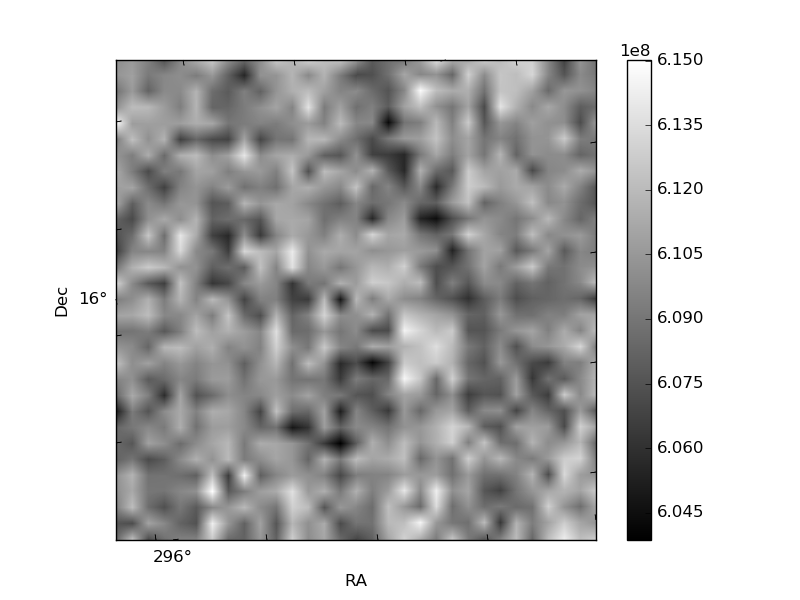
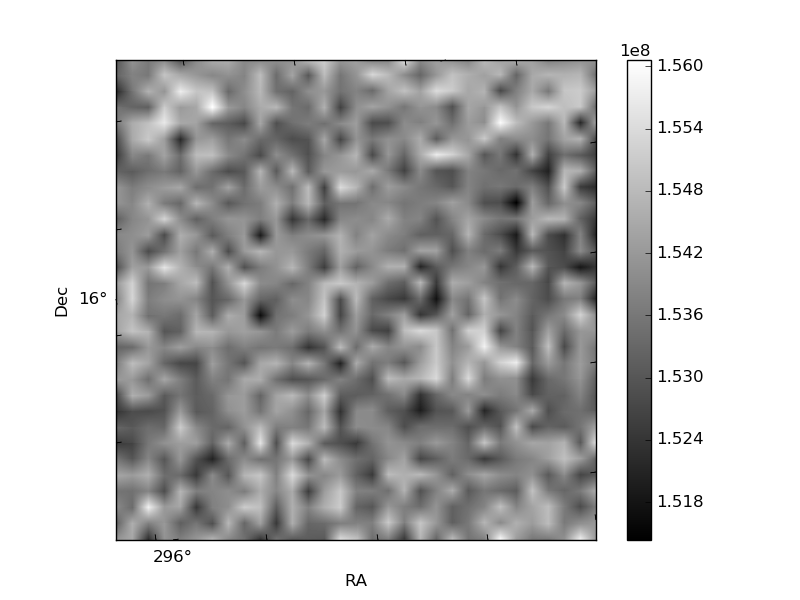
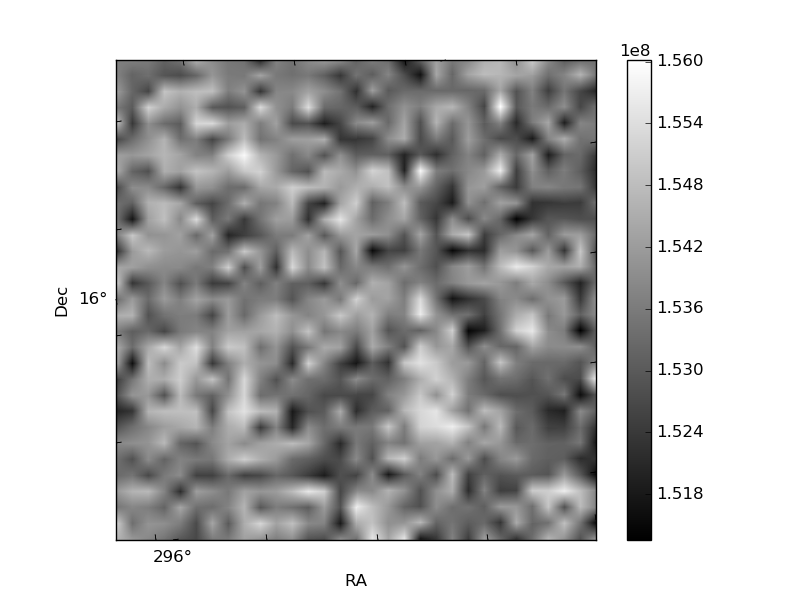
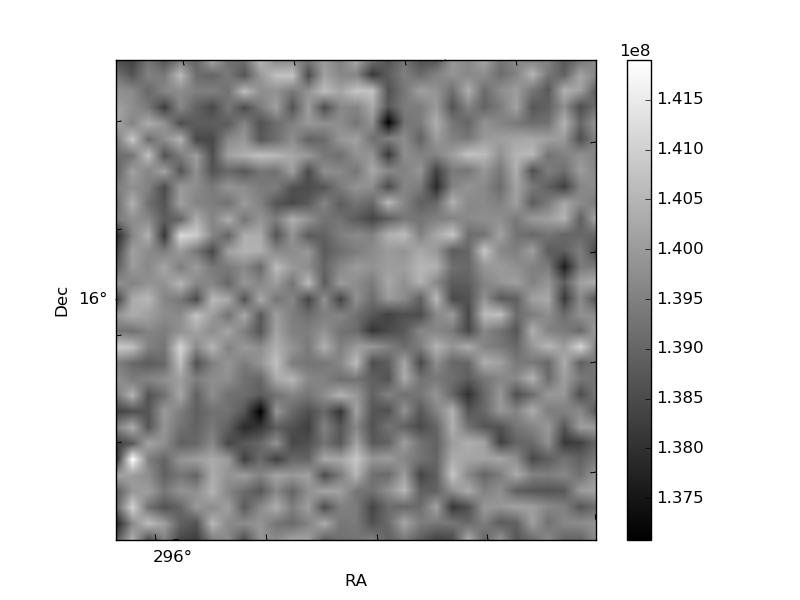
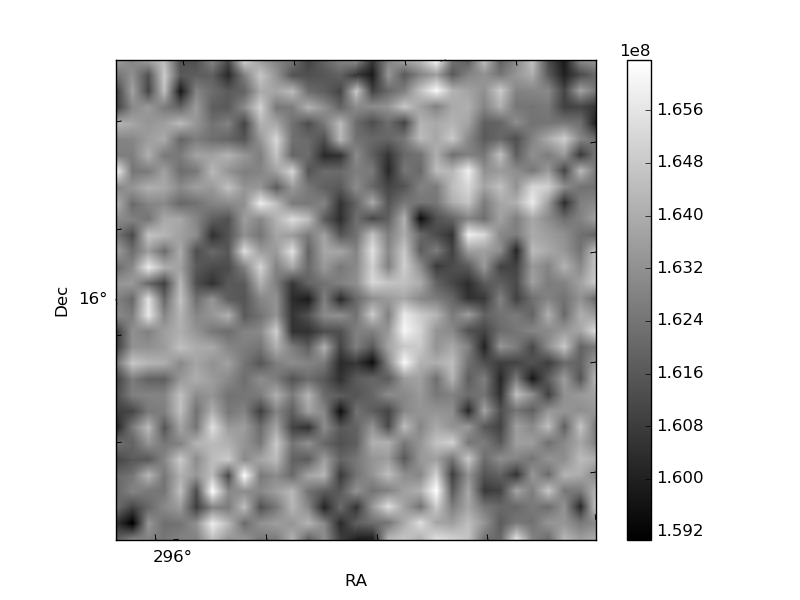
Histogram calculated using DETX and DETY for each event in the final _common_clean file
| Quadrant A | 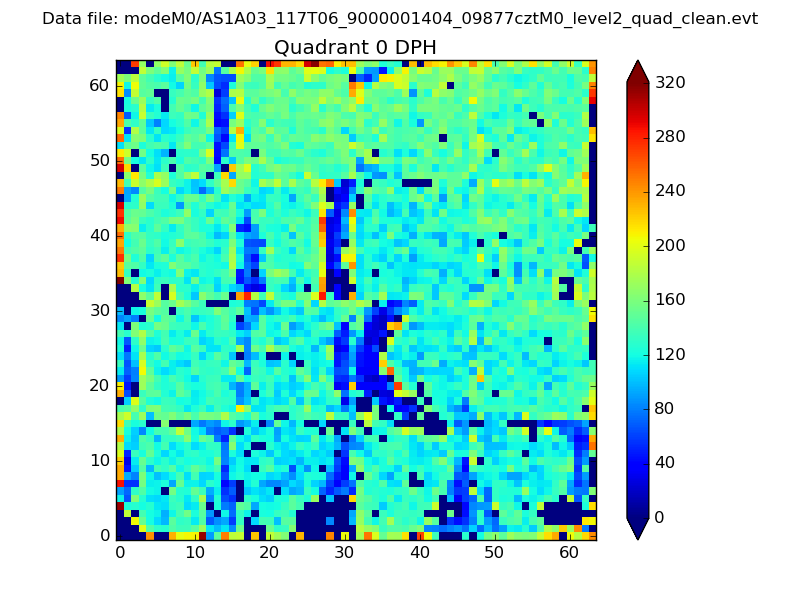 |
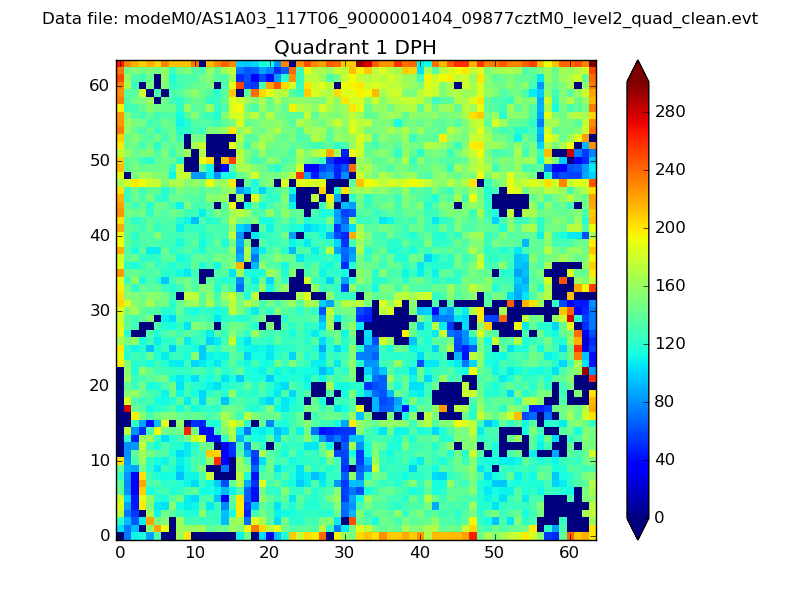 |
Quadrant B |
|---|---|---|---|
| Quadrant D | 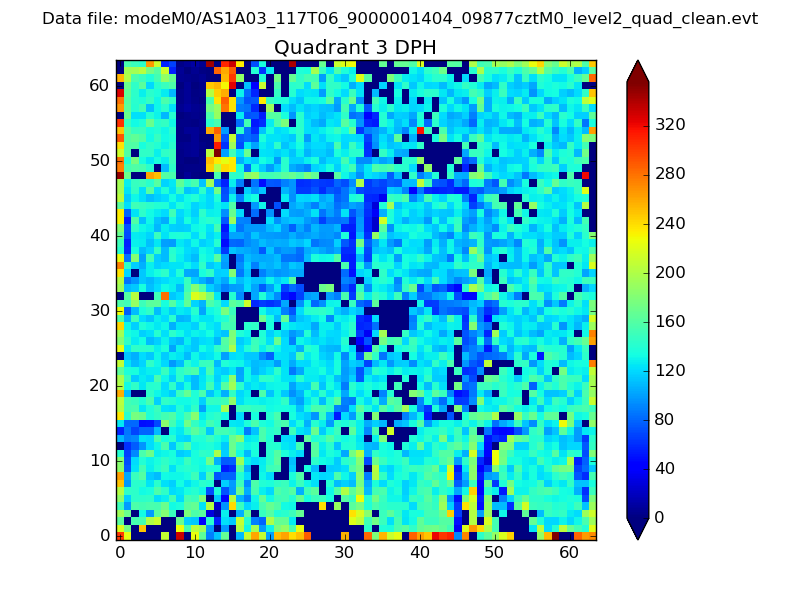 |
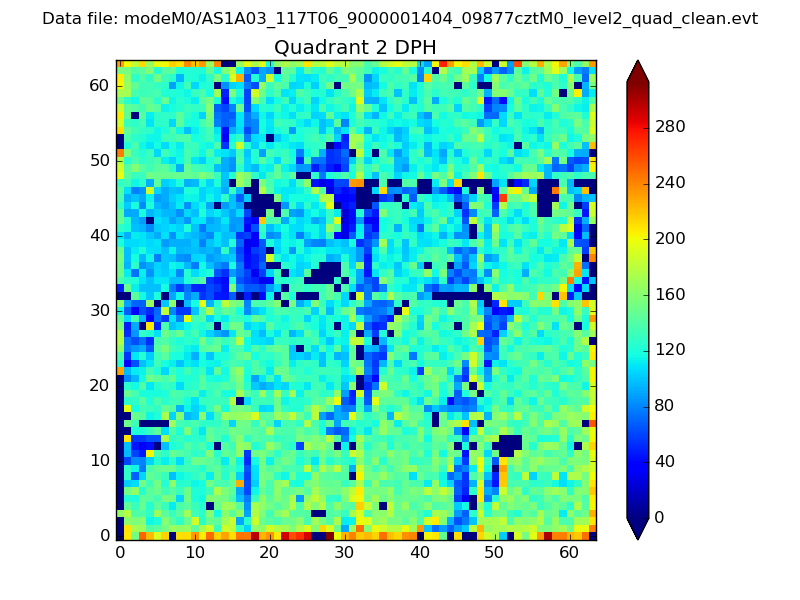 |
Quadrant C |
| Plot type | Count rate plots | Images |
|---|---|---|
| Comparison with Poisson distribution Blue bars denote a histogram of data divided into 1 sec bins. Red curve is a Poisson curve with rate = median count rate of data. |
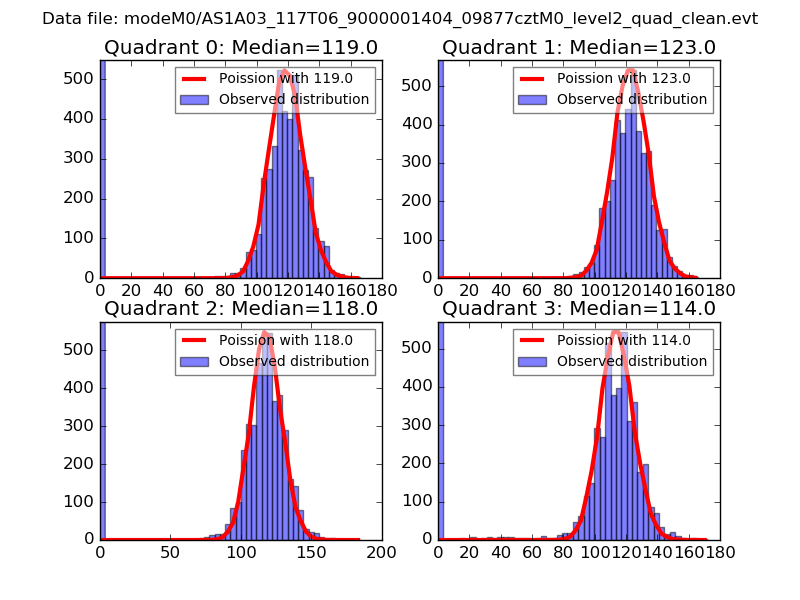 |
 |
| Quadrant-wise count rates Data is divided into 100 sec bins |
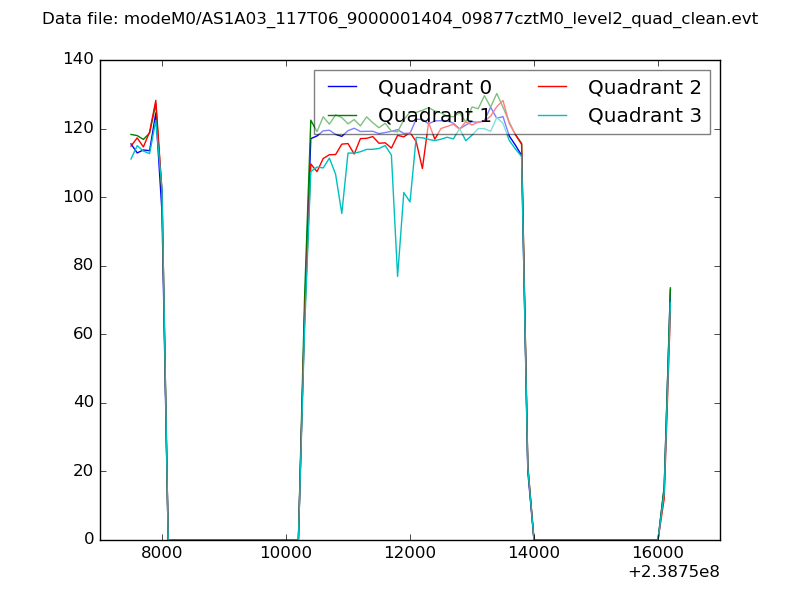 |
|
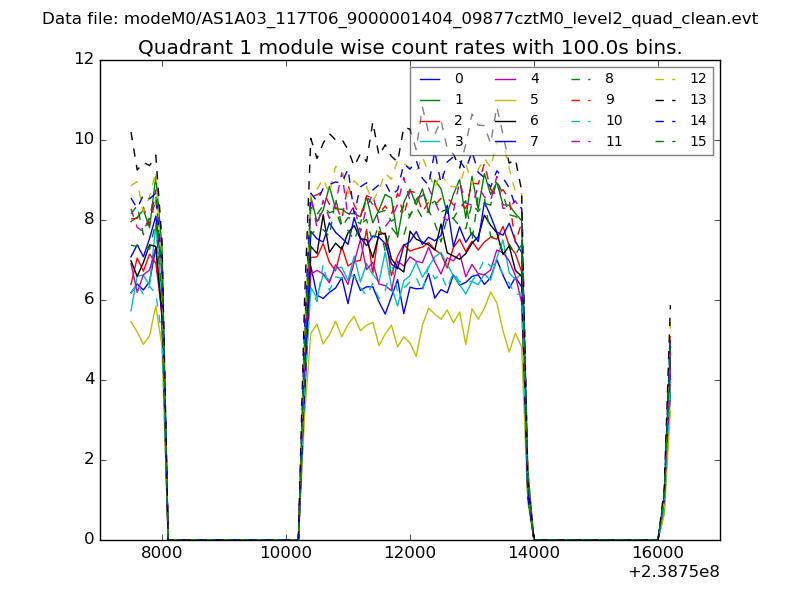
| Module-wise count rates for Quadrant A Data is divided into 100 sec bins |
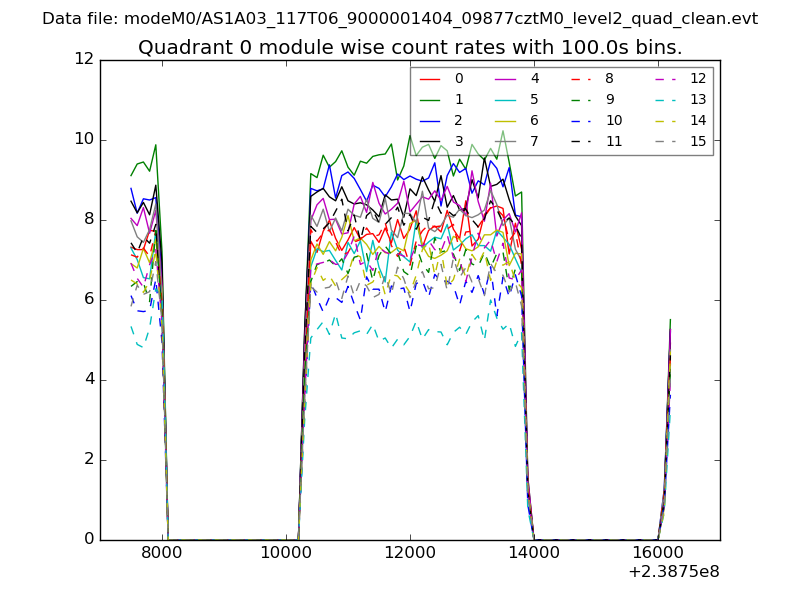 |
 |
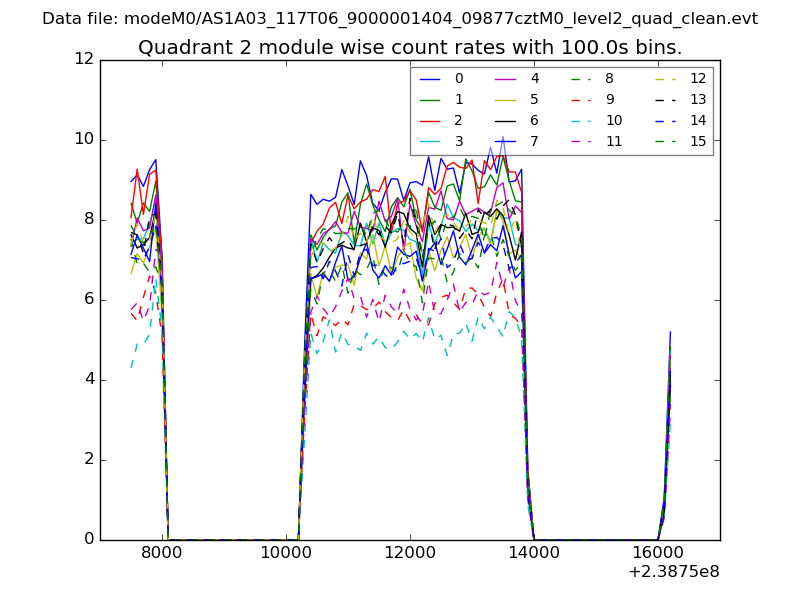
| Module-wise count rates for Quadrant B Data is divided into 100 sec bins |
 |
 |
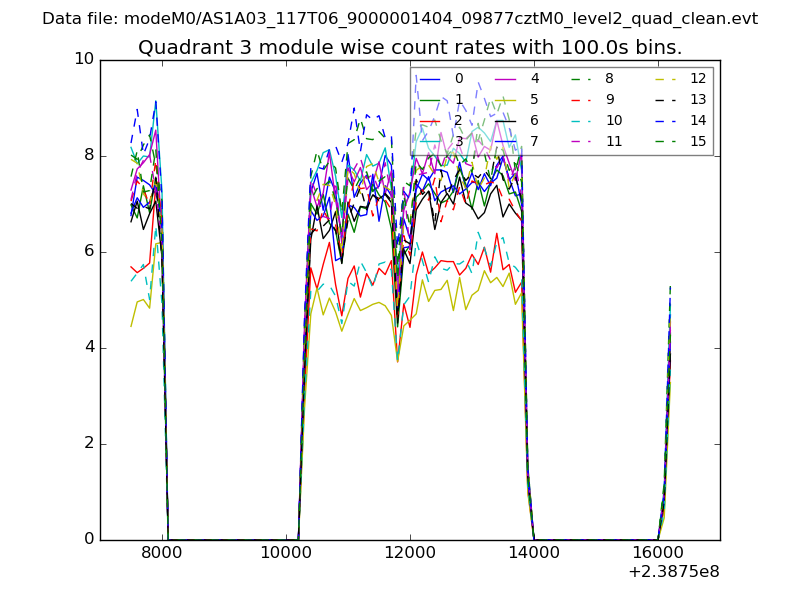
| Module-wise count rates for Quadrant C Data is divided into 100 sec bins |
 |
 |
| Module-wise count rates for Quadrant D Data is divided into 100 sec bins |
 |
 |
| Parameter | Plot |
|---|---|
| CZT HV Monitor | 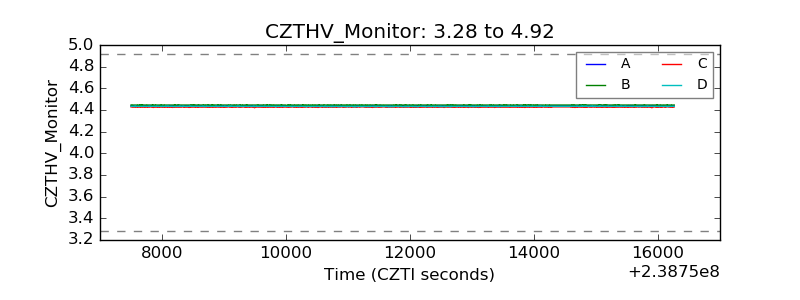 |
| D_VDD | 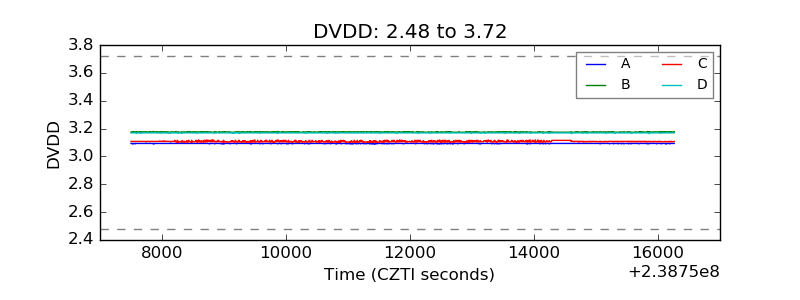 |
| Temperature 1 | 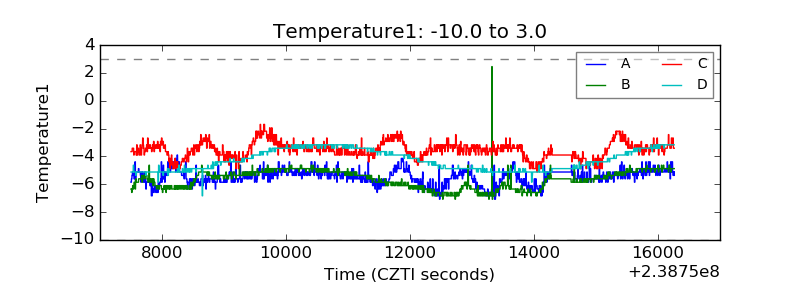 |
| Veto HV Monitor | 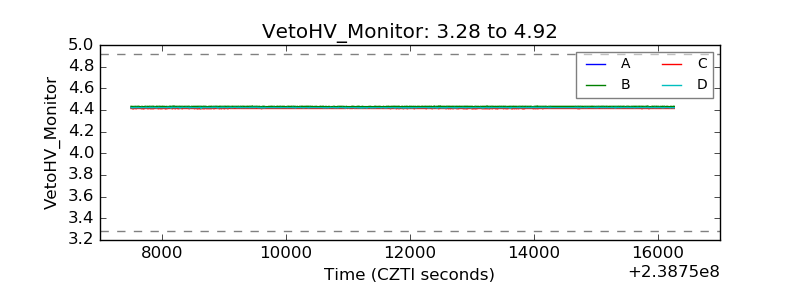 |
| Veto LLD | 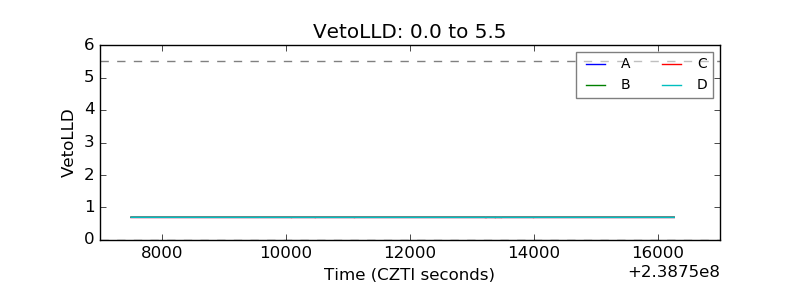 |
| Alpha Counter | 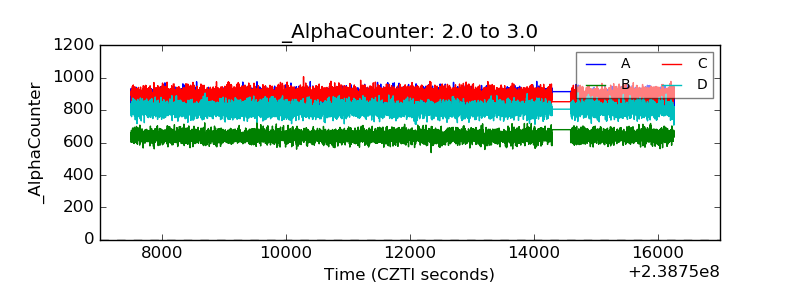 |
| _CPM_Rate | 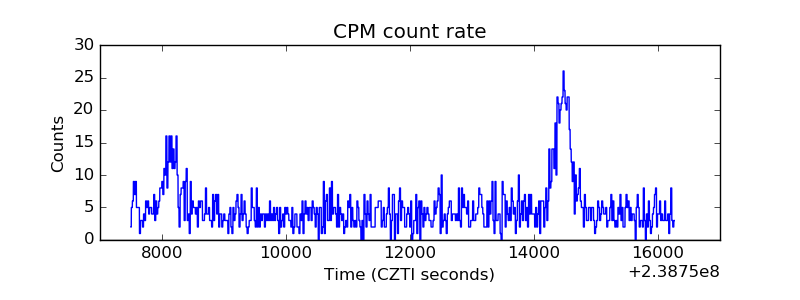 |
| CZT Counter | 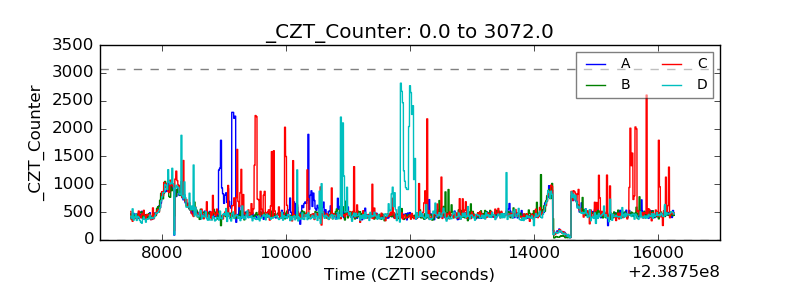 |
| +2.5 Volts monitor | 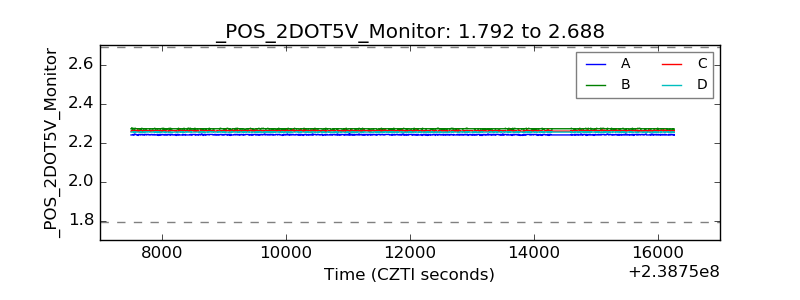 |
| +5 Volts monitor | 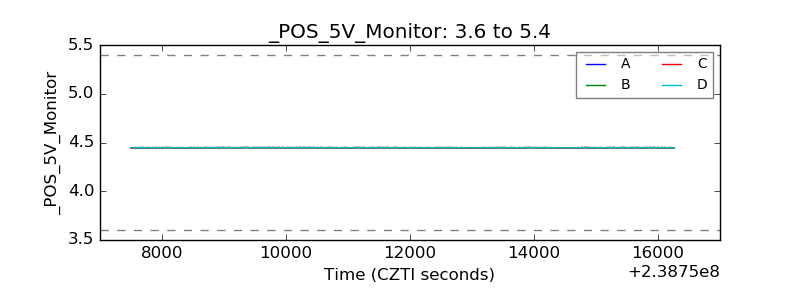 |
| _ROLL_ROT | 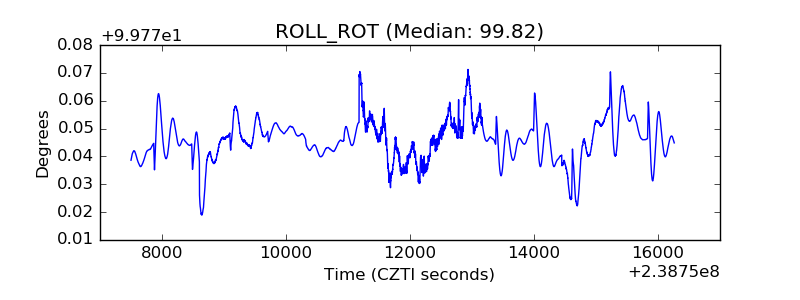 |
| _Roll_DEC | 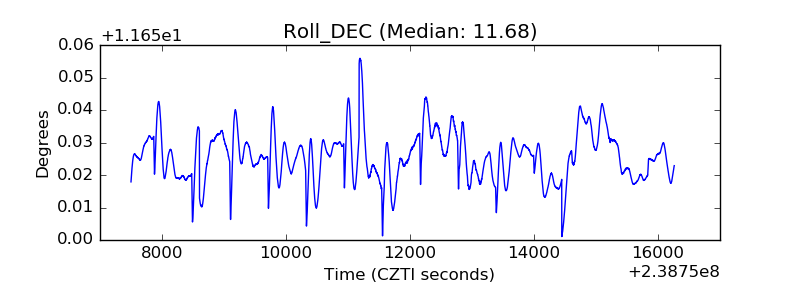 |
| _Roll_RA | 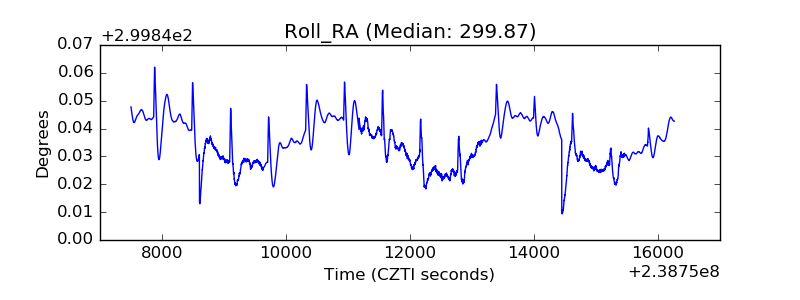 |
| Veto Counter | 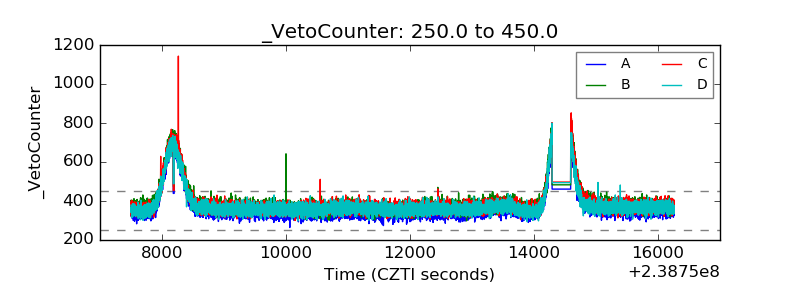 |