| Param | Original file | Final file |
|---|---|---|
| Filename | modeM0/AS1A03_117T06_9000001404_09883cztM0_level2.evt | modeM0/AS1A03_117T06_9000001404_09883cztM0_level2_quad_clean.evt |
| Size (bytes) | 456,600,960 | 97,467,840 |
| Size | 435.4 MB | 93.0 MB |
| Events in quadrant A | 3,292,227 | 619,698 |
| Events in quadrant B | 3,306,916 | 643,614 |
| Events in quadrant C | 3,431,254 | 623,269 |
| Events in quadrant D | 3,336,910 | 593,440 |
| Mode M9 | |||
|---|---|---|---|
| Quadrant | BADHDUFLAG | Total packets | Discarded packets |
| A | 0 | 22 | 0 |
| B | 0 | 22 | 0 |
| C | 0 | 22 | 0 |
| D | 0 | 22 | 0 |
| Mode M0 | |||
|---|---|---|---|
| Quadrant | BADHDUFLAG | Total packets | Discarded packets |
| A | 0 | 15124 | 765 |
| B | 0 | 15035 | 705 |
| C | 0 | 15553 | 731 |
| D | 0 | 15388 | 716 |
| Mode SS | |||
|---|---|---|---|
| Quadrant | BADHDUFLAG | Total packets | Discarded packets |
| A | 0 | 146 | 6 |
| B | 0 | 146 | 8 |
| C | 0 | 146 | 6 |
| D | 0 | 146 | 6 |
| Quadrant | Total seconds | Saturated seconds | Saturation percentage |
|---|---|---|---|
| A | 6754 | 89 | 1.317738% |
| B | 6780 | 106 | 1.563422% |
| C | 6774 | 134 | 1.978152% |
| D | 6776 | 120 | 1.770956% |
Noise dominated data is calculated using 1-second bins in cleaned event files. If a bin has >2000 counts, and if more than 50% of those come from <1% of pixels, then it is considered to be noise-dominated and hence unusable.
| Quadrant | # 1 sec bins | Bins with >0 counts | Bins with >2000 counts | High rate bins dominated by noise | Noise dominated (total time) | Noise dominated (detector-on time) | Marked lightcurve |
|---|---|---|---|---|---|---|---|
| A | 9326 | 6953 | 0 | 0 | 0.00% | 0.00% | 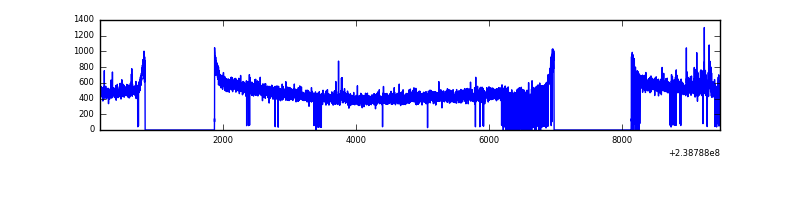 |
| B | 9326 | 6978 | 3 | 3 | 0.03% | 0.04% | 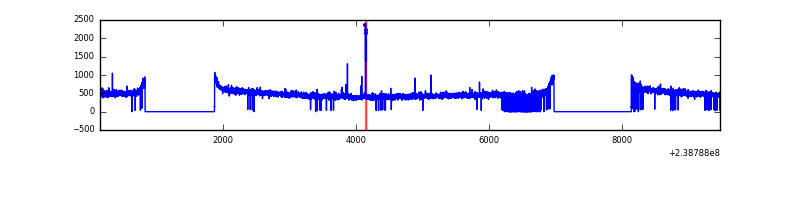 |
| C | 9326 | 6976 | 39 | 39 | 0.42% | 0.56% | 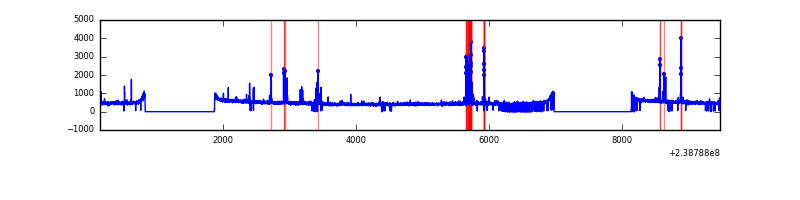 |
| D | 9326 | 6981 | 42 | 42 | 0.45% | 0.60% | 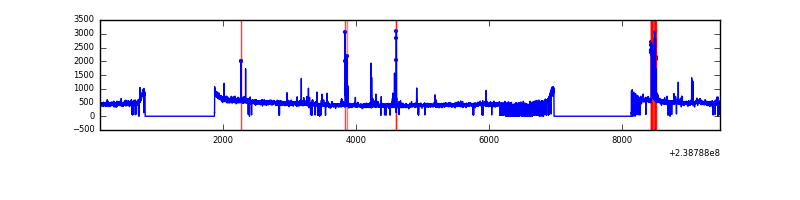 |
Top three noisy pixels from each quadrant. If the there are fewer than three noisy pixels in the level2.evt file, extra rows are filled as -1
| Pixel properties | Quadrant properties | ||||||
|---|---|---|---|---|---|---|---|
| Quadrant | DetID | PixID | Counts | Sigma | Mean | Median | Sigma |
| A | 13 | 251 | 75109 | 441.24 | 835 | 819 | 168.4 |
| A | 0 | 226 | 7375 | 38.94 | 835 | 819 | 168.4 |
| A | 15 | 239 | 7135 | 37.51 | 835 | 819 | 168.4 |
| B | 12 | 111 | 19176 | 112.59 | 846 | 821 | 163.0 |
| B | 4 | 81 | 16905 | 98.66 | 846 | 821 | 163.0 |
| B | 11 | 111 | 15875 | 92.34 | 846 | 821 | 163.0 |
| C | 4 | 254 | 134586 | 703.47 | 826 | 832 | 190.1 |
| C | 14 | 234 | 72864 | 378.85 | 826 | 832 | 190.1 |
| C | 13 | 61 | 6066 | 27.53 | 826 | 832 | 190.1 |
| D | 1 | 52 | 143719 | 679.54 | 813 | 797 | 210.3 |
| D | 2 | 14 | 39701 | 184.98 | 813 | 797 | 210.3 |
| D | 8 | 195 | 35961 | 167.19 | 813 | 797 | 210.3 |
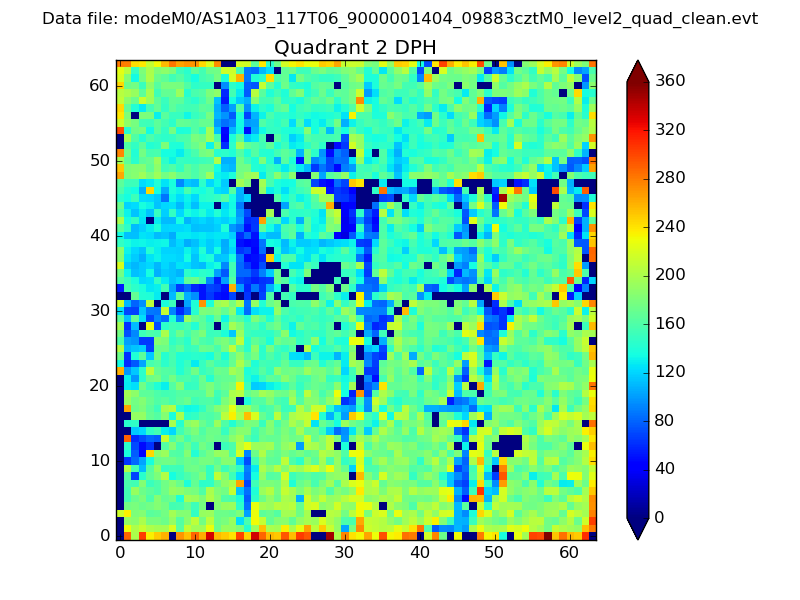
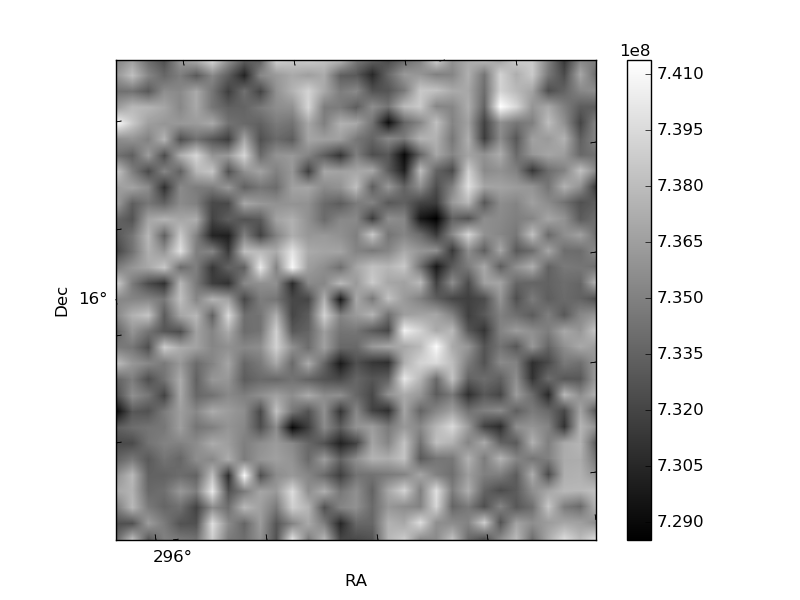
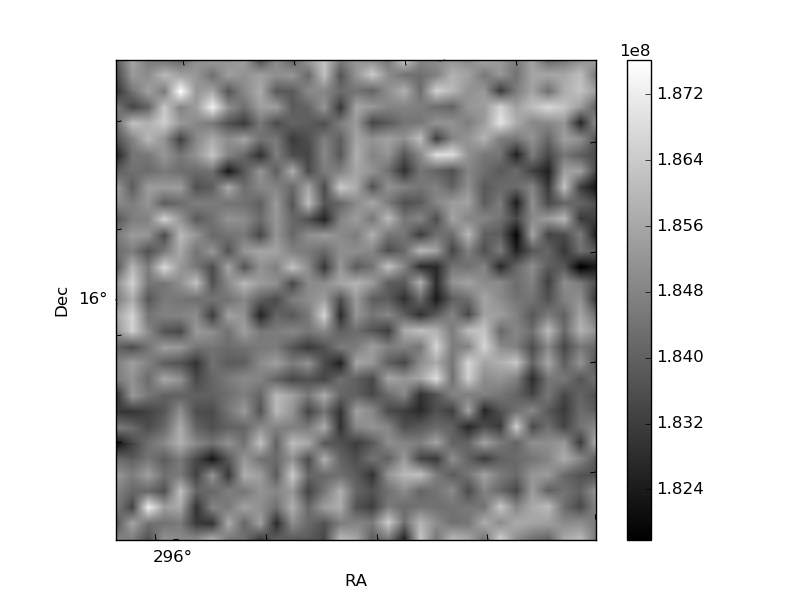
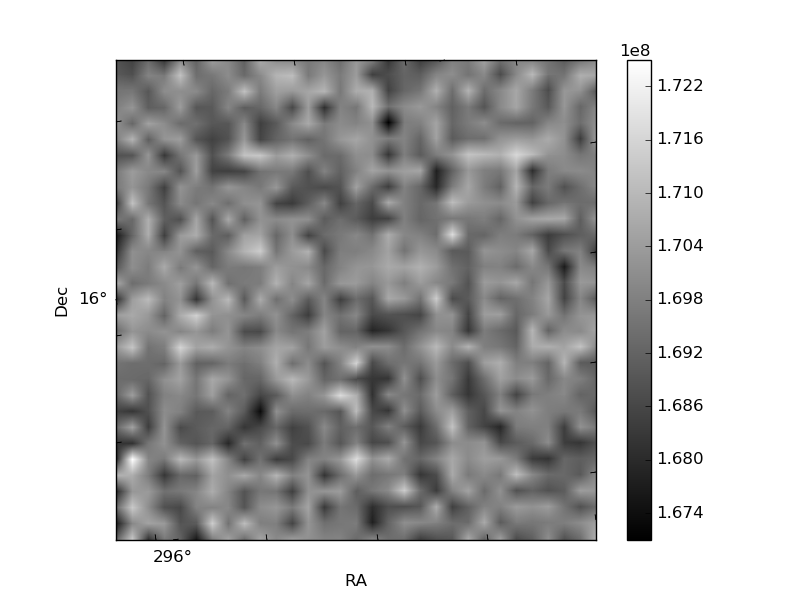
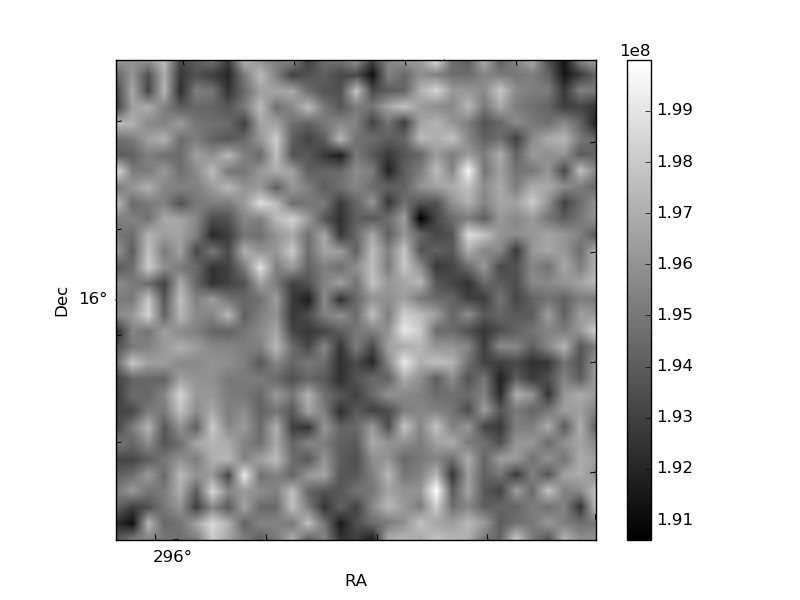
Histogram calculated using DETX and DETY for each event in the final _common_clean file
| Quadrant A | 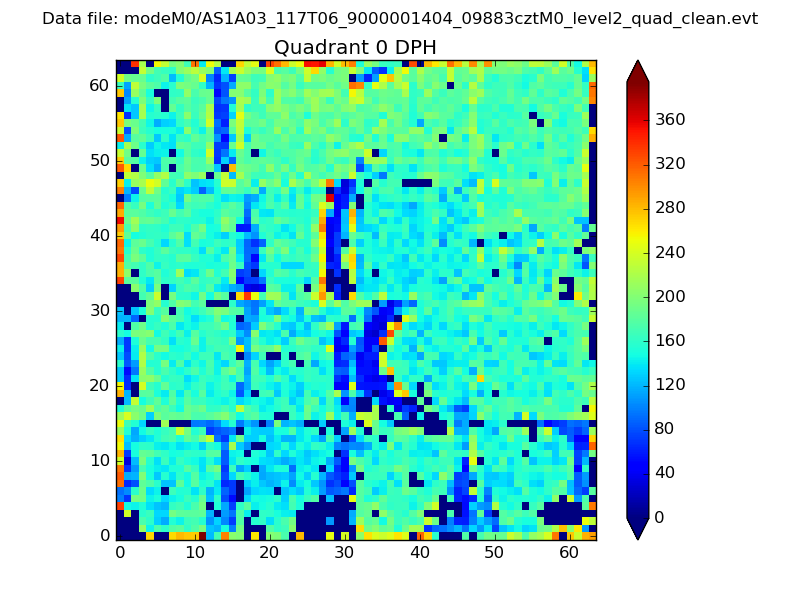 |
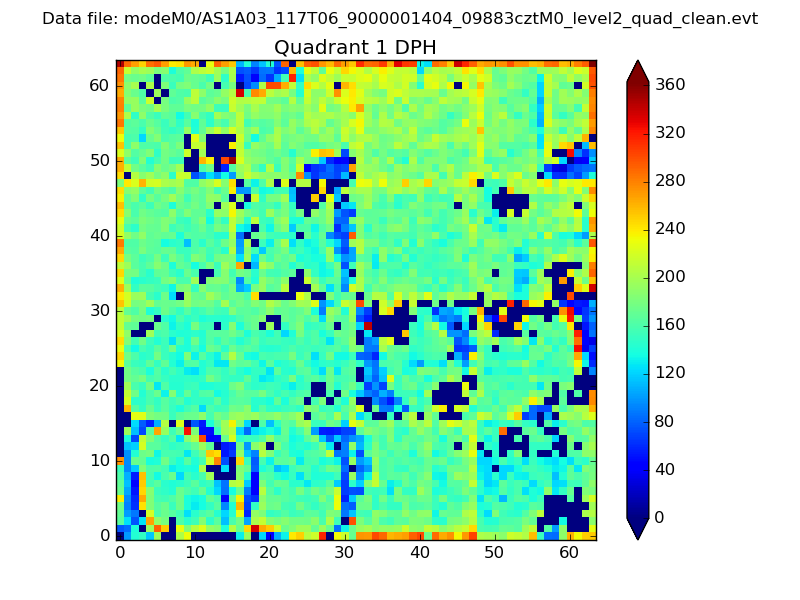 |
Quadrant B |
|---|---|---|---|
| Quadrant D | 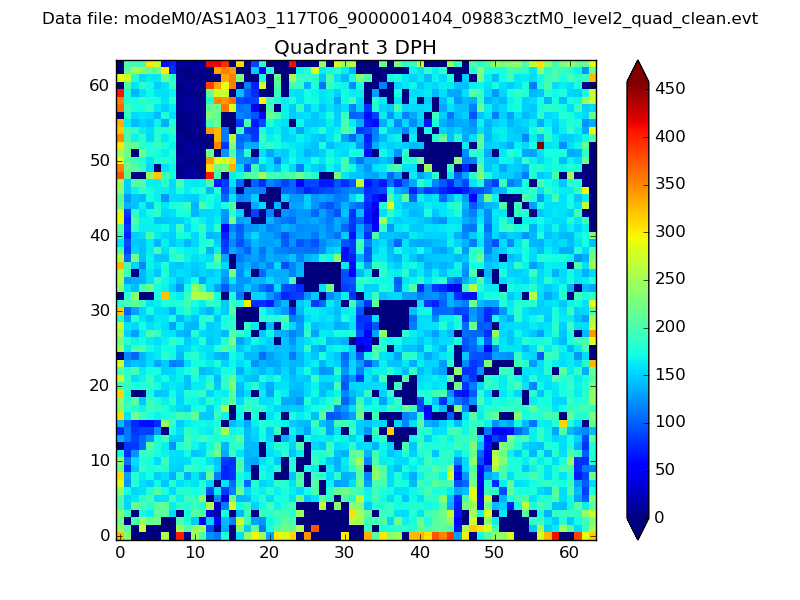 |
 |
Quadrant C |
| Plot type | Count rate plots | Images |
|---|---|---|
| Comparison with Poisson distribution Blue bars denote a histogram of data divided into 1 sec bins. Red curve is a Poisson curve with rate = median count rate of data. |
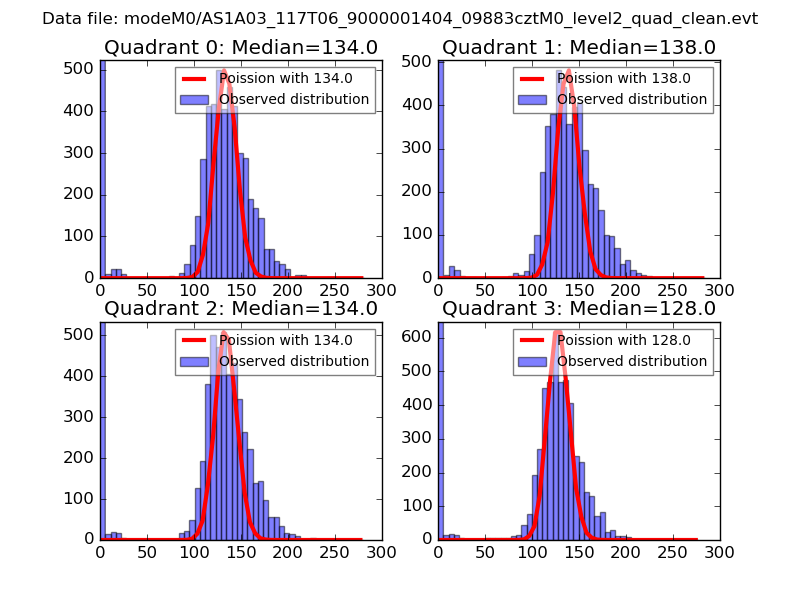 |
 |
| Quadrant-wise count rates Data is divided into 100 sec bins |
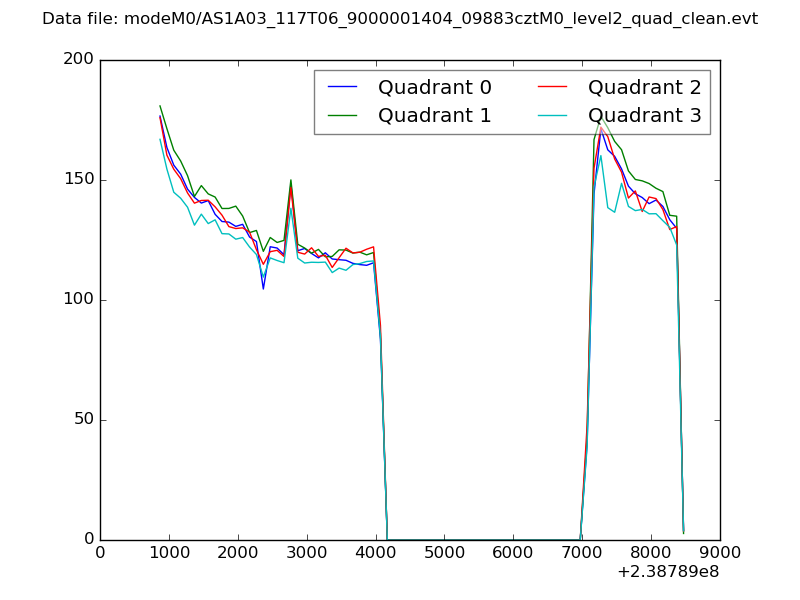 |
|
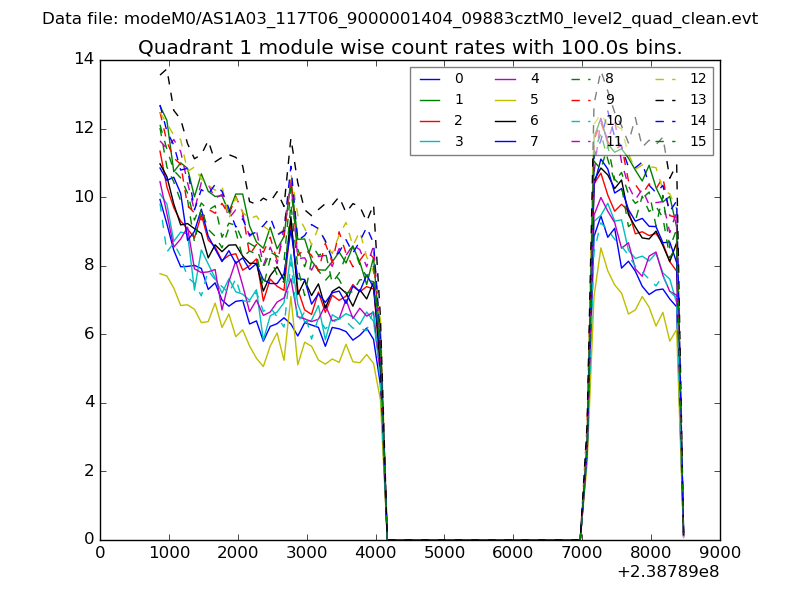
| Module-wise count rates for Quadrant A Data is divided into 100 sec bins |
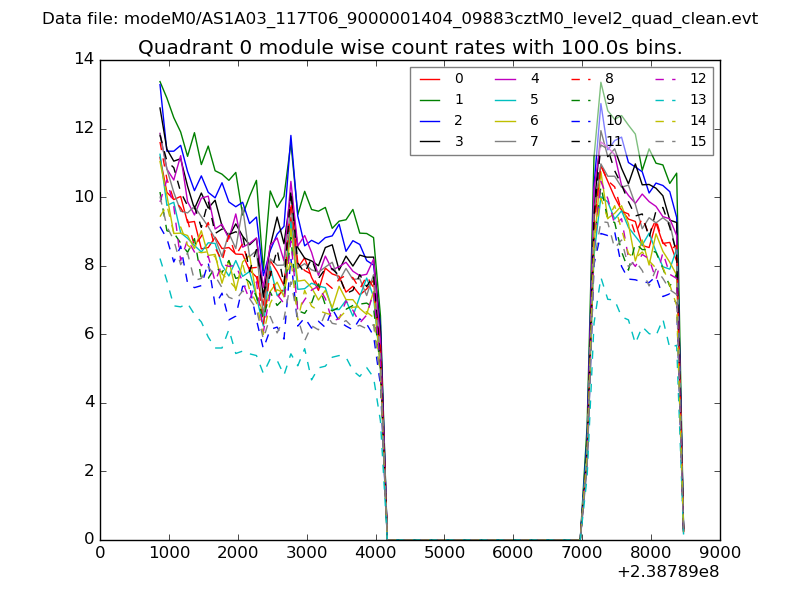 |
 |
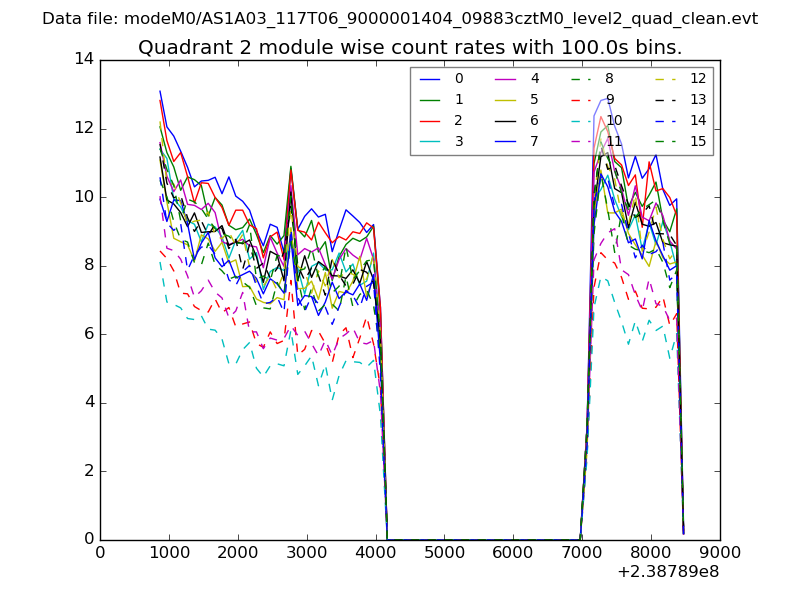
| Module-wise count rates for Quadrant B Data is divided into 100 sec bins |
 |
 |
| Module-wise count rates for Quadrant C Data is divided into 100 sec bins |
 |
 |
| Module-wise count rates for Quadrant D Data is divided into 100 sec bins |
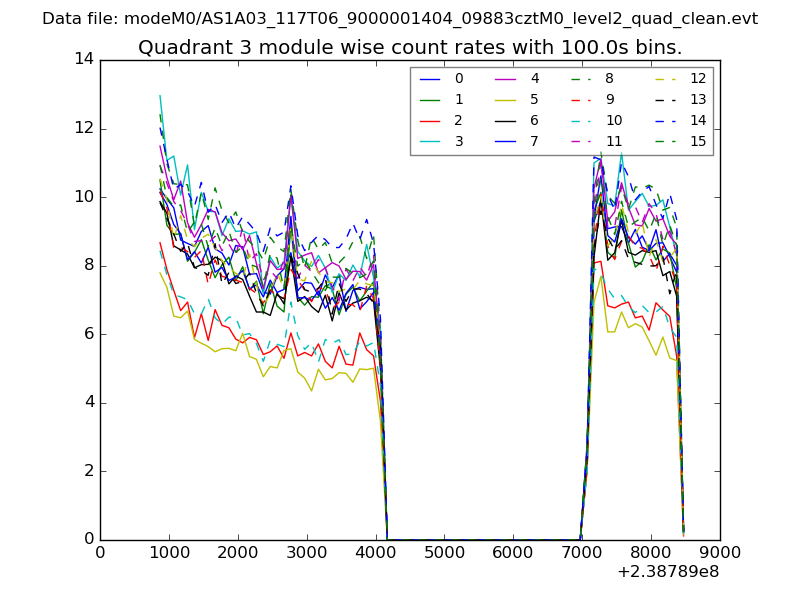 |
 |
| Parameter | Plot |
|---|---|
| CZT HV Monitor | 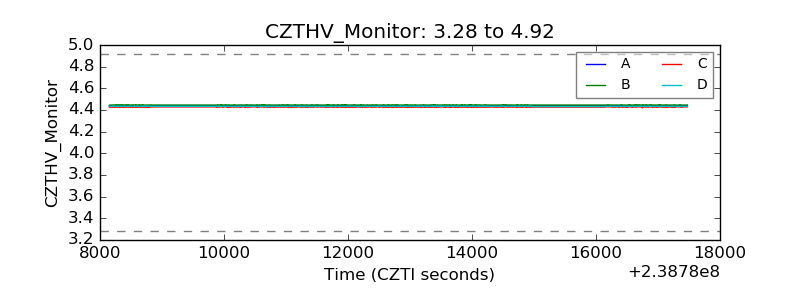 |
| D_VDD | 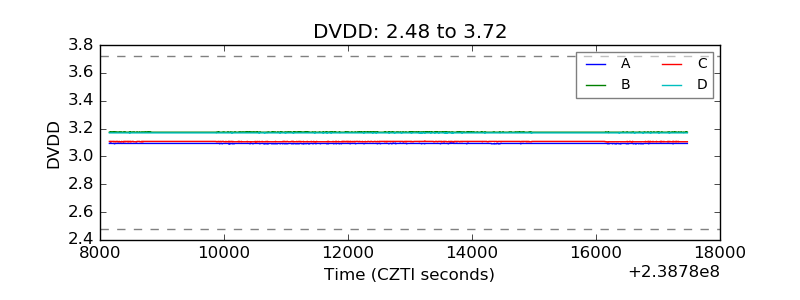 |
| Temperature 1 |  |
| Veto HV Monitor |  |
| Veto LLD | 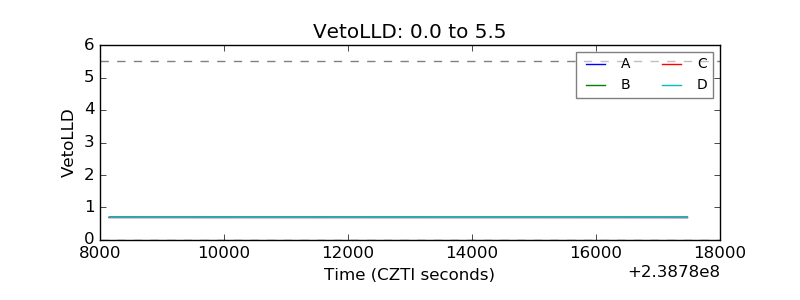 |
| Alpha Counter | 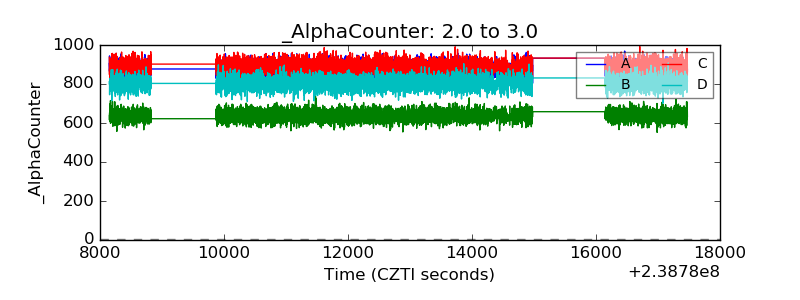 |
| _CPM_Rate | 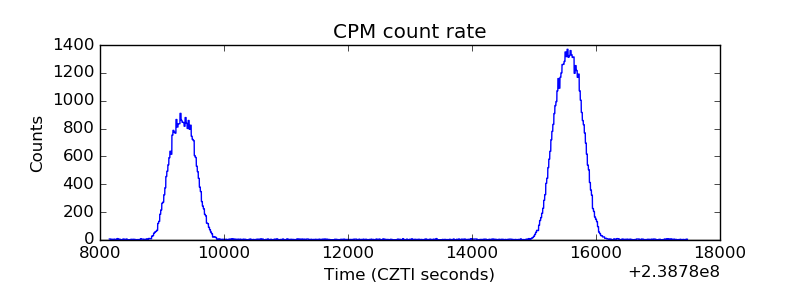 |
| CZT Counter | 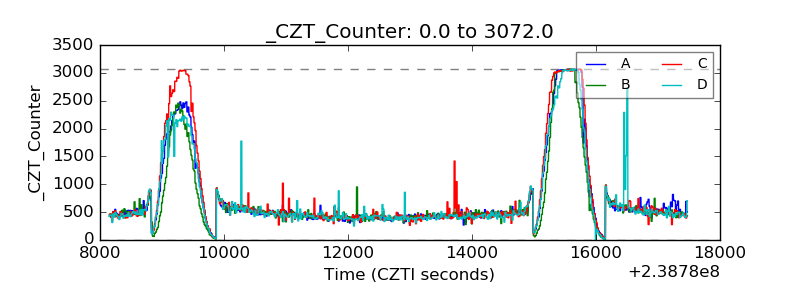 |
| +2.5 Volts monitor |  |
| +5 Volts monitor |  |
| _ROLL_ROT | 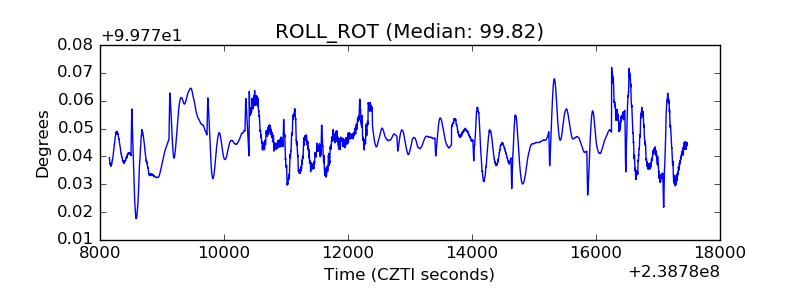 |
| _Roll_DEC | 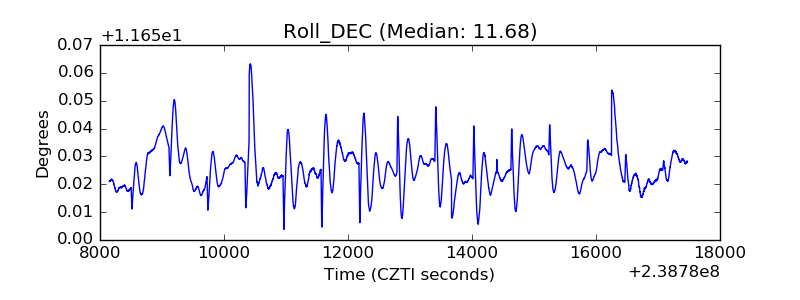 |
| _Roll_RA | 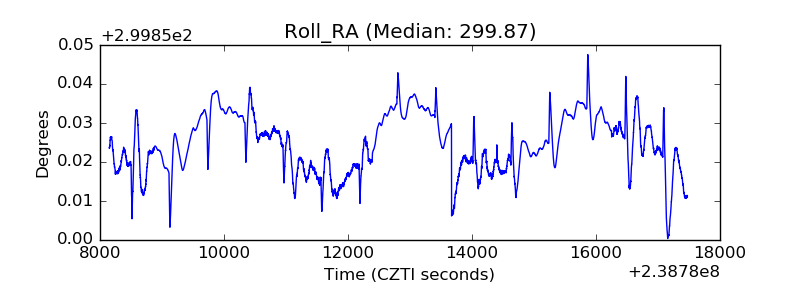 |
| Veto Counter | 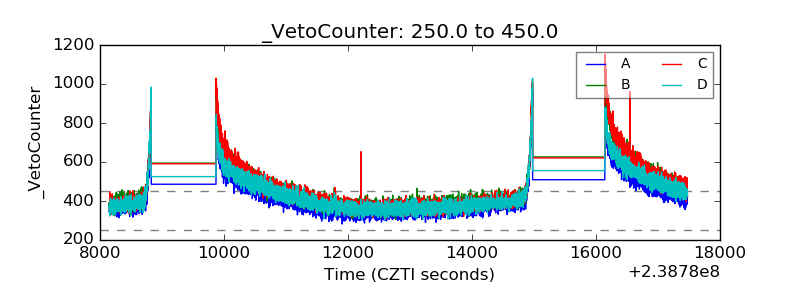 |