| Param | Original file | Final file |
|---|---|---|
| Filename | modeM0/AS1A03_117T06_9000001404_09884cztM0_level2.evt | modeM0/AS1A03_117T06_9000001404_09884cztM0_level2_quad_clean.evt |
| Size (bytes) | 444,925,440 | 89,919,360 |
| Size | 424.3 MB | 85.8 MB |
| Events in quadrant A | 3,289,995 | 565,181 |
| Events in quadrant B | 3,258,376 | 593,534 |
| Events in quadrant C | 3,232,673 | 570,455 |
| Events in quadrant D | 3,247,813 | 537,003 |
| Mode M9 | |||
|---|---|---|---|
| Quadrant | BADHDUFLAG | Total packets | Discarded packets |
| A | 0 | 25 | 0 |
| B | 0 | 25 | 0 |
| C | 0 | 25 | 0 |
| D | 0 | 25 | 0 |
| Mode M0 | |||
|---|---|---|---|
| Quadrant | BADHDUFLAG | Total packets | Discarded packets |
| A | 0 | 14257 | 280 |
| B | 0 | 14138 | 246 |
| C | 0 | 14251 | 263 |
| D | 0 | 14329 | 244 |
| Mode SS | |||
|---|---|---|---|
| Quadrant | BADHDUFLAG | Total packets | Discarded packets |
| A | 0 | 136 | 6 |
| B | 0 | 136 | 2 |
| C | 0 | 136 | 0 |
| D | 0 | 136 | 2 |
| Quadrant | Total seconds | Saturated seconds | Saturation percentage |
|---|---|---|---|
| A | 6545 | 60 | 0.916730% |
| B | 6557 | 79 | 1.204819% |
| C | 6554 | 64 | 0.976503% |
| D | 6561 | 88 | 1.341259% |
Noise dominated data is calculated using 1-second bins in cleaned event files. If a bin has >2000 counts, and if more than 50% of those come from <1% of pixels, then it is considered to be noise-dominated and hence unusable.
| Quadrant | # 1 sec bins | Bins with >0 counts | Bins with >2000 counts | High rate bins dominated by noise | Noise dominated (total time) | Noise dominated (detector-on time) | Marked lightcurve |
|---|---|---|---|---|---|---|---|
| A | 9128 | 6658 | 0 | 0 | 0.00% | 0.00% | 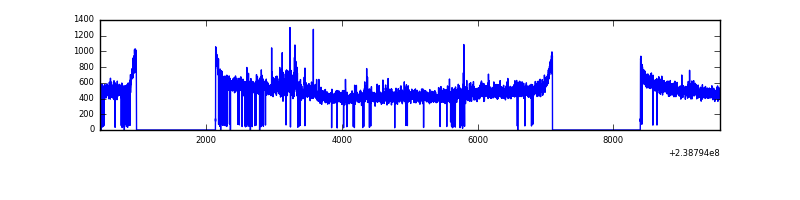 |
| B | 9127 | 6665 | 0 | 0 | 0.00% | 0.00% | 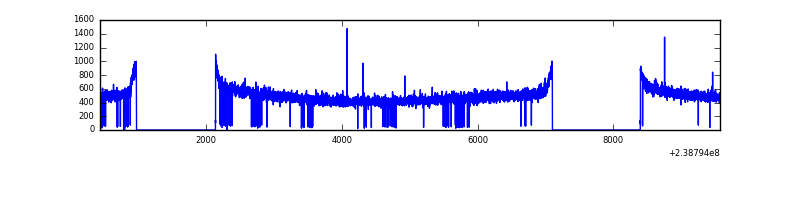 |
| C | 9128 | 6661 | 7 | 7 | 0.08% | 0.11% | 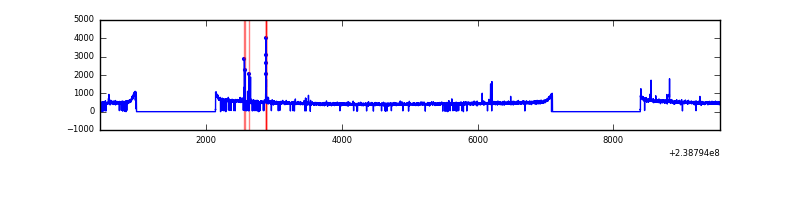 |
| D | 9128 | 6667 | 36 | 36 | 0.39% | 0.54% | 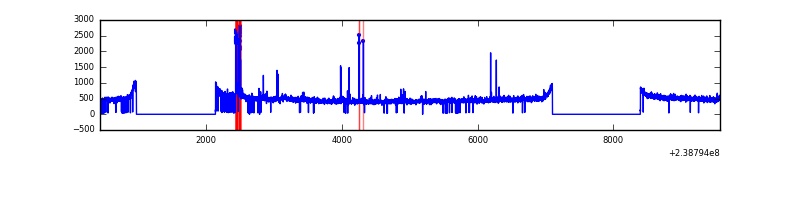 |
Top three noisy pixels from each quadrant. If the there are fewer than three noisy pixels in the level2.evt file, extra rows are filled as -1
| Pixel properties | Quadrant properties | ||||||
|---|---|---|---|---|---|---|---|
| Quadrant | DetID | PixID | Counts | Sigma | Mean | Median | Sigma |
| A | 13 | 251 | 113614 | 682.95 | 825 | 808 | 165.2 |
| A | 0 | 226 | 7367 | 39.71 | 825 | 808 | 165.2 |
| A | 12 | 194 | 6653 | 35.39 | 825 | 808 | 165.2 |
| B | 12 | 111 | 18444 | 111.09 | 836 | 816 | 158.7 |
| B | 11 | 111 | 15474 | 92.37 | 836 | 816 | 158.7 |
| B | 14 | 111 | 13147 | 77.71 | 836 | 816 | 158.7 |
| C | 14 | 234 | 48025 | 252.04 | 813 | 817 | 187.3 |
| C | 4 | 254 | 12469 | 62.21 | 813 | 817 | 187.3 |
| C | 13 | 61 | 5990 | 27.62 | 813 | 817 | 187.3 |
| D | 1 | 52 | 133742 | 646.54 | 798 | 782 | 205.6 |
| D | 8 | 195 | 32396 | 153.73 | 798 | 782 | 205.6 |
| D | 2 | 234 | 29478 | 139.54 | 798 | 782 | 205.6 |
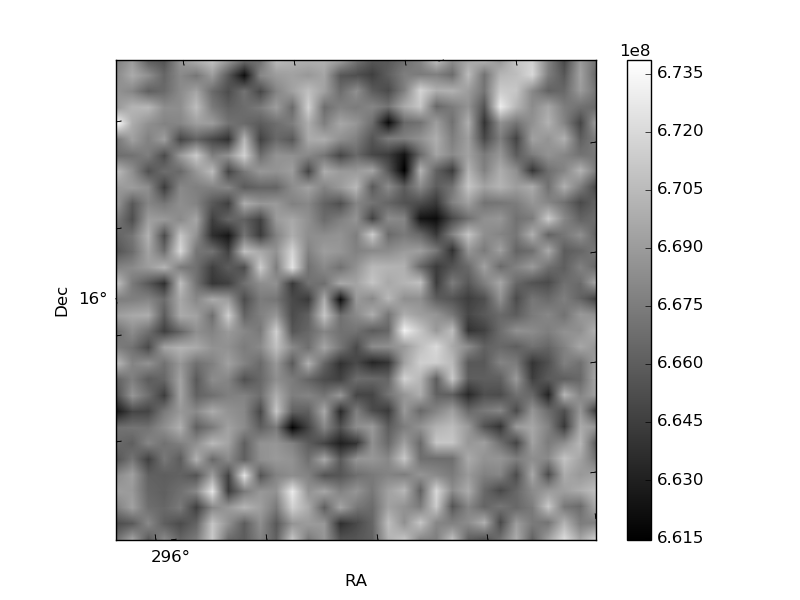
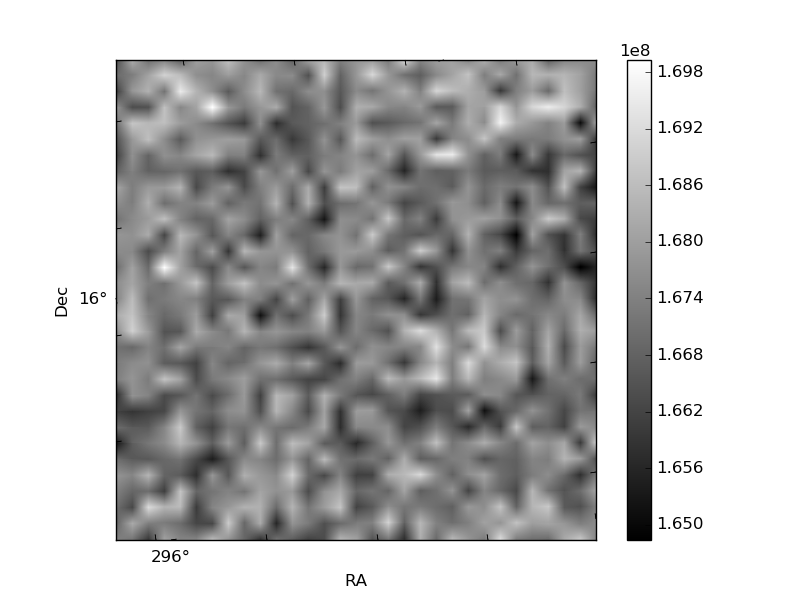
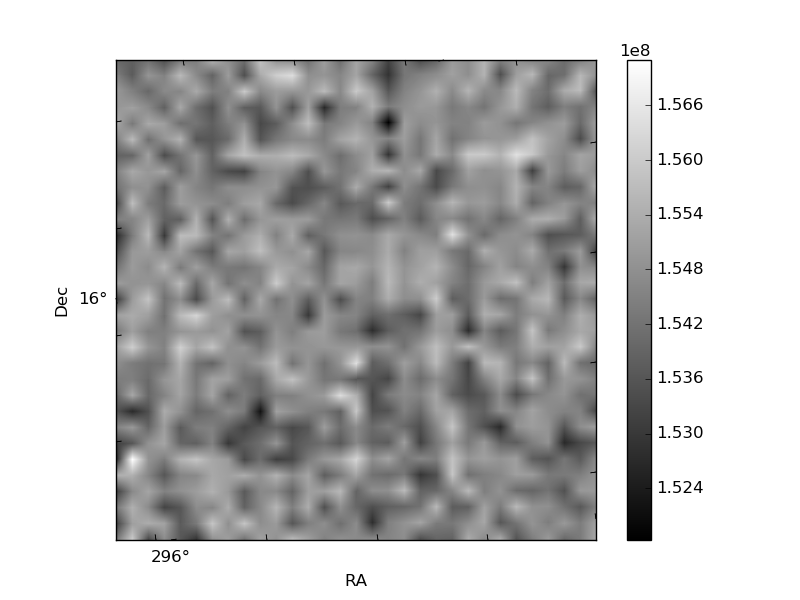
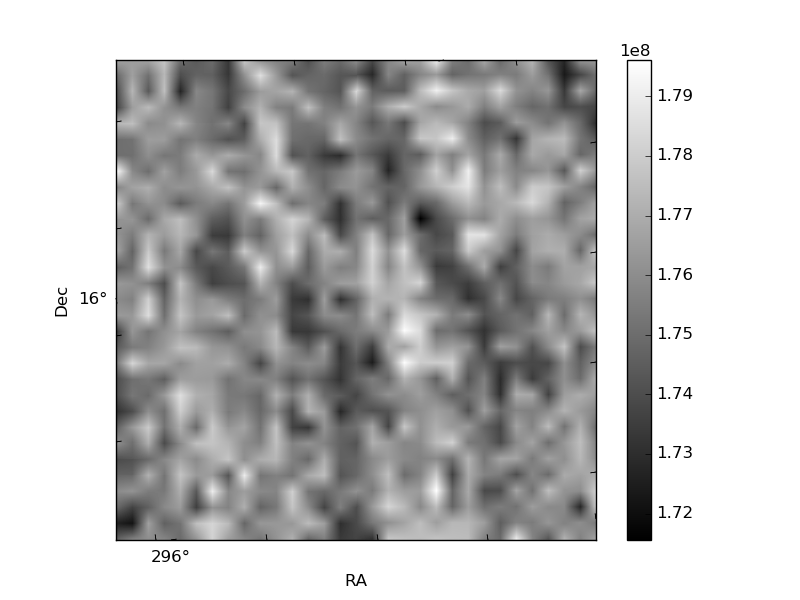
Histogram calculated using DETX and DETY for each event in the final _common_clean file
| Quadrant A | 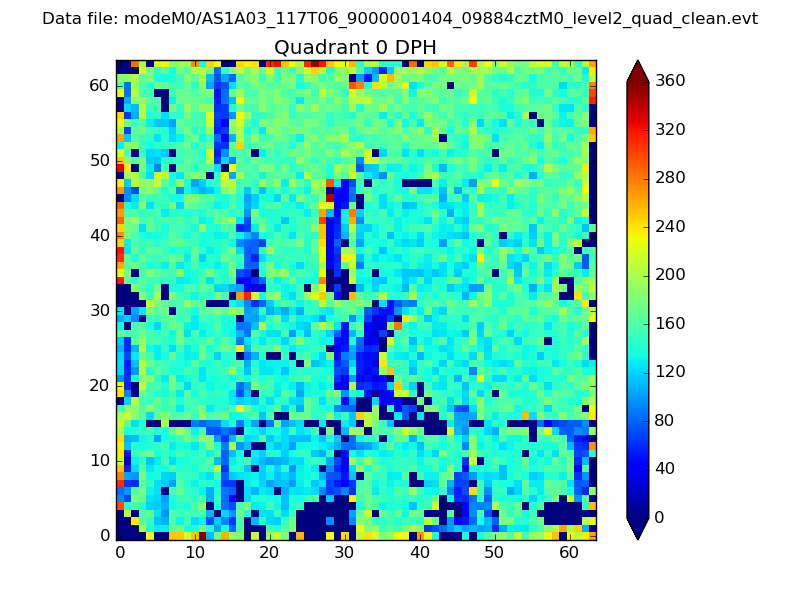 |
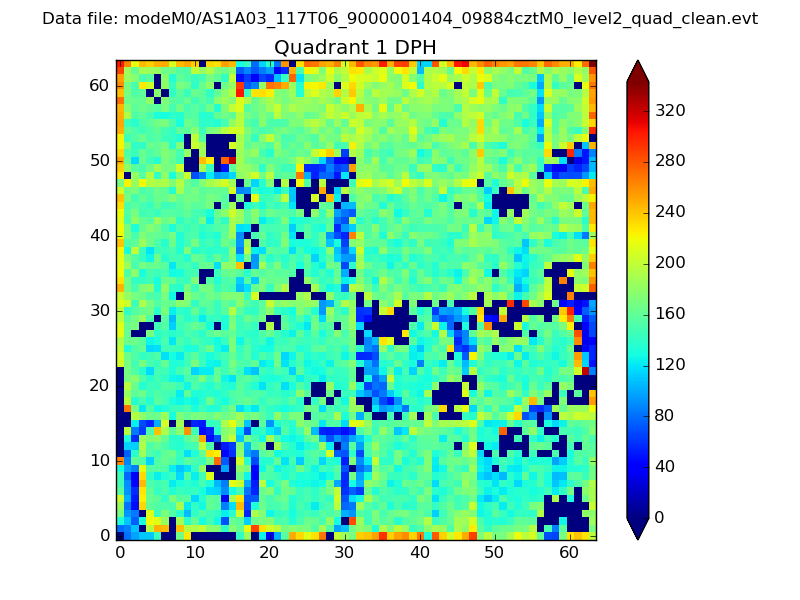 |
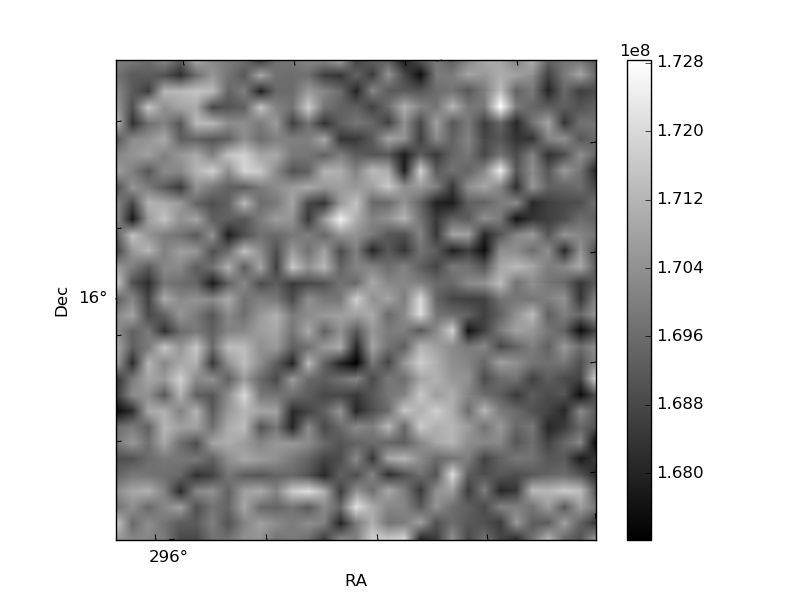
Quadrant B |
|---|---|---|---|
| Quadrant D | 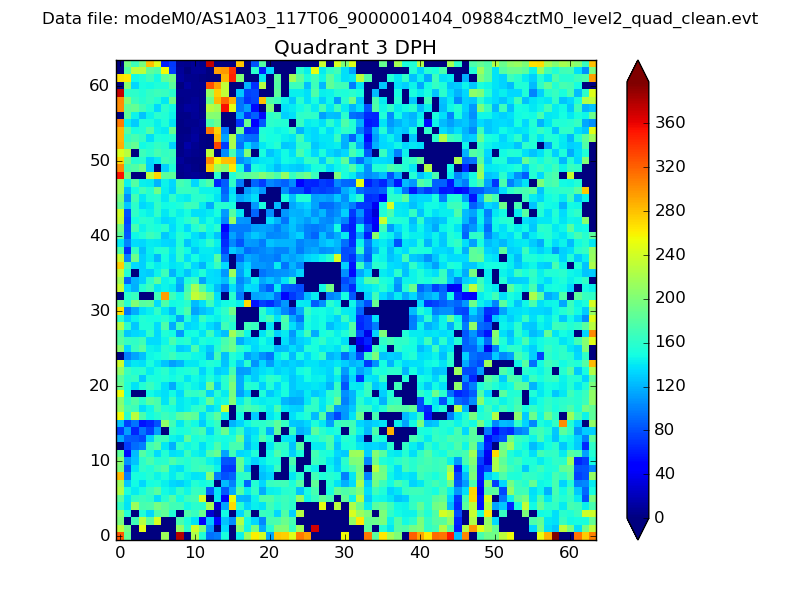 |
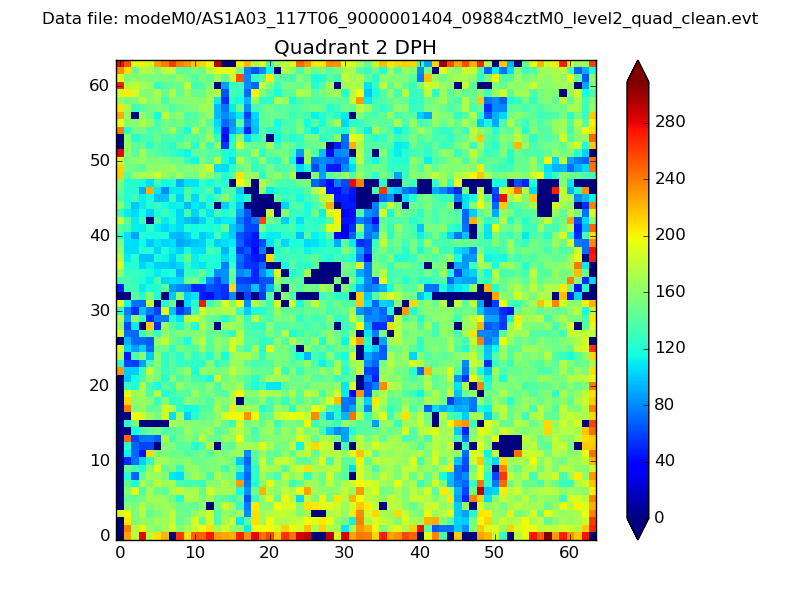 |
Quadrant C |
| Plot type | Count rate plots | Images |
|---|---|---|
| Comparison with Poisson distribution Blue bars denote a histogram of data divided into 1 sec bins. Red curve is a Poisson curve with rate = median count rate of data. |
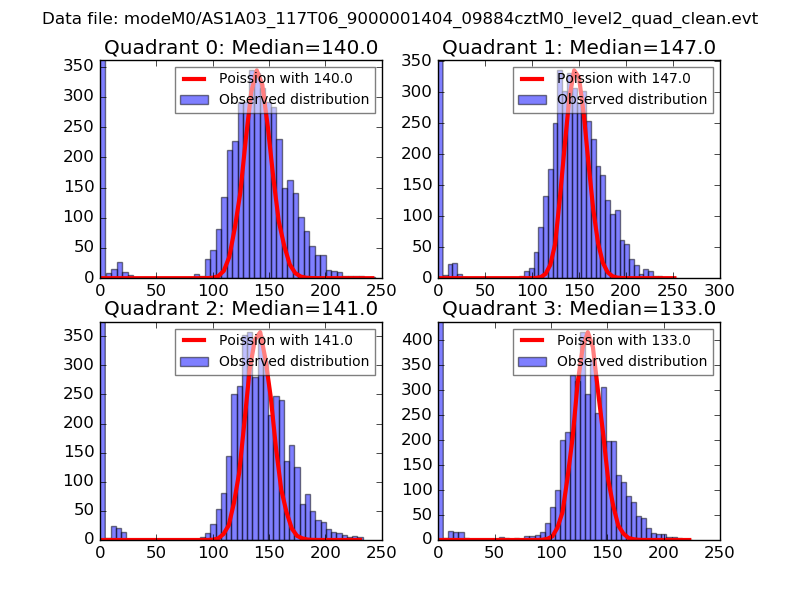 |
 |
| Quadrant-wise count rates Data is divided into 100 sec bins |
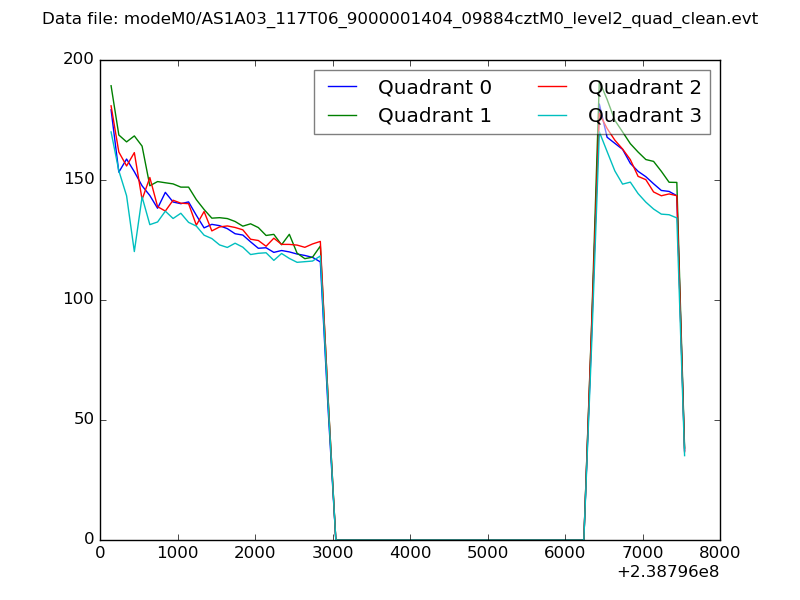 |
|
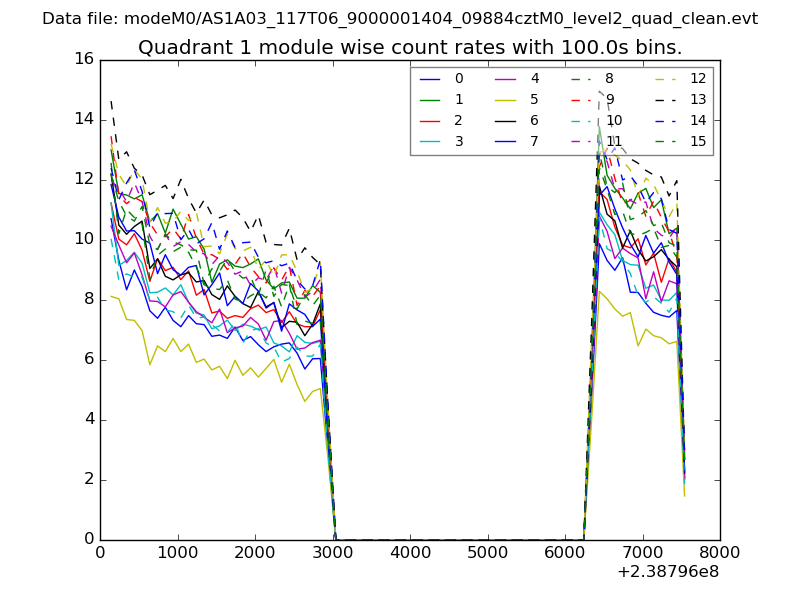
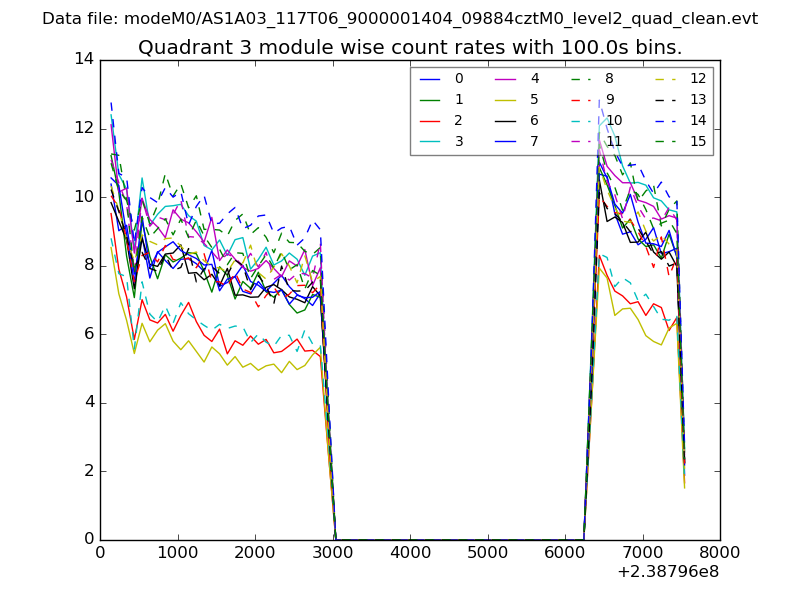
| Module-wise count rates for Quadrant A Data is divided into 100 sec bins |
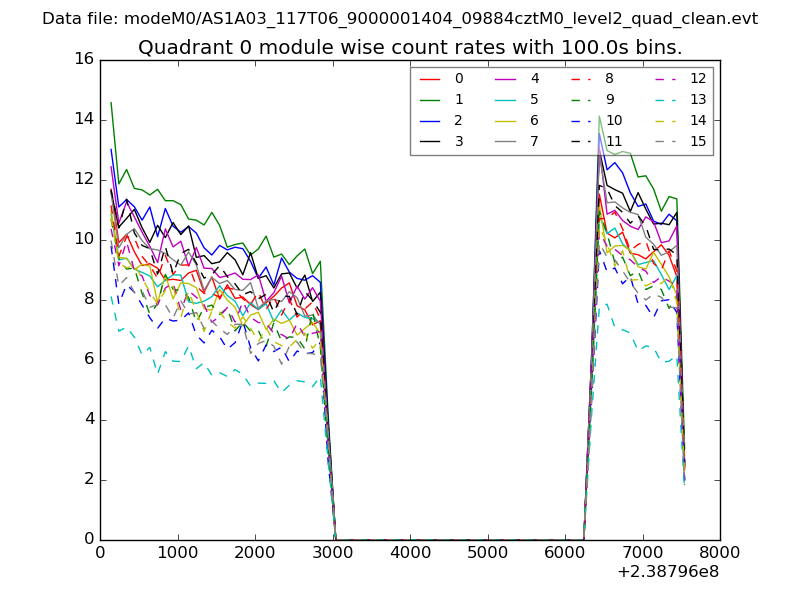 |
 |
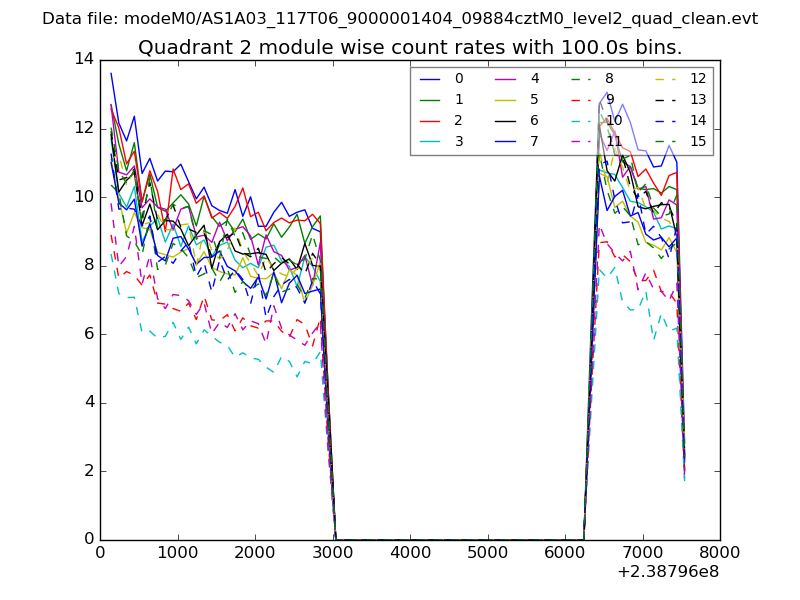
| Module-wise count rates for Quadrant B Data is divided into 100 sec bins |
 |
 |
| Module-wise count rates for Quadrant C Data is divided into 100 sec bins |
 |
 |
| Module-wise count rates for Quadrant D Data is divided into 100 sec bins |
 |
 |
| Parameter | Plot |
|---|---|
| CZT HV Monitor | 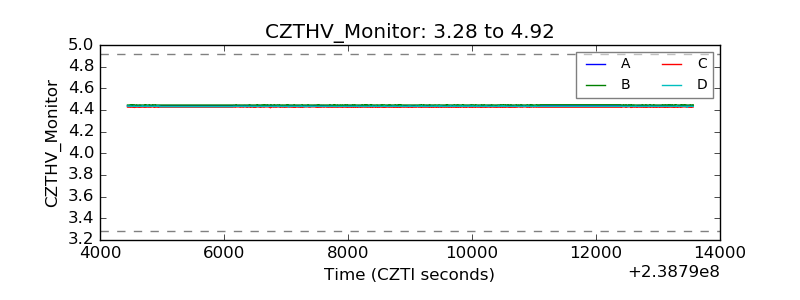 |
| D_VDD | 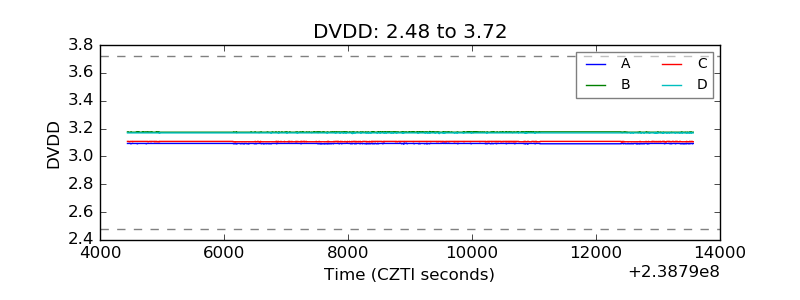 |
| Temperature 1 | 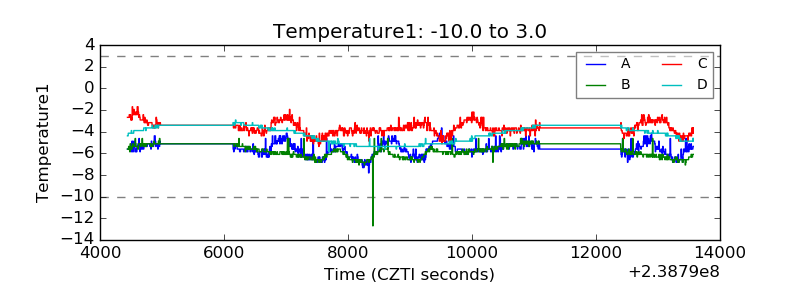 |
| Veto HV Monitor | 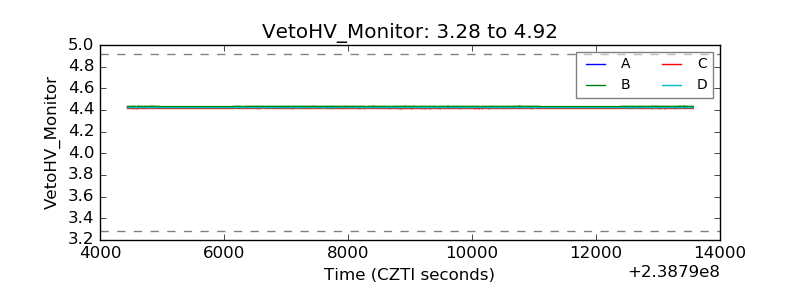 |
| Veto LLD | 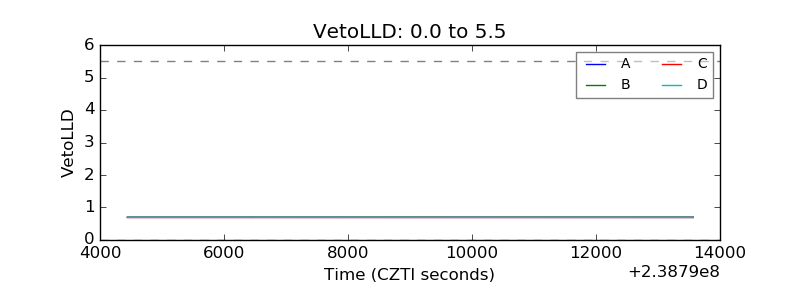 |
| Alpha Counter | 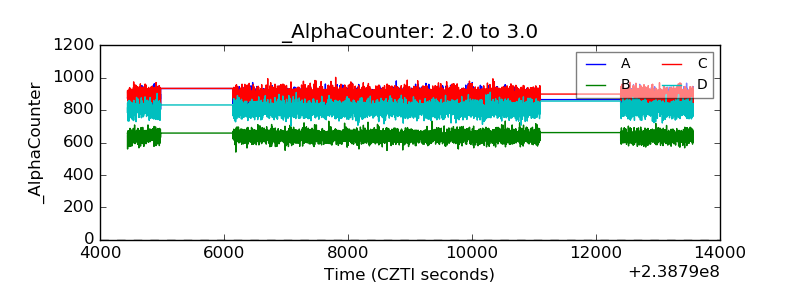 |
| _CPM_Rate | 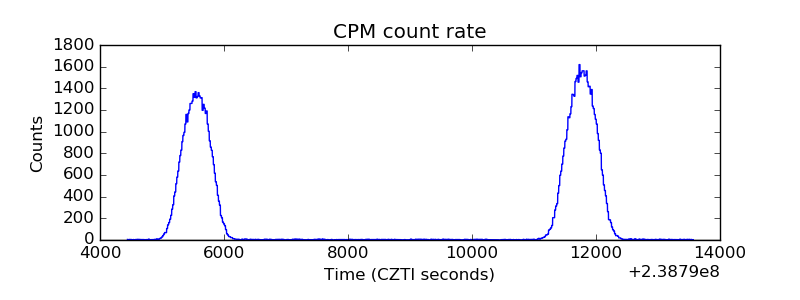 |
| CZT Counter | 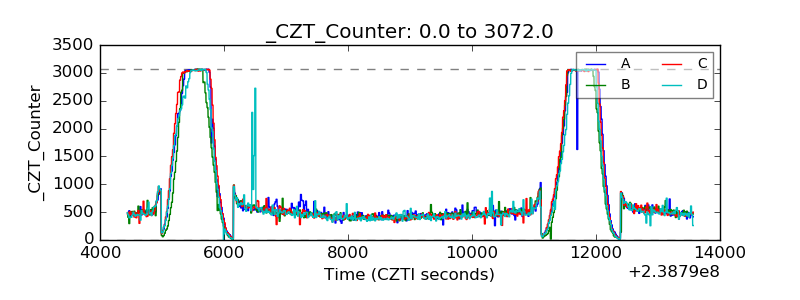 |
| +2.5 Volts monitor |  |
| +5 Volts monitor |  |
| _ROLL_ROT | 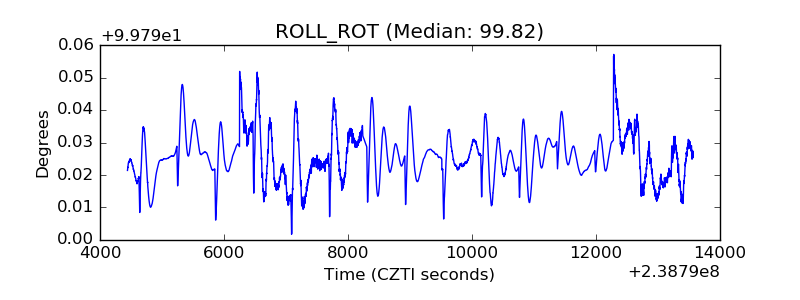 |
| _Roll_DEC | 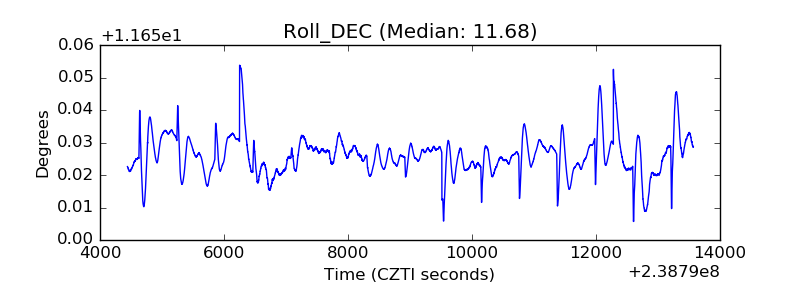 |
| _Roll_RA | 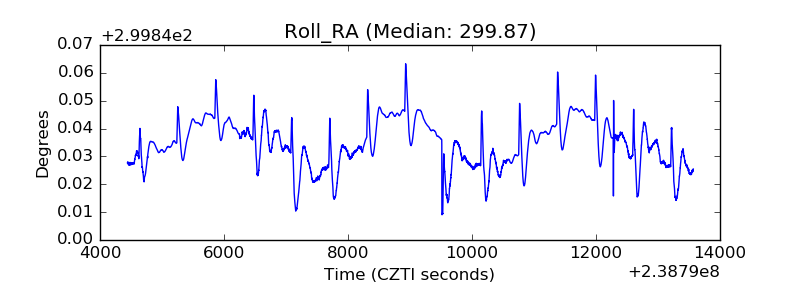 |
| Veto Counter | 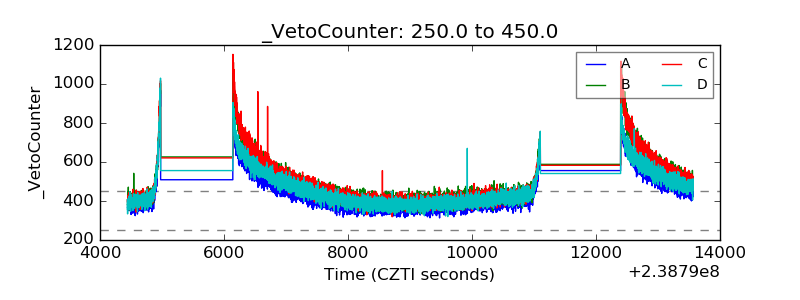 |