| Param | Original file | Final file |
|---|---|---|
| Filename | modeM0/AS1A03_117T06_9000001404_09886cztM0_level2.evt | modeM0/AS1A03_117T06_9000001404_09886cztM0_level2_quad_clean.evt |
| Size (bytes) | 405,624,960 | 86,872,320 |
| Size | 386.8 MB | 82.8 MB |
| Events in quadrant A | 2,952,076 | 553,087 |
| Events in quadrant B | 3,047,206 | 575,747 |
| Events in quadrant C | 2,904,424 | 551,795 |
| Events in quadrant D | 2,962,549 | 521,131 |
| Mode M9 | |||
|---|---|---|---|
| Quadrant | BADHDUFLAG | Total packets | Discarded packets |
| A | 0 | 21 | 0 |
| B | 0 | 21 | 0 |
| C | 0 | 21 | 0 |
| D | 0 | 22 | 0 |
| Mode M0 | |||
|---|---|---|---|
| Quadrant | BADHDUFLAG | Total packets | Discarded packets |
| A | 0 | 12948 | 203 |
| B | 0 | 13140 | 217 |
| C | 0 | 12900 | 198 |
| D | 0 | 13271 | 199 |
| Mode SS | |||
|---|---|---|---|
| Quadrant | BADHDUFLAG | Total packets | Discarded packets |
| A | 0 | 128 | 4 |
| B | 0 | 128 | 0 |
| C | 0 | 128 | 2 |
| D | 0 | 128 | 0 |
| Quadrant | Total seconds | Saturated seconds | Saturation percentage |
|---|---|---|---|
| A | 6136 | 39 | 0.635593% |
| B | 6137 | 53 | 0.863614% |
| C | 6138 | 11 | 0.179211% |
| D | 6139 | 28 | 0.456100% |
Noise dominated data is calculated using 1-second bins in cleaned event files. If a bin has >2000 counts, and if more than 50% of those come from <1% of pixels, then it is considered to be noise-dominated and hence unusable.
| Quadrant | # 1 sec bins | Bins with >0 counts | Bins with >2000 counts | High rate bins dominated by noise | Noise dominated (total time) | Noise dominated (detector-on time) | Marked lightcurve |
|---|---|---|---|---|---|---|---|
| A | 7561 | 6223 | 0 | 0 | 0.00% | 0.00% | 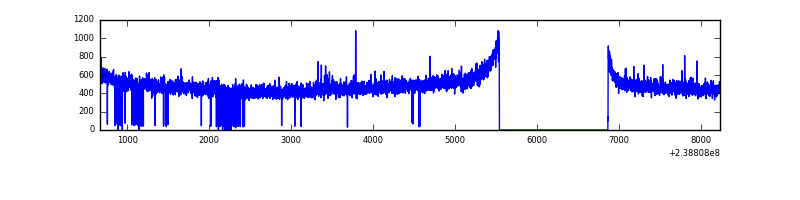 |
| B | 7561 | 6220 | 5 | 5 | 0.07% | 0.08% | 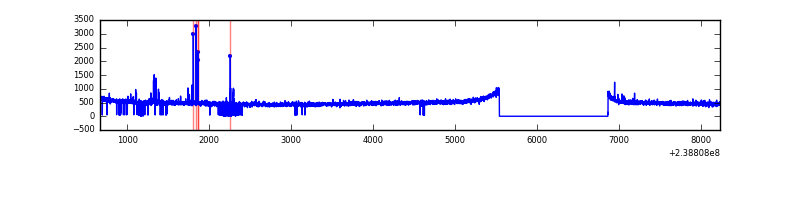 |
| C | 7561 | 6222 | 0 | 0 | 0.00% | 0.00% | 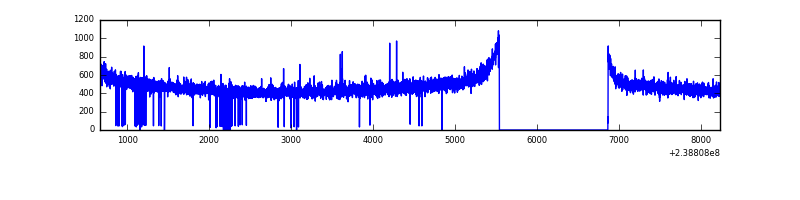 |
| D | 7561 | 6219 | 3 | 3 | 0.04% | 0.05% | 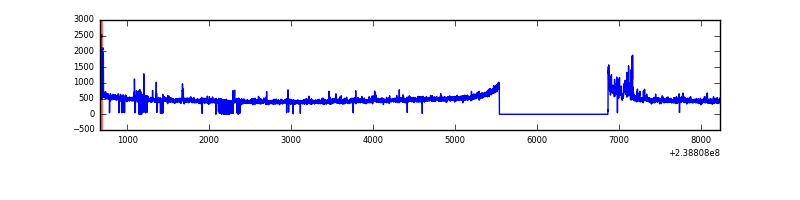 |
Top three noisy pixels from each quadrant. If the there are fewer than three noisy pixels in the level2.evt file, extra rows are filled as -1
| Pixel properties | Quadrant properties | ||||||
|---|---|---|---|---|---|---|---|
| Quadrant | DetID | PixID | Counts | Sigma | Mean | Median | Sigma |
| A | 13 | 251 | 16524 | 103.98 | 762 | 748 | 151.7 |
| A | 0 | 226 | 6978 | 41.06 | 762 | 748 | 151.7 |
| A | 12 | 194 | 5991 | 34.56 | 762 | 748 | 151.7 |
| B | 4 | 81 | 46714 | 313.76 | 769 | 752 | 146.5 |
| B | 12 | 111 | 17081 | 111.47 | 769 | 752 | 146.5 |
| B | 11 | 111 | 13972 | 90.24 | 769 | 752 | 146.5 |
| C | 14 | 67 | 12755 | 70.17 | 741 | 746 | 171.1 |
| C | 13 | 61 | 5388 | 27.12 | 741 | 746 | 171.1 |
| C | 9 | 221 | 4622 | 22.65 | 741 | 746 | 171.1 |
| D | 1 | 52 | 96289 | 507.33 | 725 | 711 | 188.4 |
| D | 2 | 16 | 27988 | 144.79 | 725 | 711 | 188.4 |
| D | 8 | 195 | 23678 | 121.91 | 725 | 711 | 188.4 |
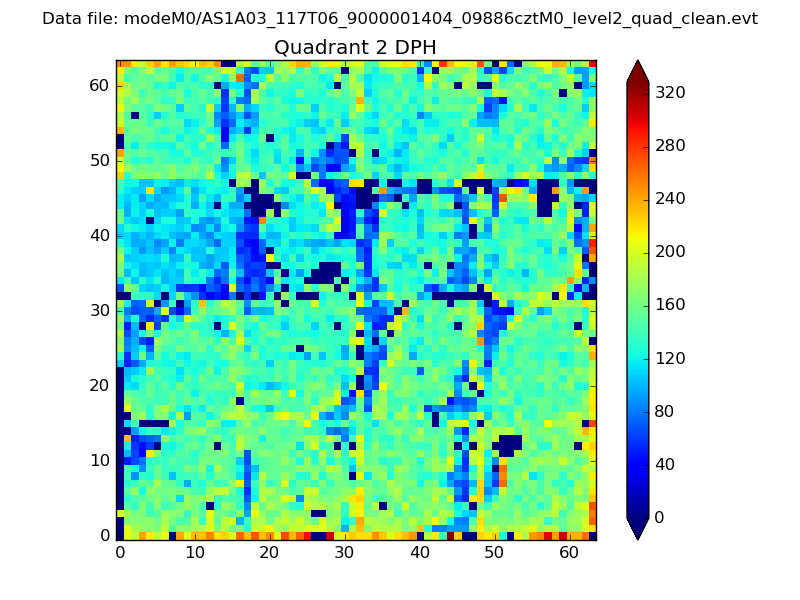
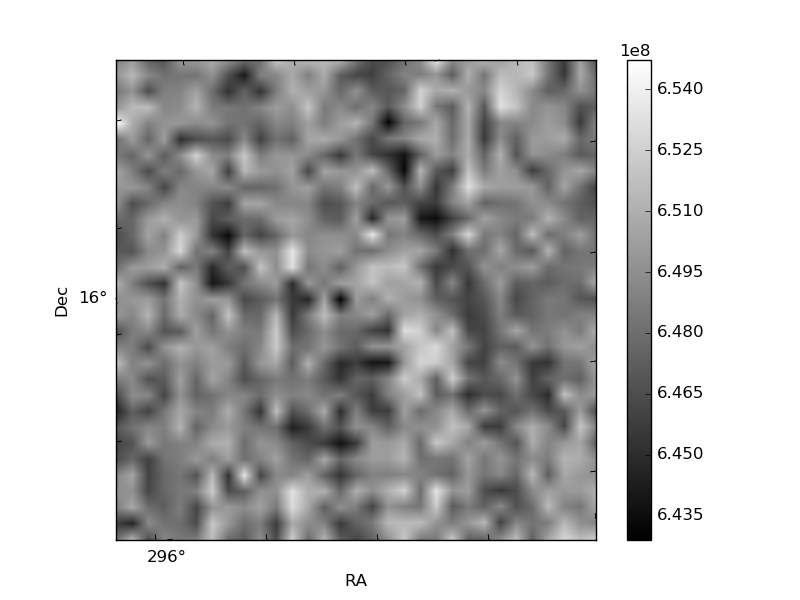
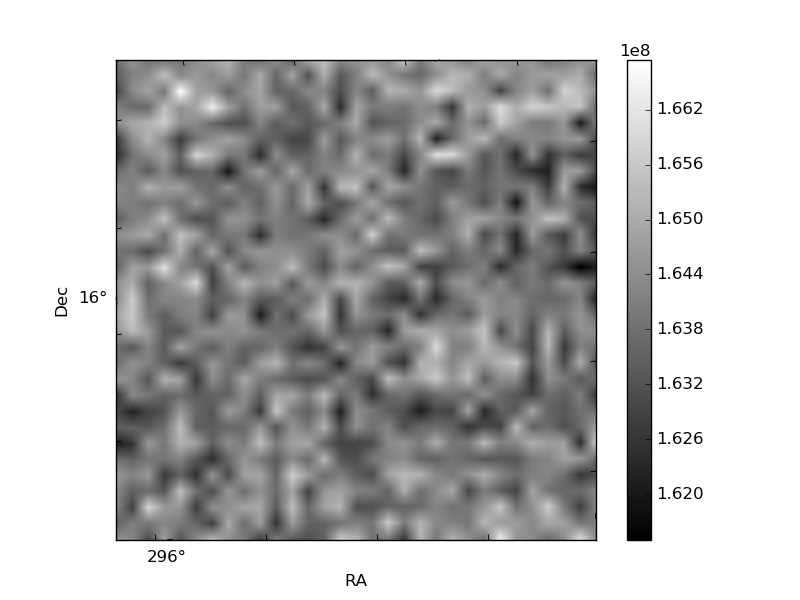
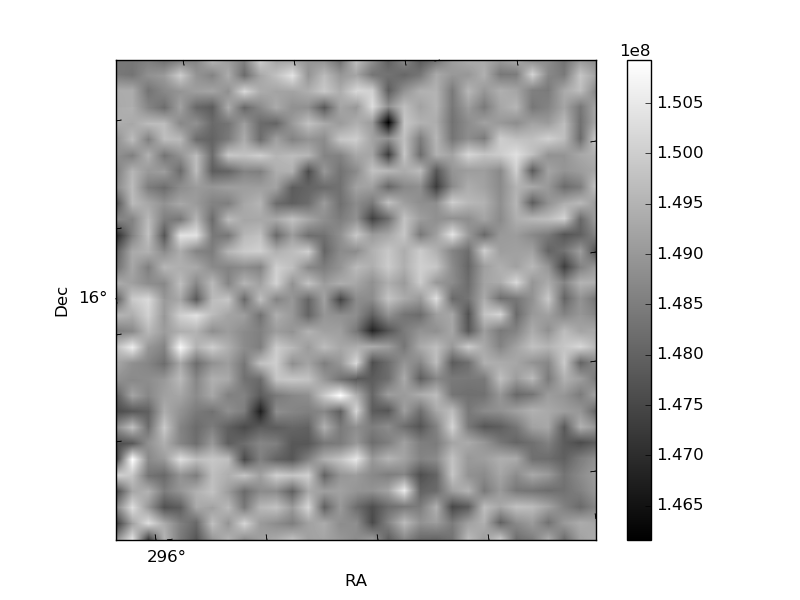
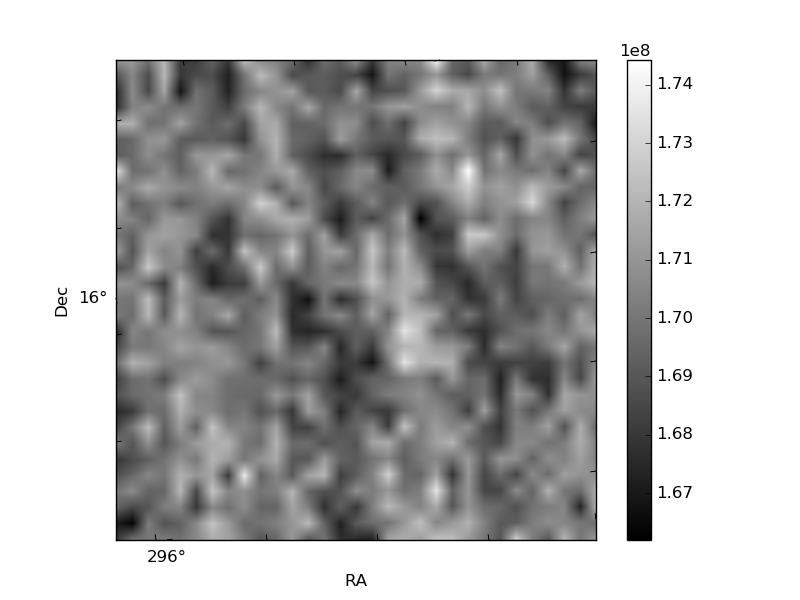
Histogram calculated using DETX and DETY for each event in the final _common_clean file
| Quadrant A | 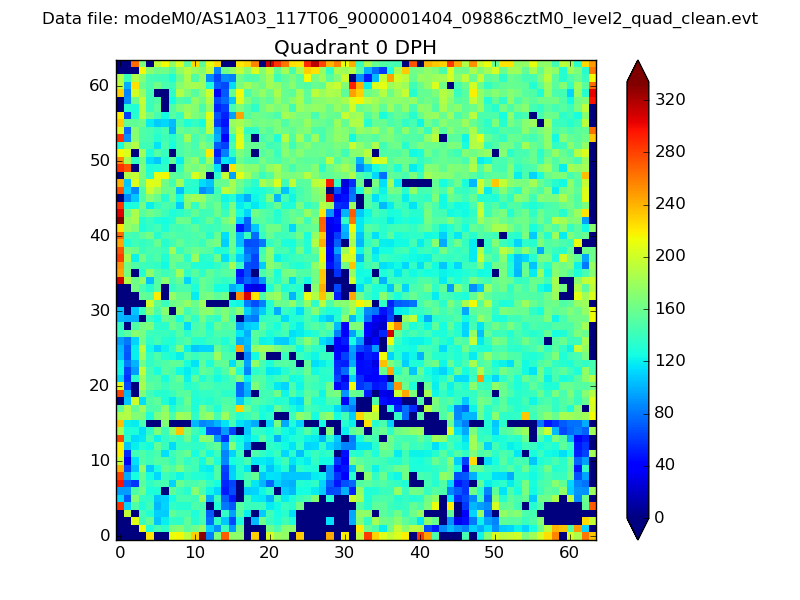 |
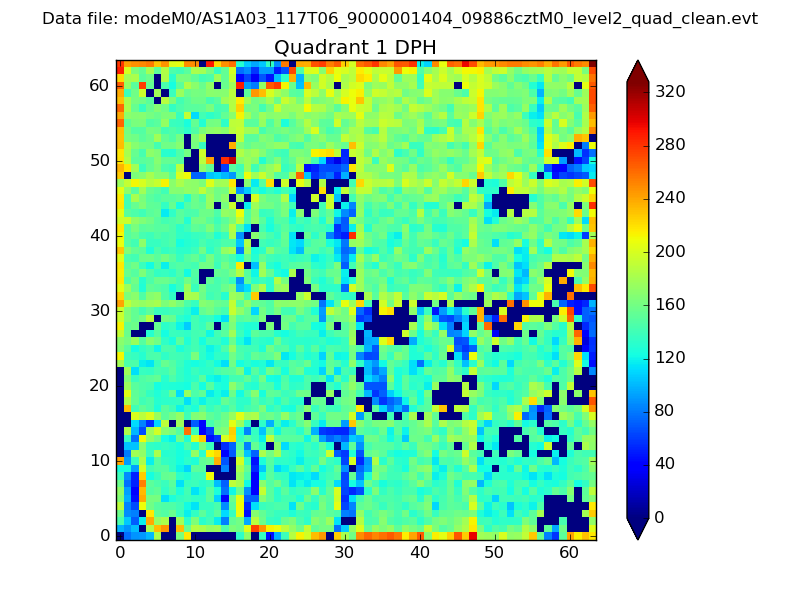 |
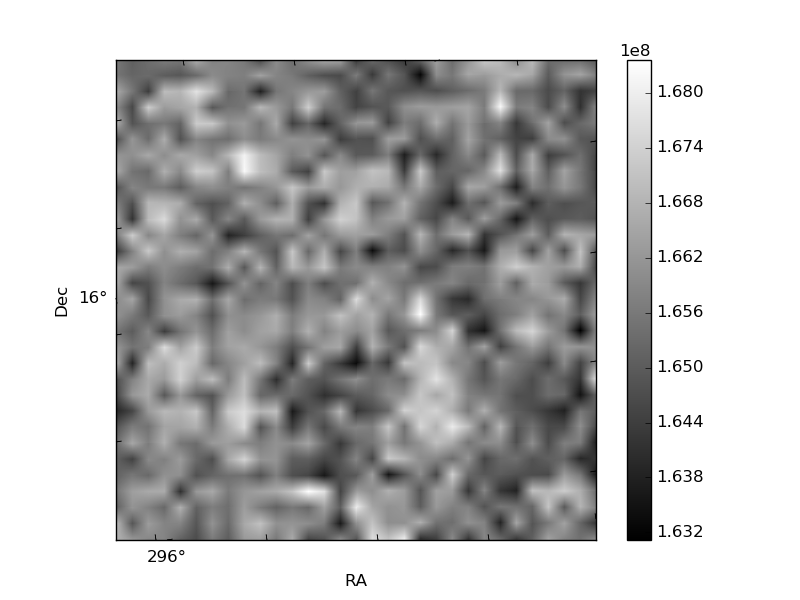
Quadrant B |
|---|---|---|---|
| Quadrant D | 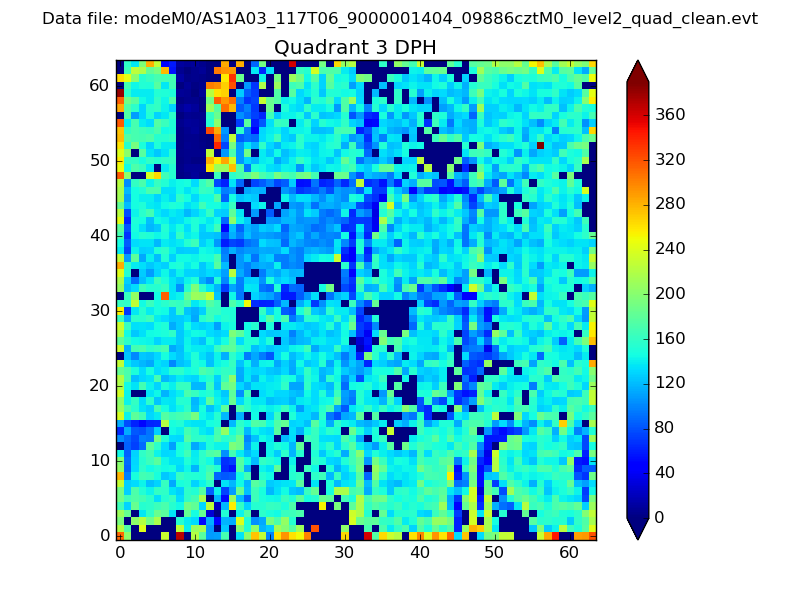 |
 |
Quadrant C |
| Plot type | Count rate plots | Images |
|---|---|---|
| Comparison with Poisson distribution Blue bars denote a histogram of data divided into 1 sec bins. Red curve is a Poisson curve with rate = median count rate of data. |
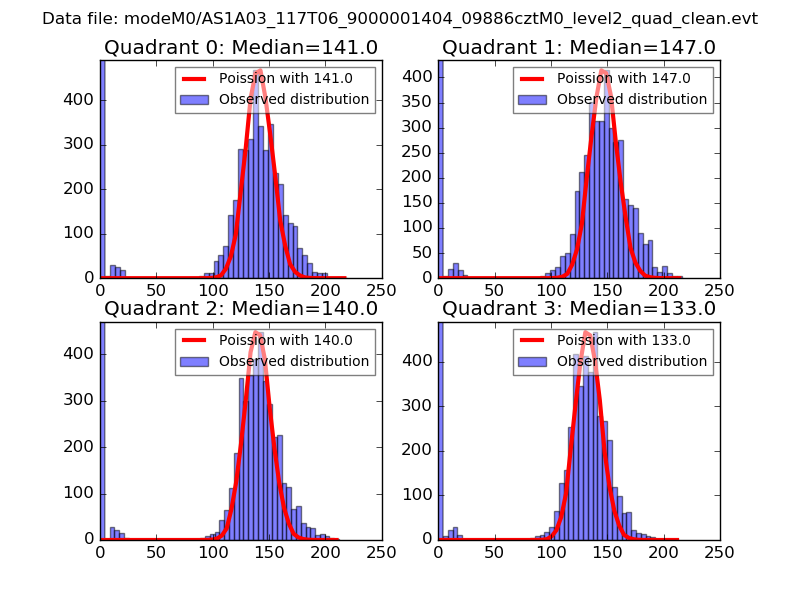 |
 |
| Quadrant-wise count rates Data is divided into 100 sec bins |
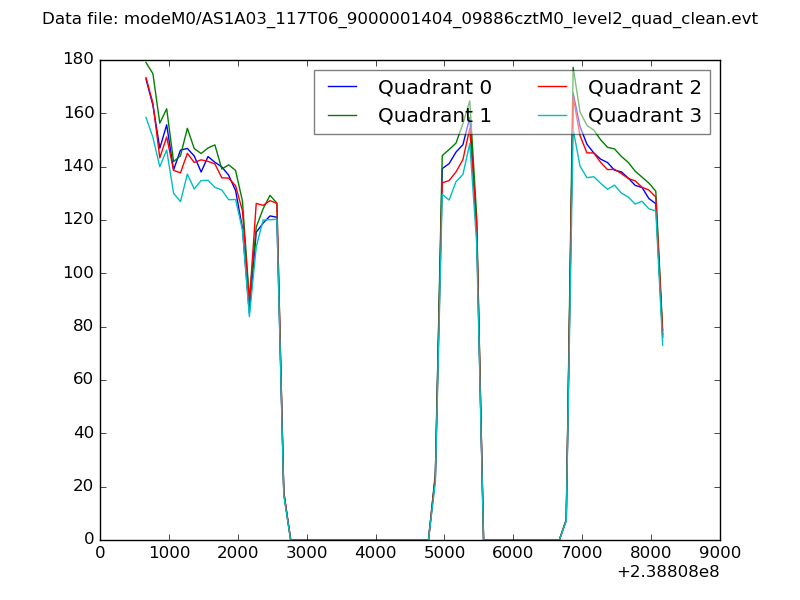 |
|
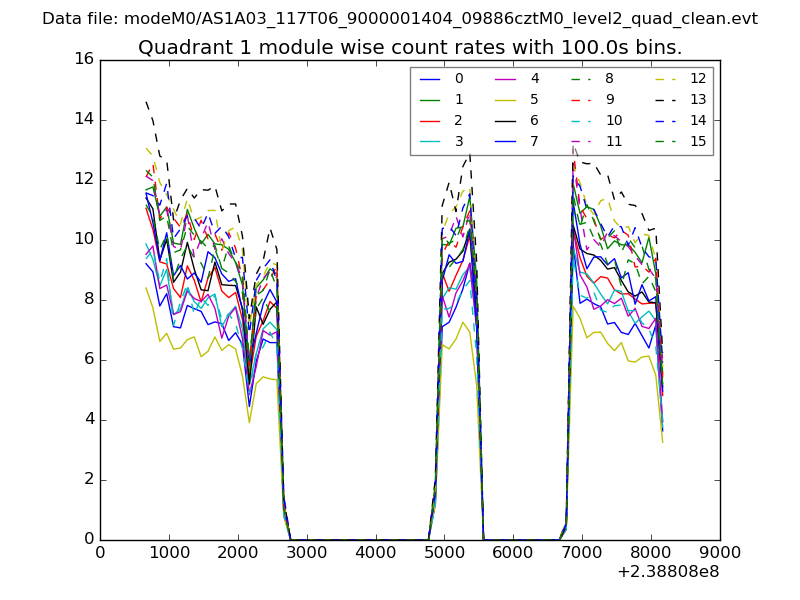
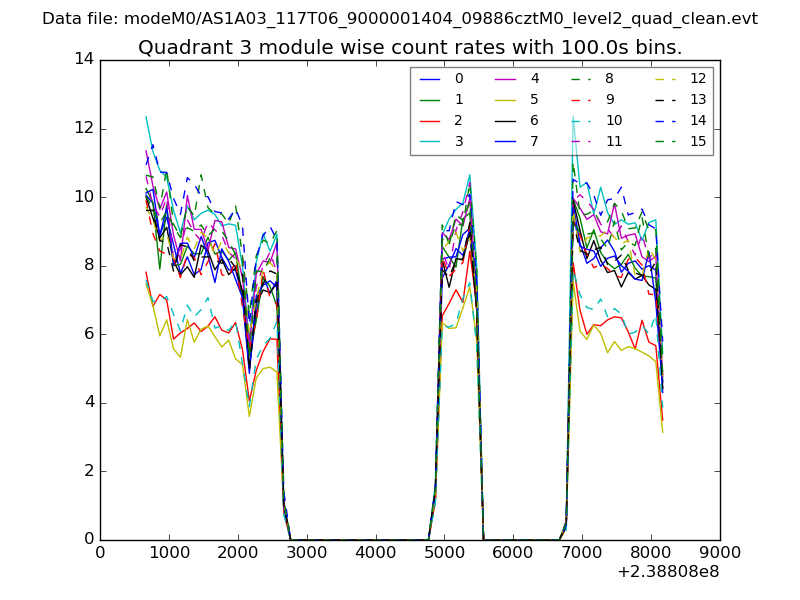
| Module-wise count rates for Quadrant A Data is divided into 100 sec bins |
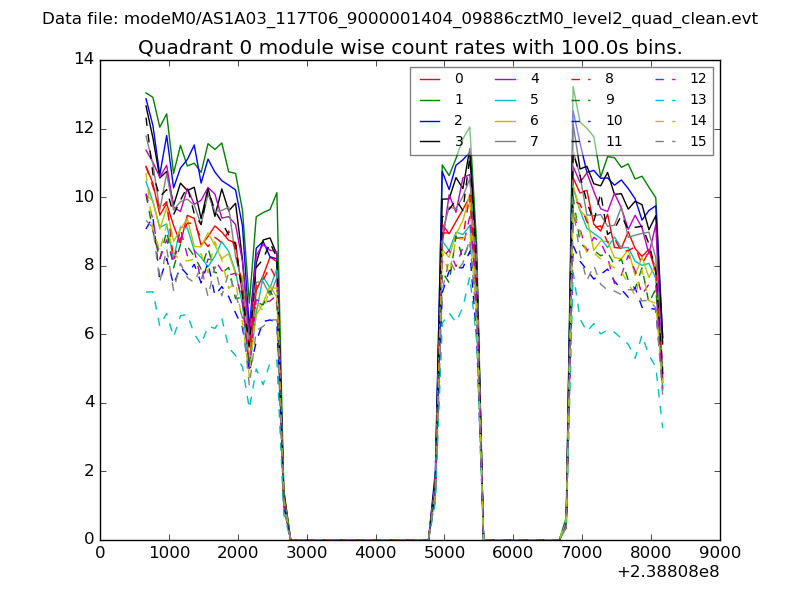 |
 |
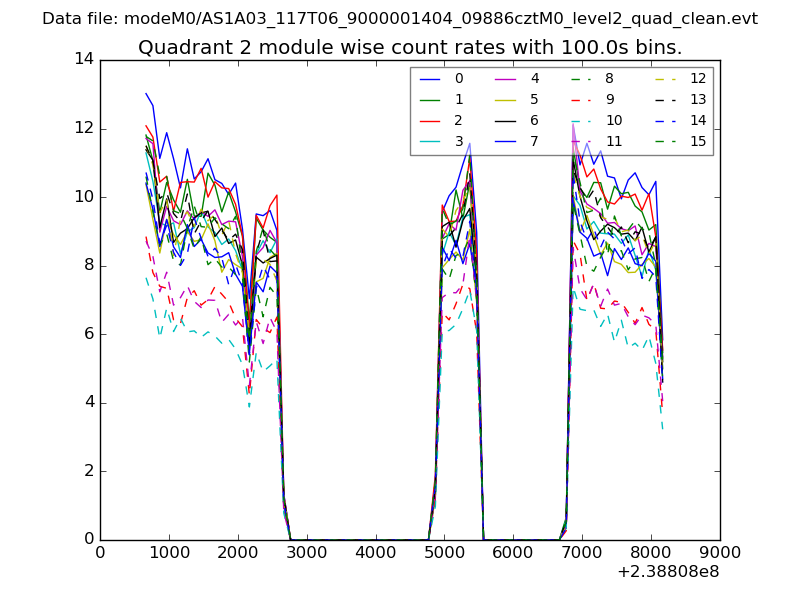
| Module-wise count rates for Quadrant B Data is divided into 100 sec bins |
 |
 |
| Module-wise count rates for Quadrant C Data is divided into 100 sec bins |
 |
 |
| Module-wise count rates for Quadrant D Data is divided into 100 sec bins |
 |
 |
| Parameter | Plot |
|---|---|
| CZT HV Monitor | 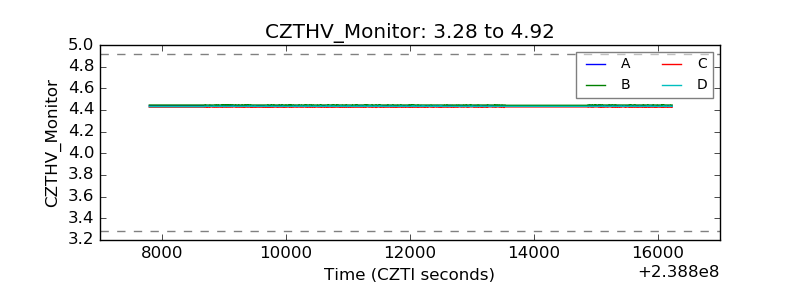 |
| D_VDD | 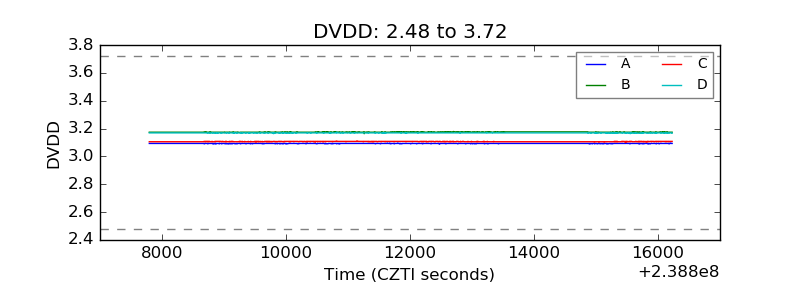 |
| Temperature 1 | 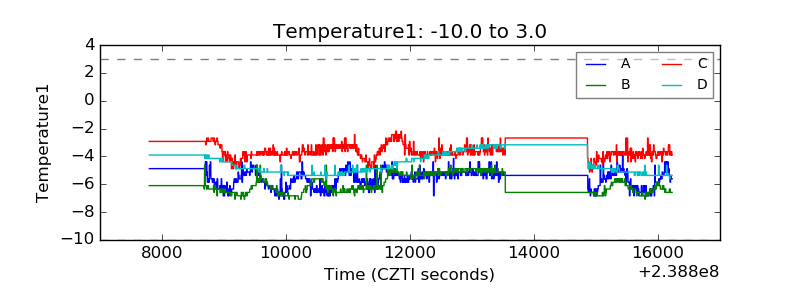 |
| Veto HV Monitor | 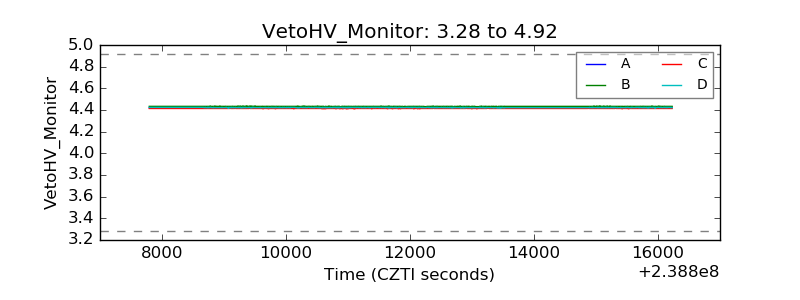 |
| Veto LLD | 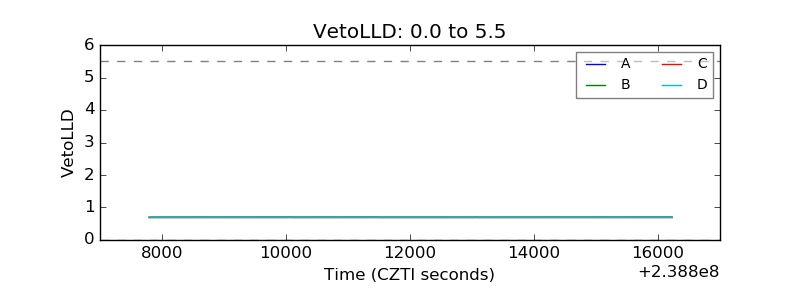 |
| Alpha Counter | 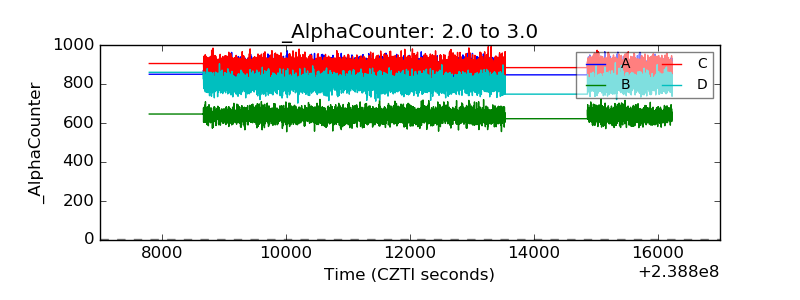 |
| _CPM_Rate | 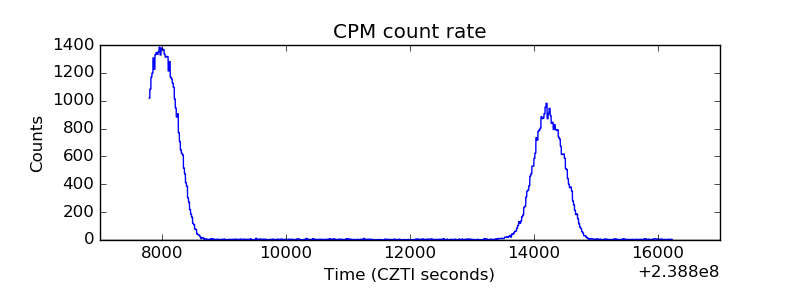 |
| CZT Counter | 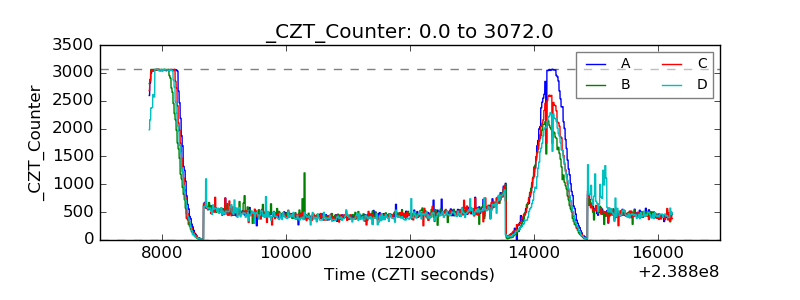 |
| +2.5 Volts monitor |  |
| +5 Volts monitor |  |
| _ROLL_ROT | 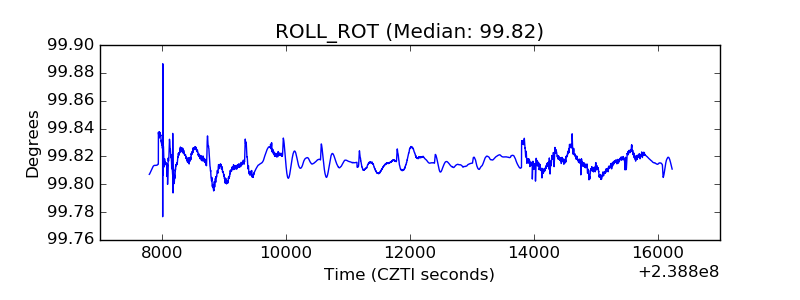 |
| _Roll_DEC | 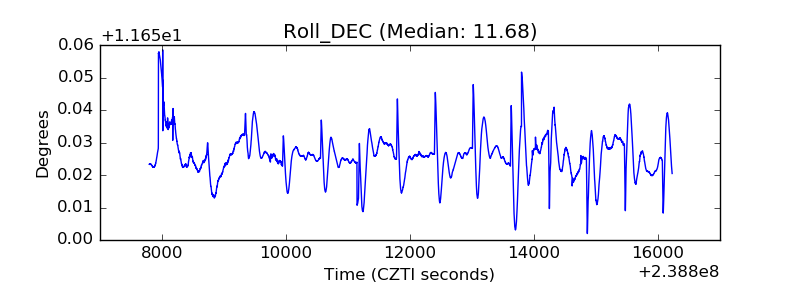 |
| _Roll_RA |  |
| Veto Counter | 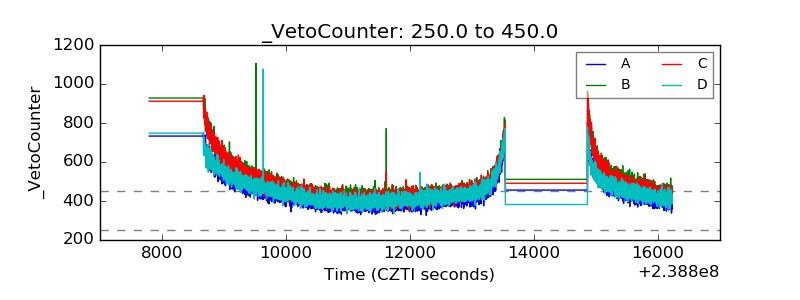 |