| Param | Original file | Final file |
|---|---|---|
| Filename | modeM0/AS1A03_117T06_9000001404_09887cztM0_level2.evt | modeM0/AS1A03_117T06_9000001404_09887cztM0_level2_quad_clean.evt |
| Size (bytes) | 369,472,320 | 78,531,840 |
| Size | 352.4 MB | 74.9 MB |
| Events in quadrant A | 2,711,912 | 500,900 |
| Events in quadrant B | 2,723,060 | 518,731 |
| Events in quadrant C | 2,636,552 | 495,047 |
| Events in quadrant D | 2,736,293 | 472,574 |
| Mode M9 | |||
|---|---|---|---|
| Quadrant | BADHDUFLAG | Total packets | Discarded packets |
| A | 0 | 25 | 0 |
| B | 0 | 25 | 0 |
| C | 0 | 25 | 1 |
| D | 0 | 25 | 0 |
| Mode M0 | |||
|---|---|---|---|
| Quadrant | BADHDUFLAG | Total packets | Discarded packets |
| A | 0 | 13789 | 1957 |
| B | 0 | 13836 | 2113 |
| C | 0 | 13770 | 2064 |
| D | 0 | 14236 | 2169 |
| Mode SS | |||
|---|---|---|---|
| Quadrant | BADHDUFLAG | Total packets | Discarded packets |
| A | 0 | 136 | 10 |
| B | 0 | 135 | 9 |
| C | 0 | 136 | 24 |
| D | 0 | 136 | 16 |
| Quadrant | Total seconds | Saturated seconds | Saturation percentage |
|---|---|---|---|
| A | 5608 | 54 | 0.962910% |
| B | 5537 | 74 | 1.336464% |
| C | 5554 | 14 | 0.252071% |
| D | 5532 | 30 | 0.542299% |
Noise dominated data is calculated using 1-second bins in cleaned event files. If a bin has >2000 counts, and if more than 50% of those come from <1% of pixels, then it is considered to be noise-dominated and hence unusable.
| Quadrant | # 1 sec bins | Bins with >0 counts | Bins with >2000 counts | High rate bins dominated by noise | Noise dominated (total time) | Noise dominated (detector-on time) | Marked lightcurve |
|---|---|---|---|---|---|---|---|
| A | 9088 | 6265 | 0 | 0 | 0.00% | 0.00% | 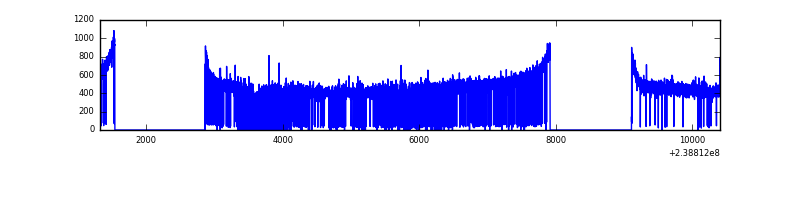 |
| B | 9088 | 6238 | 0 | 0 | 0.00% | 0.00% | 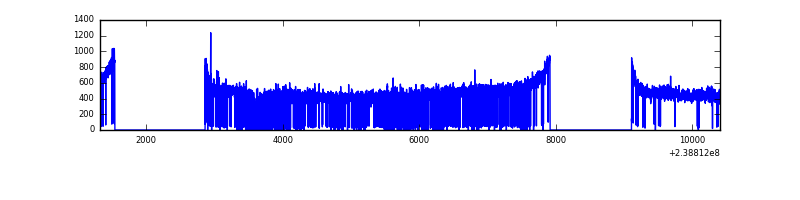 |
| C | 9088 | 6234 | 0 | 0 | 0.00% | 0.00% |  |
| D | 9088 | 6218 | 3 | 3 | 0.03% | 0.05% | 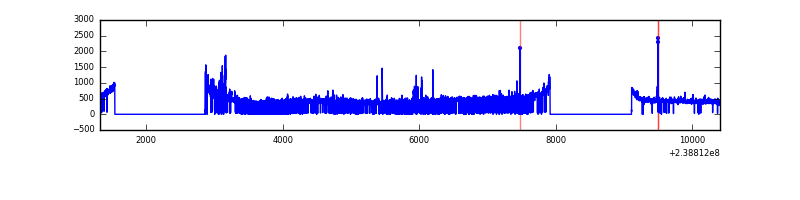 |
Top three noisy pixels from each quadrant. If the there are fewer than three noisy pixels in the level2.evt file, extra rows are filled as -1
| Pixel properties | Quadrant properties | ||||||
|---|---|---|---|---|---|---|---|
| Quadrant | DetID | PixID | Counts | Sigma | Mean | Median | Sigma |
| A | 13 | 251 | 11539 | 75.5 | 702 | 688 | 143.7 |
| A | 0 | 226 | 6445 | 40.06 | 702 | 688 | 143.7 |
| A | 12 | 194 | 5446 | 33.11 | 702 | 688 | 143.7 |
| B | 12 | 111 | 15950 | 112.95 | 698 | 682 | 135.2 |
| B | 11 | 111 | 13069 | 91.63 | 698 | 682 | 135.2 |
| B | 14 | 111 | 10965 | 76.07 | 698 | 682 | 135.2 |
| C | 13 | 61 | 5063 | 27.69 | 675 | 680 | 158.3 |
| C | 14 | 67 | 3937 | 20.58 | 675 | 680 | 158.3 |
| C | 10 | 22 | 1807 | 7.12 | 675 | 680 | 158.3 |
| D | 1 | 52 | 85396 | 489.81 | 660 | 647 | 173.0 |
| D | 2 | 16 | 49266 | 280.99 | 660 | 647 | 173.0 |
| D | 2 | 234 | 20913 | 117.13 | 660 | 647 | 173.0 |
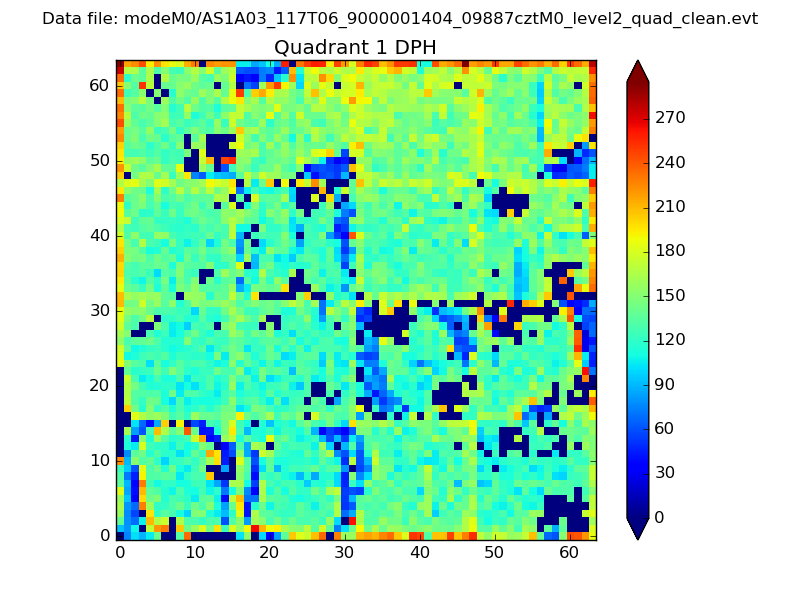
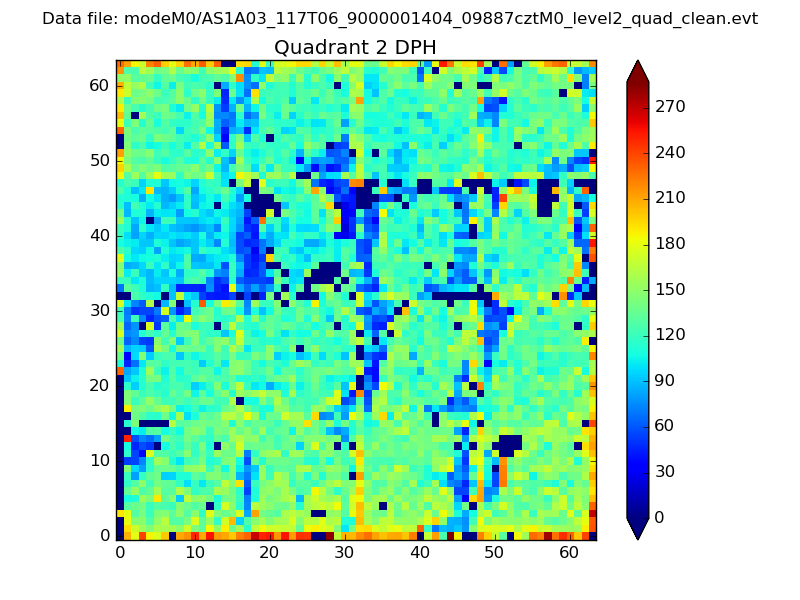
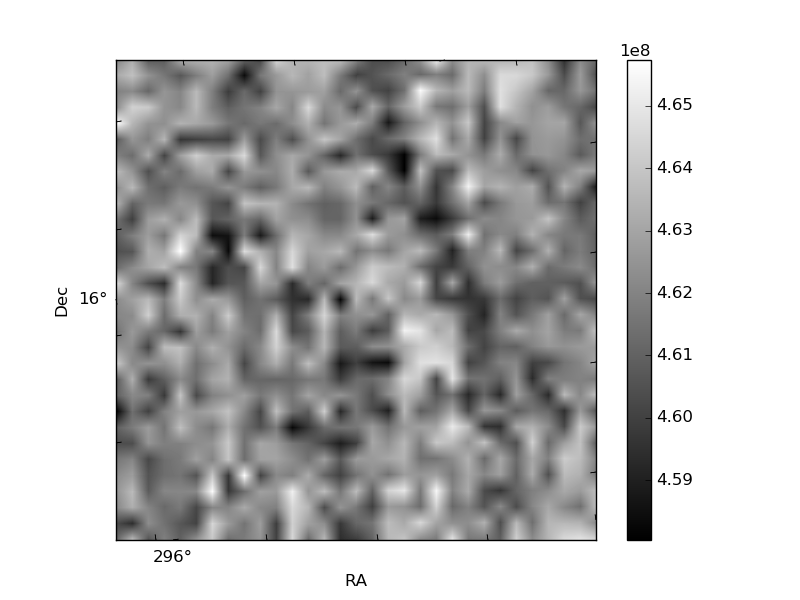
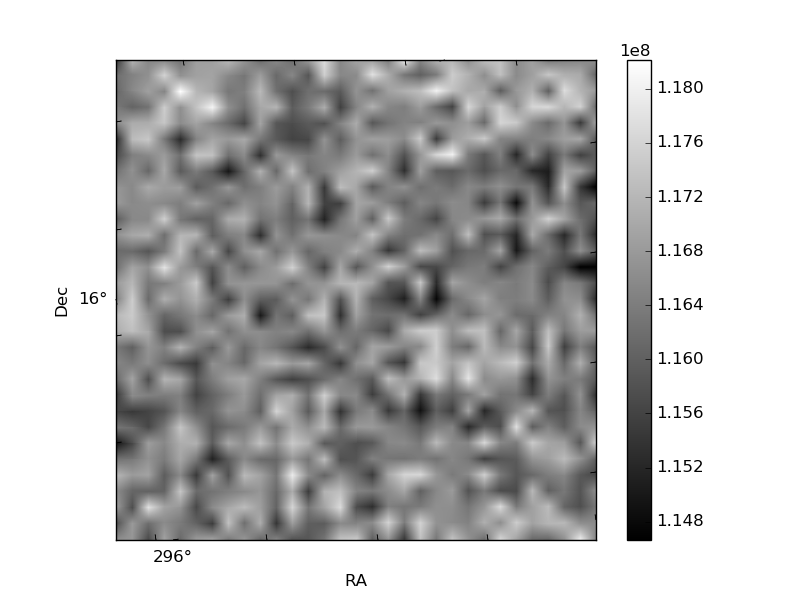
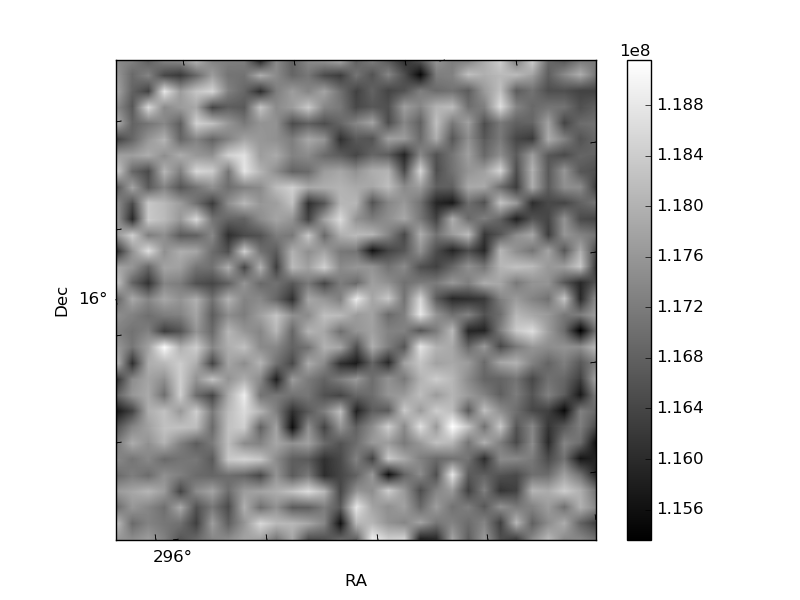
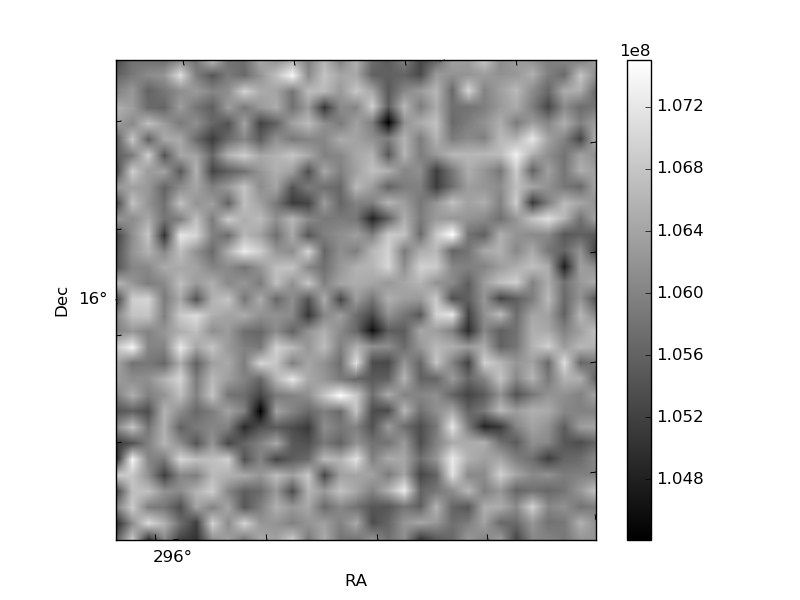
Histogram calculated using DETX and DETY for each event in the final _common_clean file
| Quadrant A | 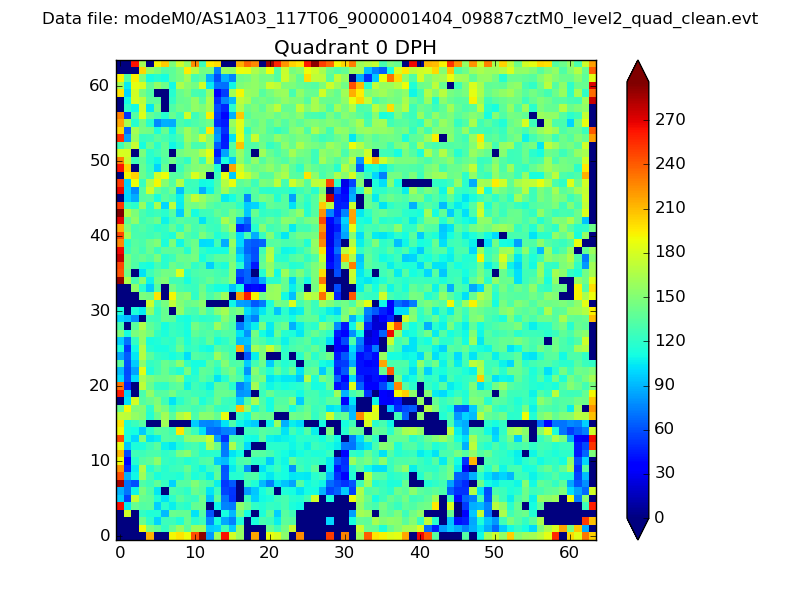 |
 |
Quadrant B |
|---|---|---|---|
| Quadrant D | 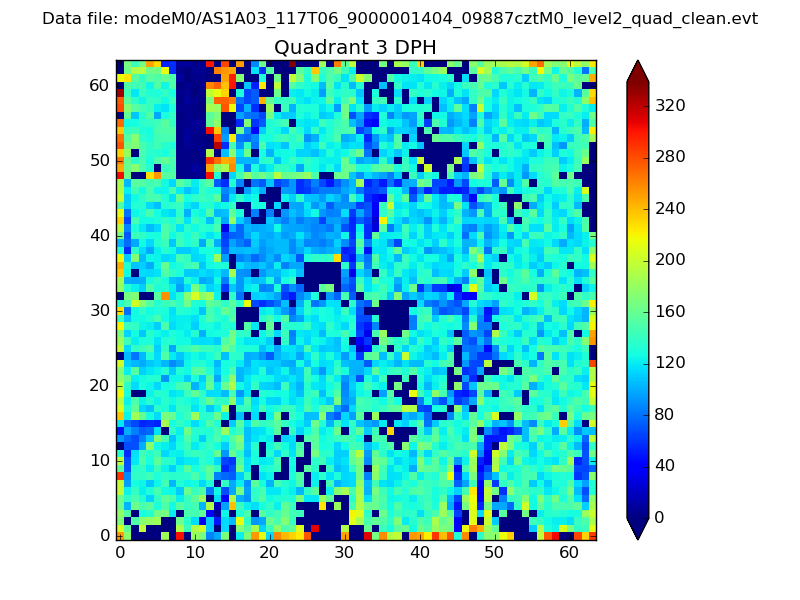 |
 |
Quadrant C |
| Plot type | Count rate plots | Images |
|---|---|---|
| Comparison with Poisson distribution Blue bars denote a histogram of data divided into 1 sec bins. Red curve is a Poisson curve with rate = median count rate of data. |
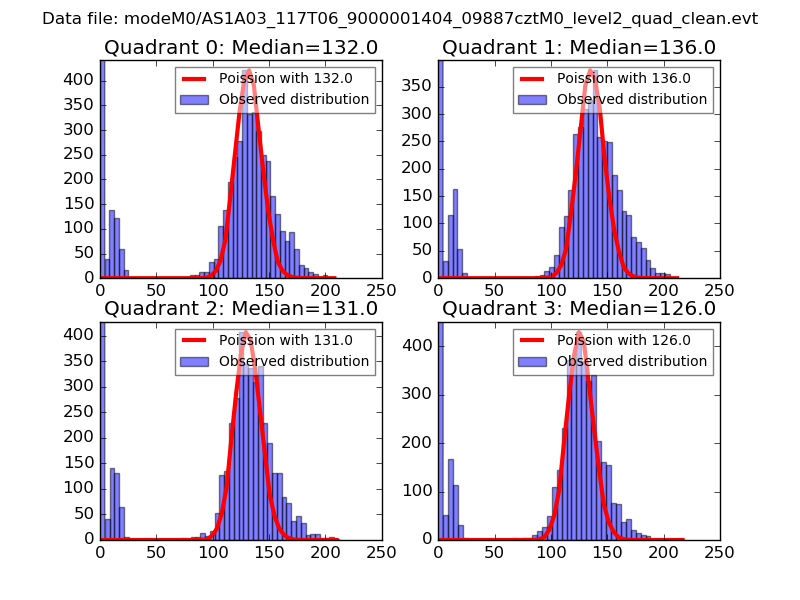 |
 |
| Quadrant-wise count rates Data is divided into 100 sec bins |
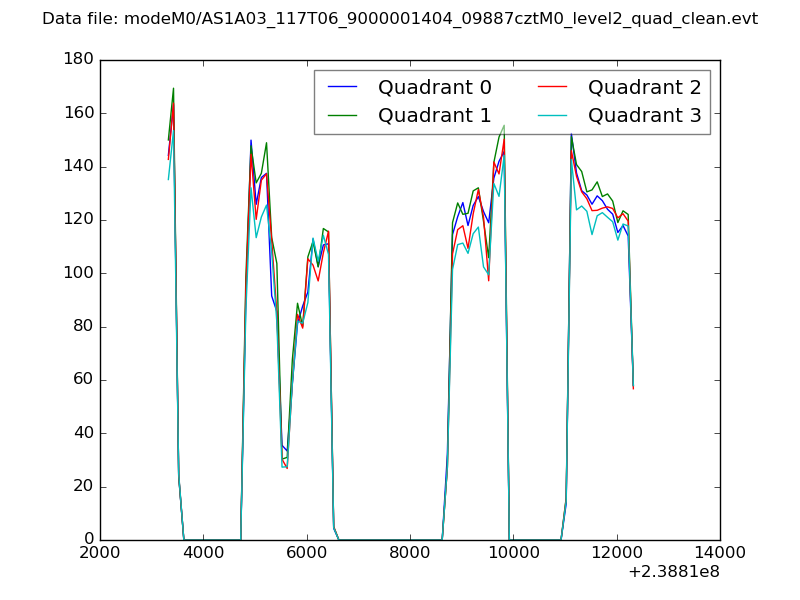 |
|
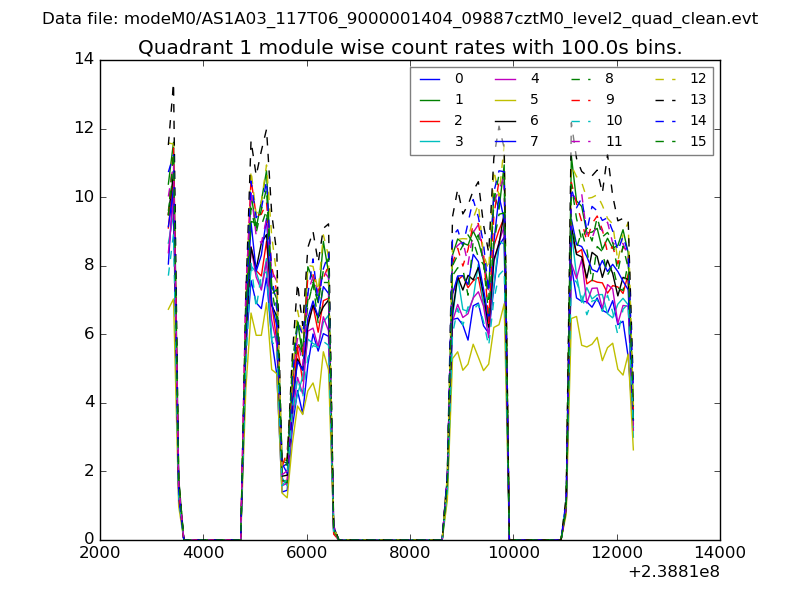
| Module-wise count rates for Quadrant A Data is divided into 100 sec bins |
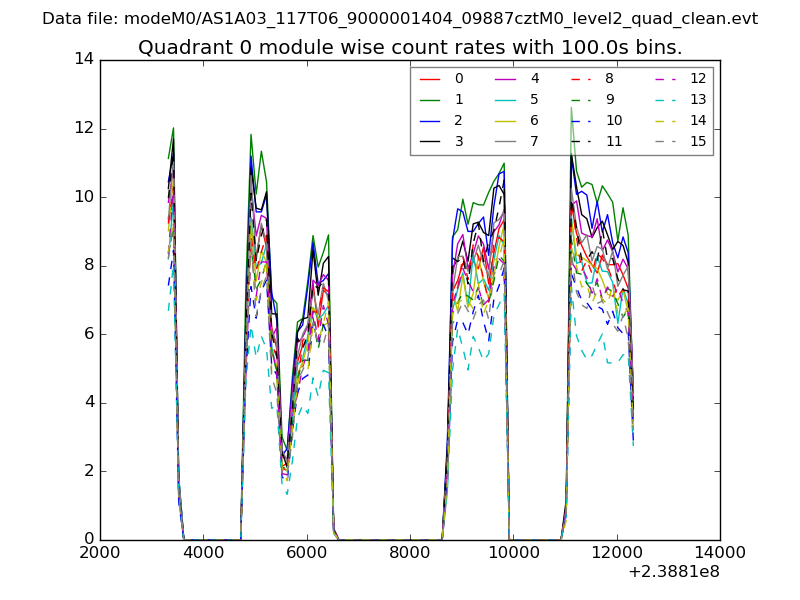 |
 |
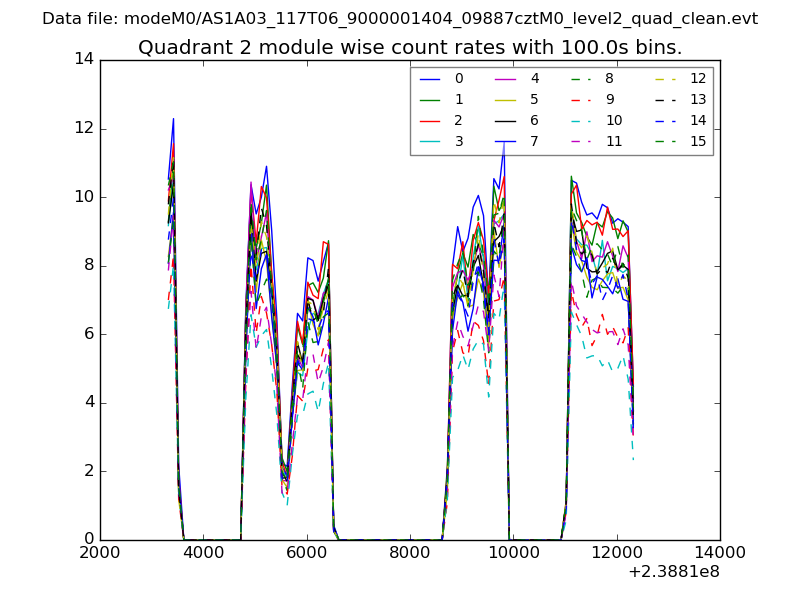
| Module-wise count rates for Quadrant B Data is divided into 100 sec bins |
 |
 |
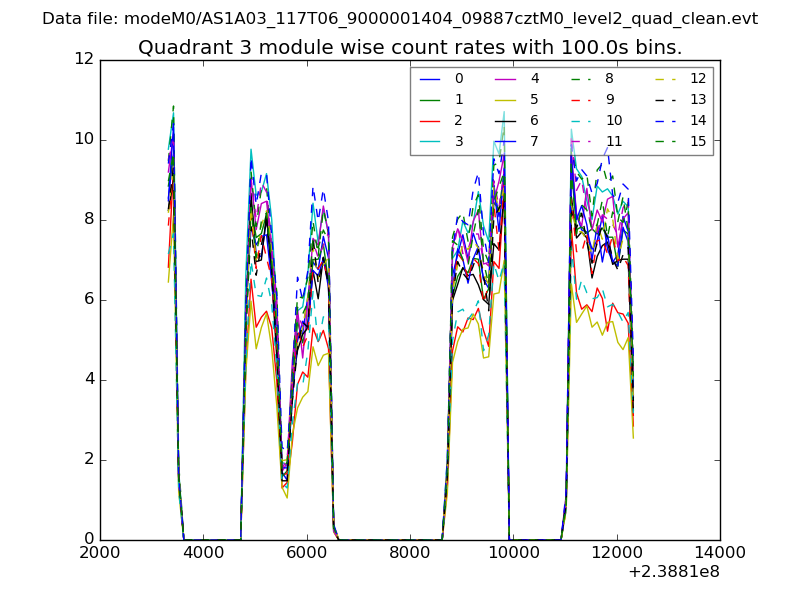
| Module-wise count rates for Quadrant C Data is divided into 100 sec bins |
 |
 |
| Module-wise count rates for Quadrant D Data is divided into 100 sec bins |
 |
 |
| Parameter | Plot |
|---|---|
| CZT HV Monitor | 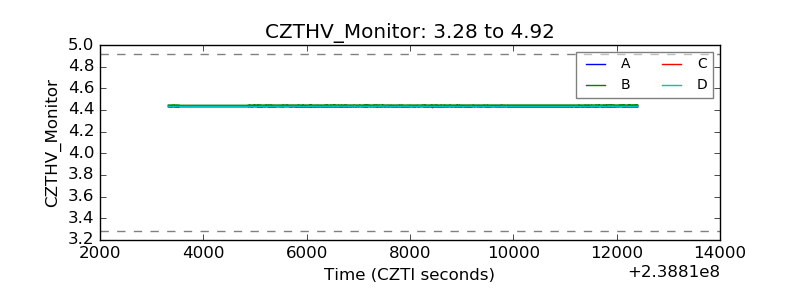 |
| D_VDD |  |
| Temperature 1 | 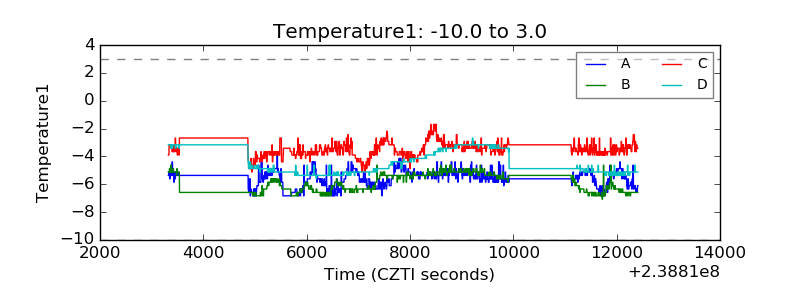 |
| Veto HV Monitor | 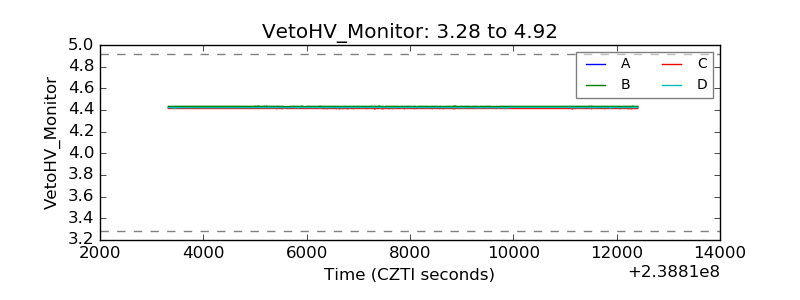 |
| Veto LLD | 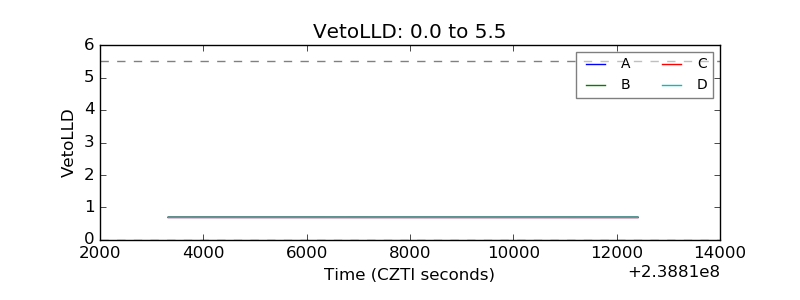 |
| Alpha Counter |  |
| _CPM_Rate | 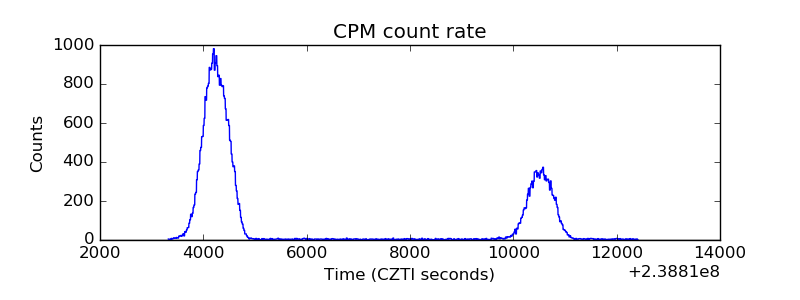 |
| CZT Counter |  |
| +2.5 Volts monitor |  |
| +5 Volts monitor |  |
| _ROLL_ROT | 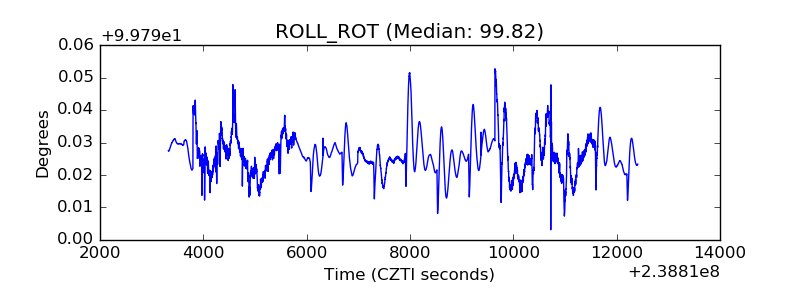 |
| _Roll_DEC | 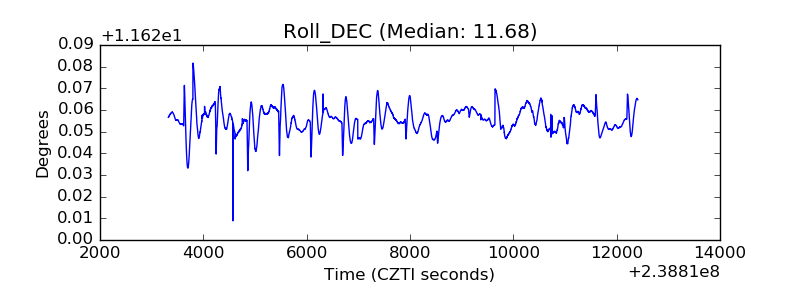 |
| _Roll_RA | 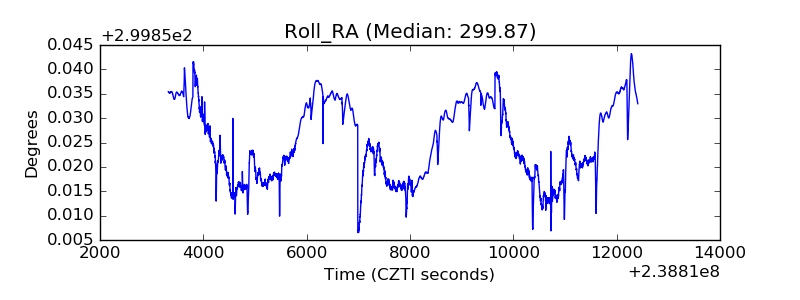 |
| Veto Counter | 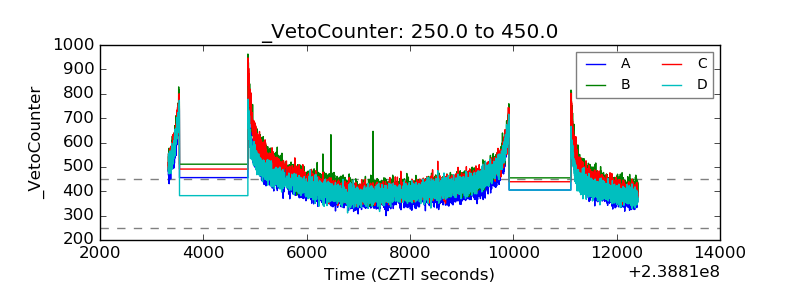 |