| Param | Original file | Final file |
|---|---|---|
| Filename | modeM0/AS1A03_117T06_9000001404_09891cztM0_level2.evt | modeM0/AS1A03_117T06_9000001404_09891cztM0_level2_quad_clean.evt |
| Size (bytes) | 257,040,000 | 35,982,720 |
| Size | 245.1 MB | 34.3 MB |
| Events in quadrant A | 1,898,278 | 202,967 |
| Events in quadrant B | 1,908,663 | 210,613 |
| Events in quadrant C | 1,867,009 | 205,243 |
| Events in quadrant D | 1,847,066 | 198,601 |
| Mode M0 | |||
|---|---|---|---|
| Quadrant | BADHDUFLAG | Total packets | Discarded packets |
| A | 0 | 8528 | 206 |
| B | 0 | 8479 | 161 |
| C | 0 | 8564 | 203 |
| D | 0 | 8555 | 207 |
| Mode SS | |||
|---|---|---|---|
| Quadrant | BADHDUFLAG | Total packets | Discarded packets |
| A | 0 | 80 | 0 |
| B | 0 | 80 | 0 |
| C | 0 | 80 | 2 |
| D | 0 | 80 | 0 |
| Quadrant | Total seconds | Saturated seconds | Saturation percentage |
|---|---|---|---|
| A | 3825 | 244 | 6.379085% |
| B | 3848 | 247 | 6.418919% |
| C | 3830 | 151 | 3.942559% |
| D | 3824 | 169 | 4.419456% |
Noise dominated data is calculated using 1-second bins in cleaned event files. If a bin has >2000 counts, and if more than 50% of those come from <1% of pixels, then it is considered to be noise-dominated and hence unusable.
| Quadrant | # 1 sec bins | Bins with >0 counts | Bins with >2000 counts | High rate bins dominated by noise | Noise dominated (total time) | Noise dominated (detector-on time) | Marked lightcurve |
|---|---|---|---|---|---|---|---|
| A | 3927 | 3919 | 0 | 0 | 0.00% | 0.00% | 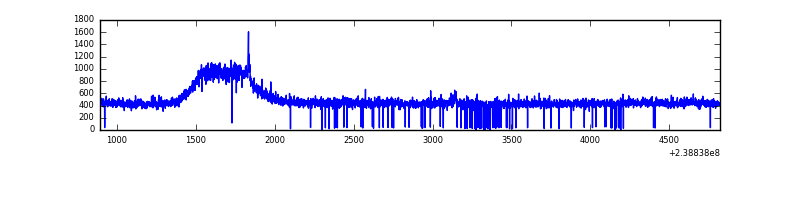 |
| B | 3927 | 3915 | 0 | 0 | 0.00% | 0.00% | 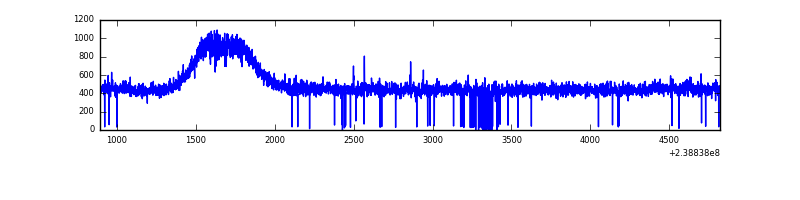 |
| C | 3927 | 3917 | 0 | 0 | 0.00% | 0.00% | 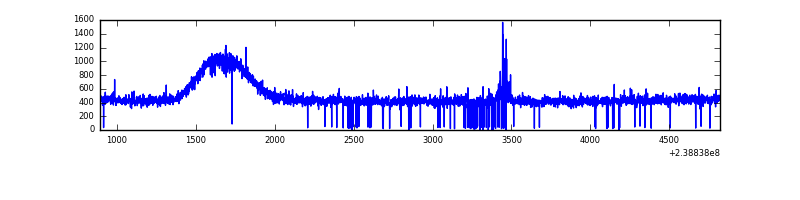 |
| D | 3927 | 3912 | 0 | 0 | 0.00% | 0.00% | 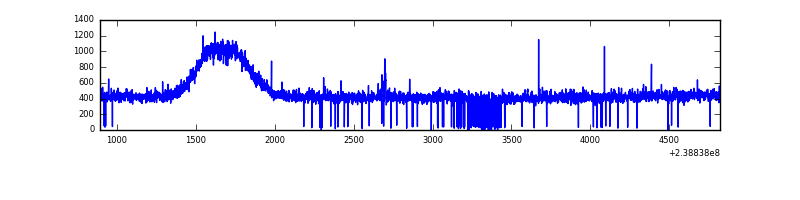 |
Top three noisy pixels from each quadrant. If the there are fewer than three noisy pixels in the level2.evt file, extra rows are filled as -1
| Pixel properties | Quadrant properties | ||||||
|---|---|---|---|---|---|---|---|
| Quadrant | DetID | PixID | Counts | Sigma | Mean | Median | Sigma |
| A | 13 | 251 | 13785 | 129.74 | 488 | 476 | 102.6 |
| A | 15 | 239 | 6384 | 57.59 | 488 | 476 | 102.6 |
| A | 0 | 226 | 4368 | 37.94 | 488 | 476 | 102.6 |
| B | 12 | 111 | 11961 | 116.06 | 488 | 475 | 99.0 |
| B | 11 | 111 | 10161 | 97.87 | 488 | 475 | 99.0 |
| B | 14 | 111 | 8503 | 81.12 | 488 | 475 | 99.0 |
| C | 4 | 254 | 20192 | 172.35 | 472 | 474 | 114.4 |
| C | 13 | 61 | 3614 | 27.45 | 472 | 474 | 114.4 |
| C | 14 | 67 | 2180 | 14.91 | 472 | 474 | 114.4 |
| D | 8 | 195 | 35004 | 280.2 | 469 | 458 | 123.3 |
| D | 2 | 16 | 18168 | 143.65 | 469 | 458 | 123.3 |
| D | 2 | 234 | 14969 | 117.7 | 469 | 458 | 123.3 |
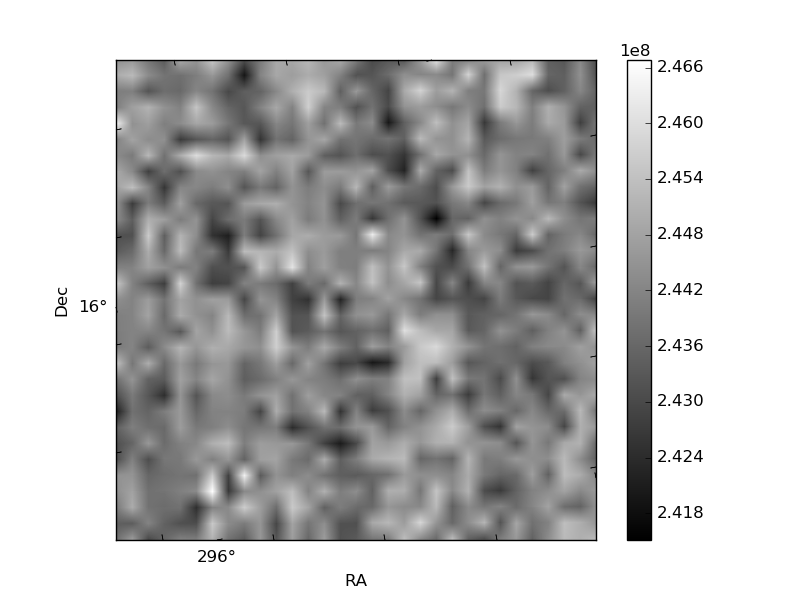
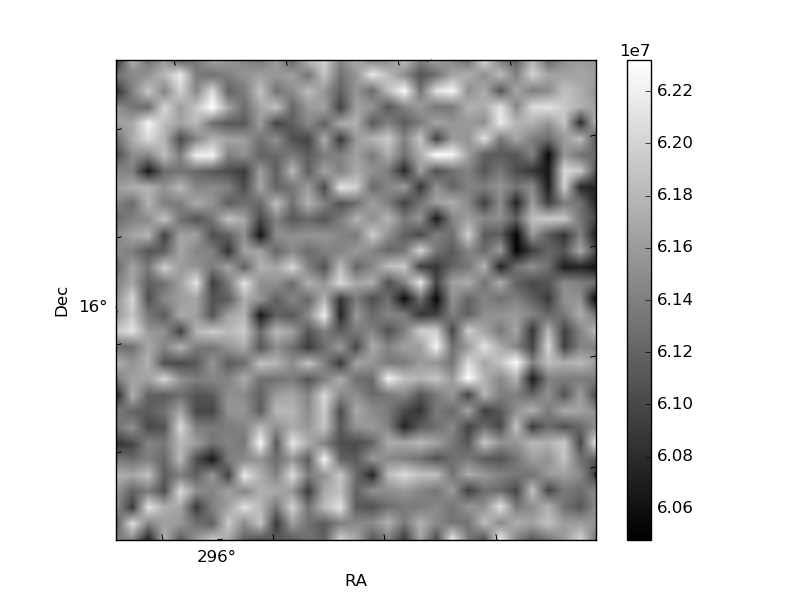
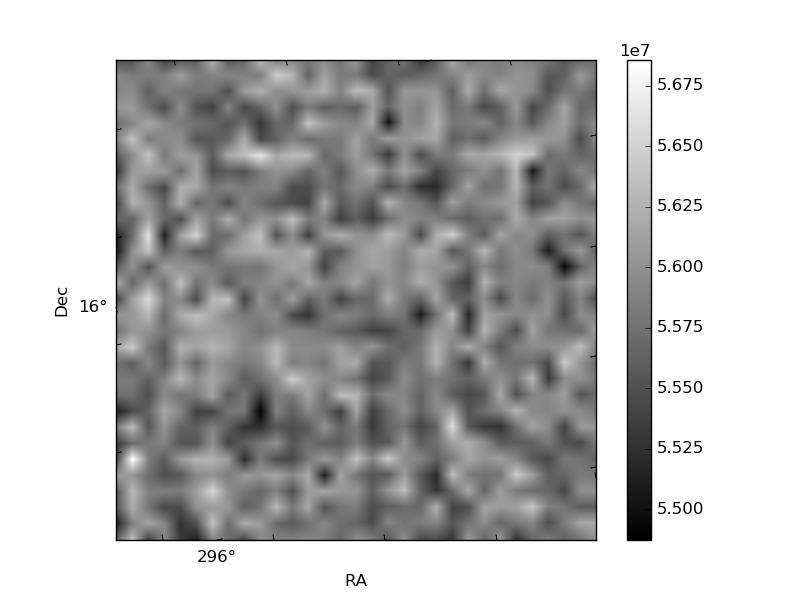
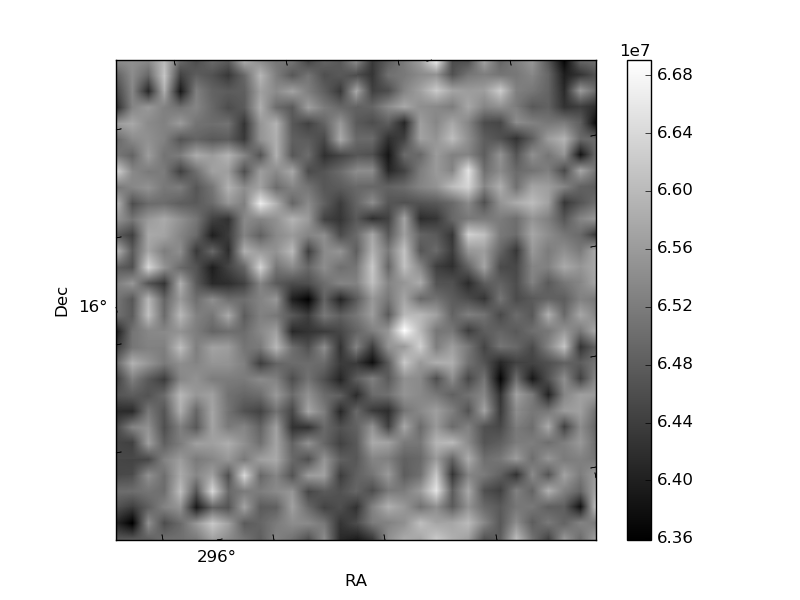
Histogram calculated using DETX and DETY for each event in the final _common_clean file
| Quadrant A | 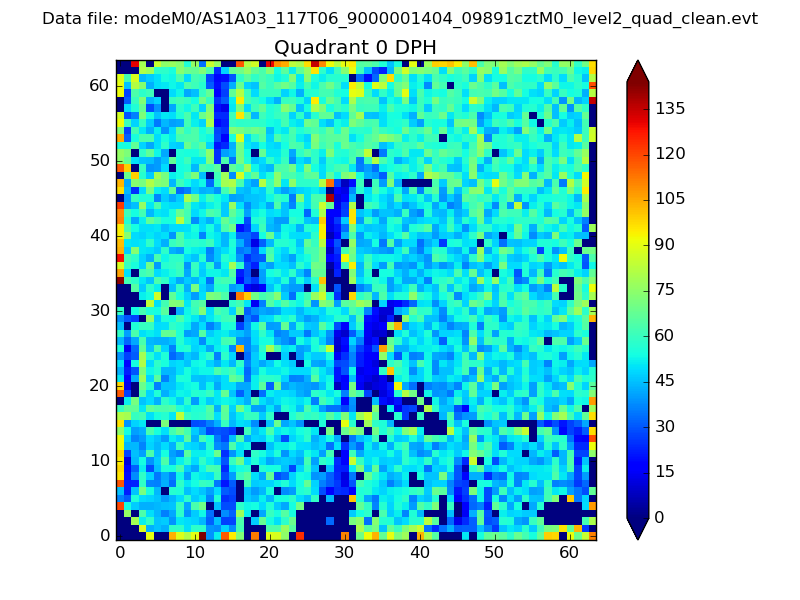 |
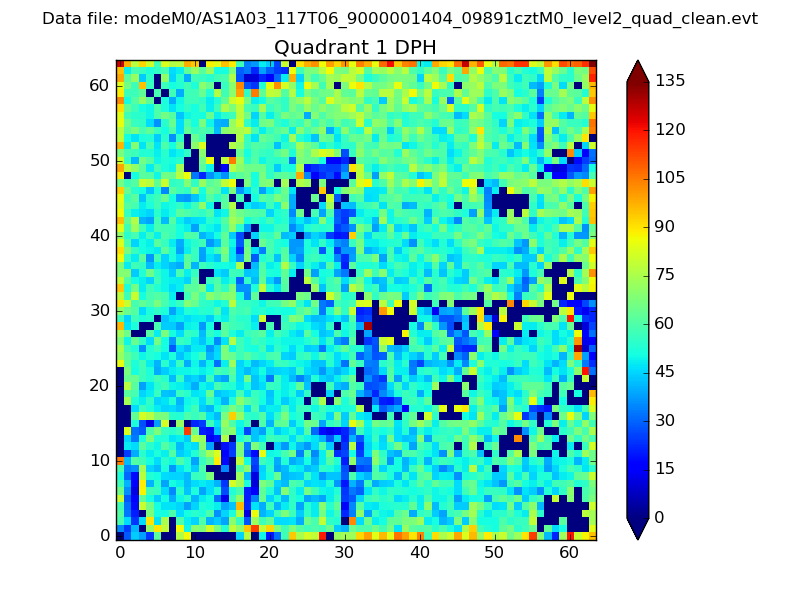 |
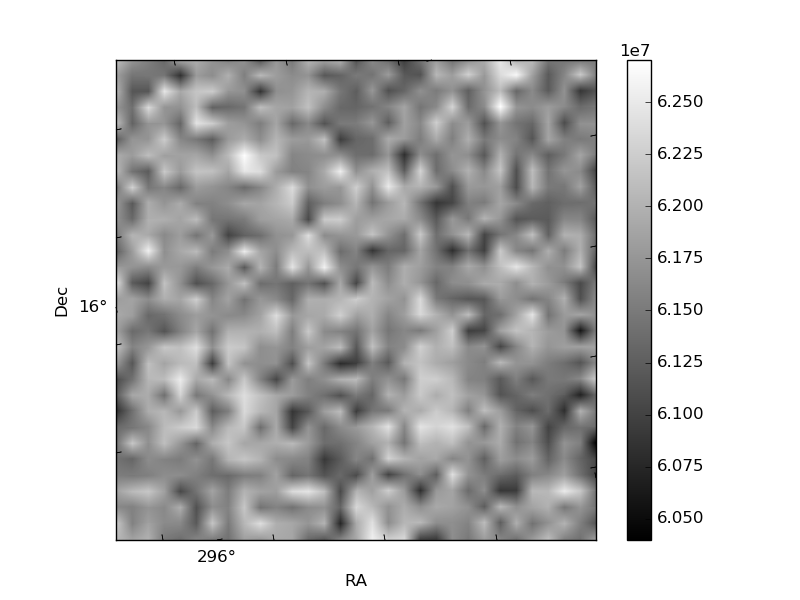
Quadrant B |
|---|---|---|---|
| Quadrant D | 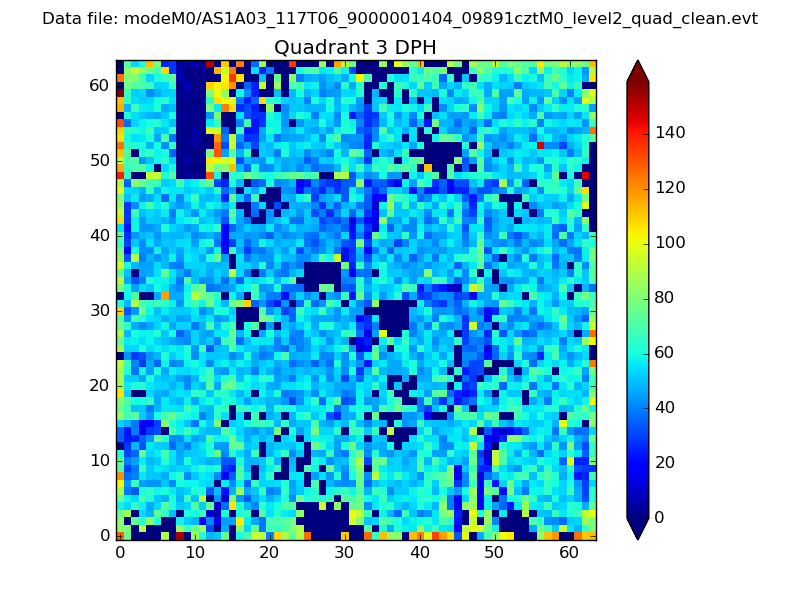 |
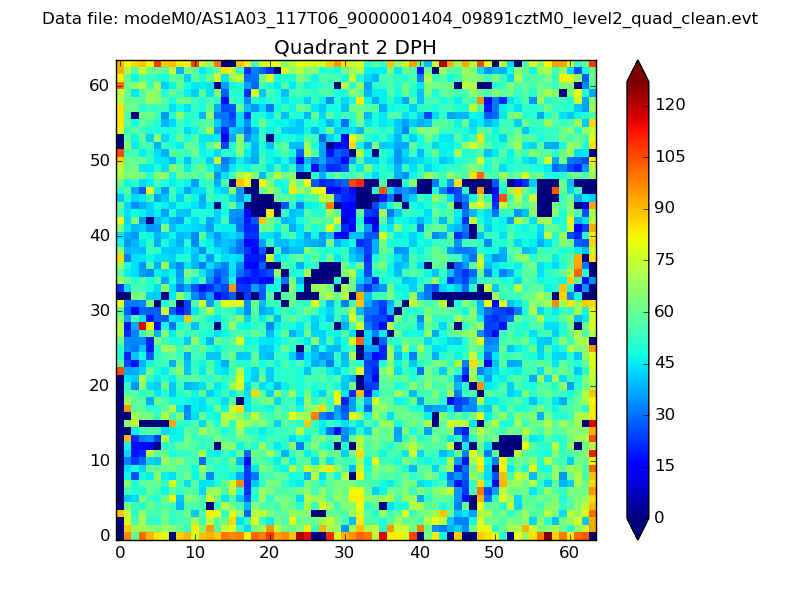 |
Quadrant C |
| Plot type | Count rate plots | Images |
|---|---|---|
| Comparison with Poisson distribution Blue bars denote a histogram of data divided into 1 sec bins. Red curve is a Poisson curve with rate = median count rate of data. |
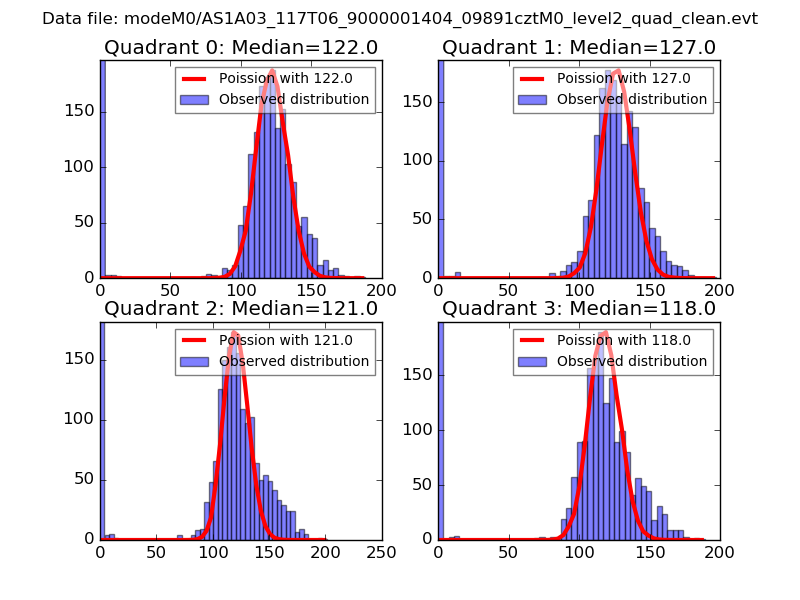 |
 |
| Quadrant-wise count rates Data is divided into 100 sec bins |
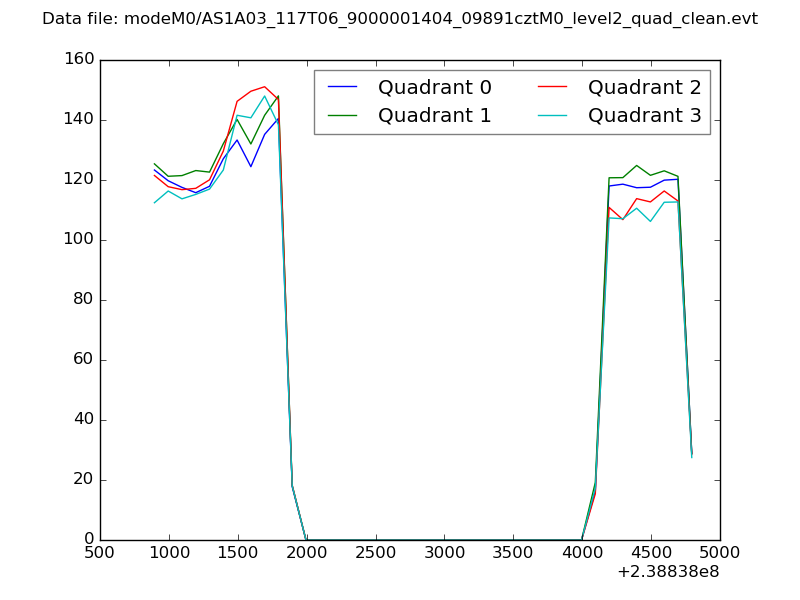 |
|
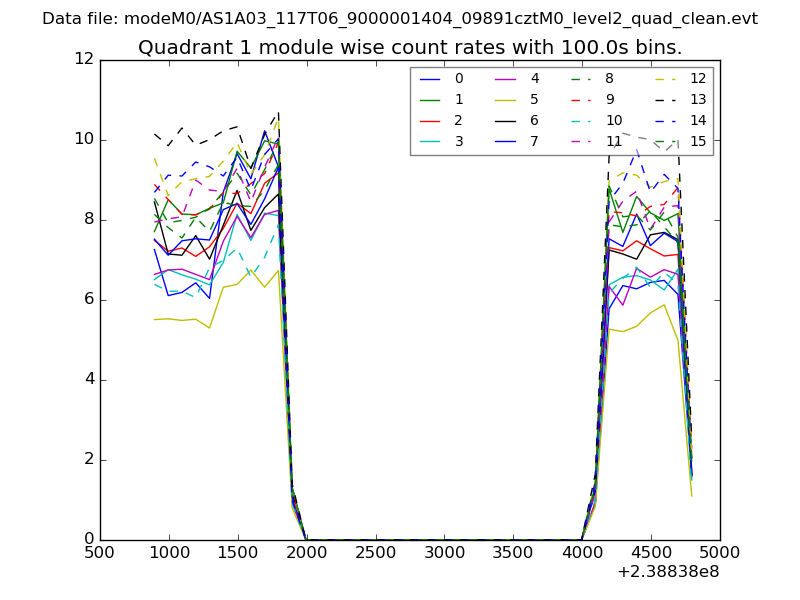
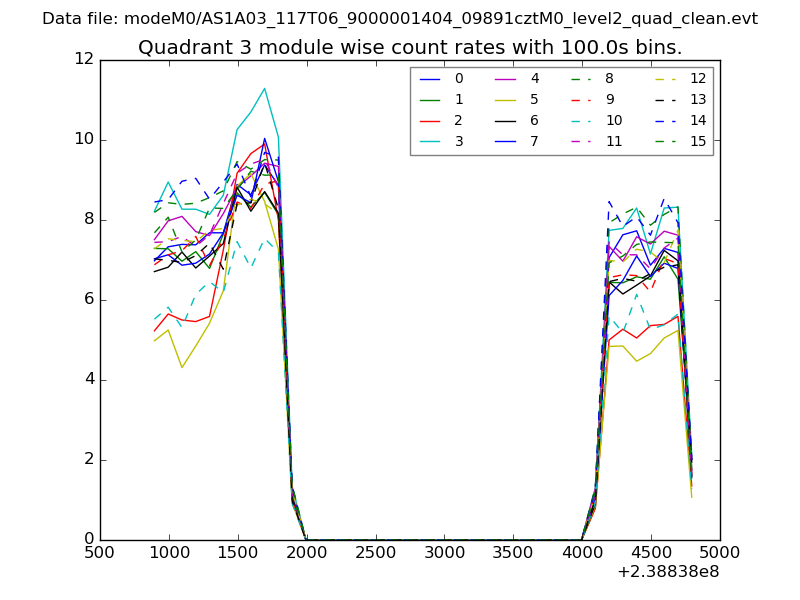
| Module-wise count rates for Quadrant A Data is divided into 100 sec bins |
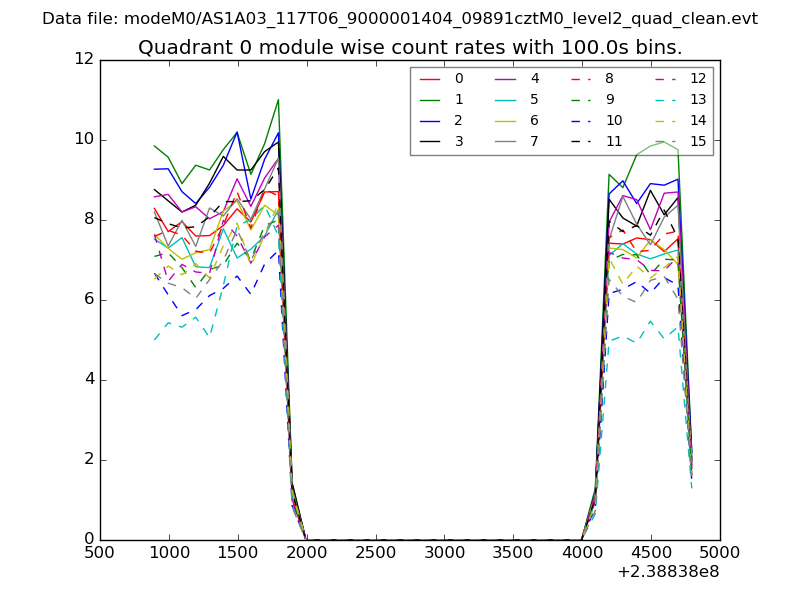 |
 |
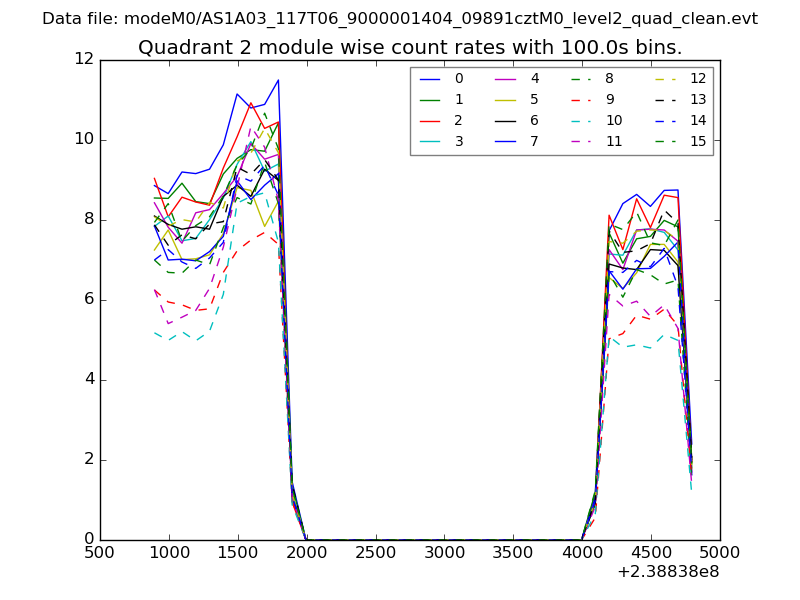
| Module-wise count rates for Quadrant B Data is divided into 100 sec bins |
 |
 |
| Module-wise count rates for Quadrant C Data is divided into 100 sec bins |
 |
 |
| Module-wise count rates for Quadrant D Data is divided into 100 sec bins |
 |
 |
| Parameter | Plot |
|---|---|
| CZT HV Monitor | 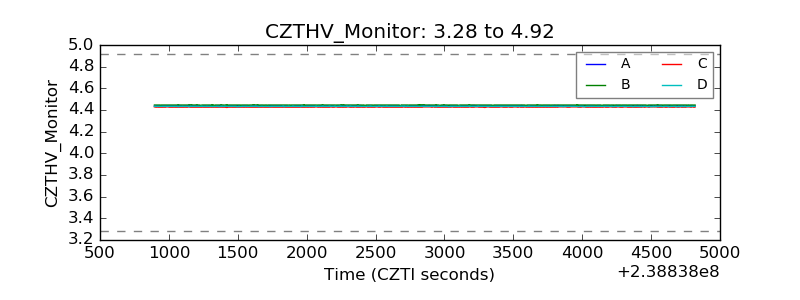 |
| D_VDD | 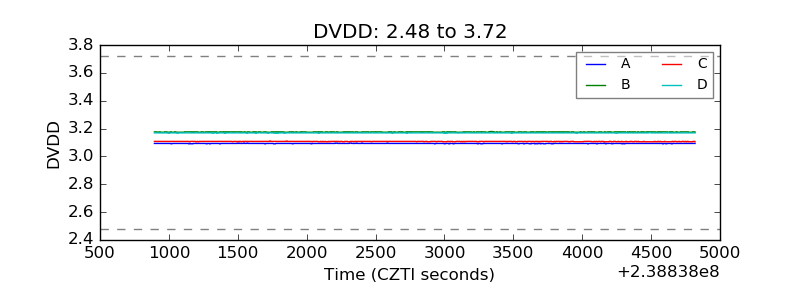 |
| Temperature 1 | 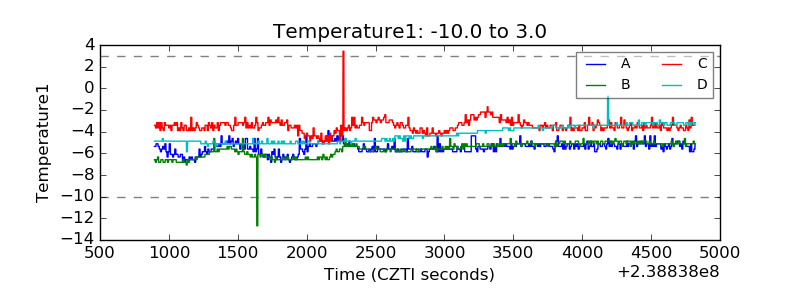 |
| Veto HV Monitor | 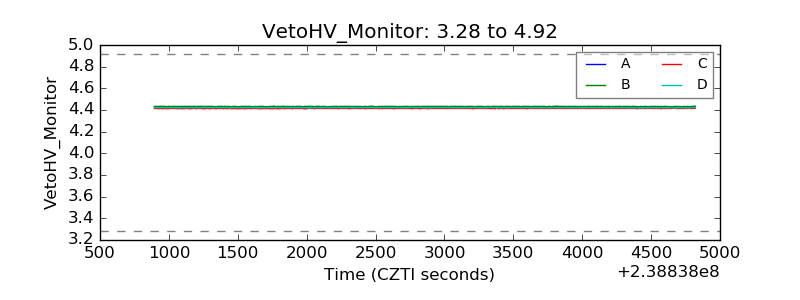 |
| Veto LLD | 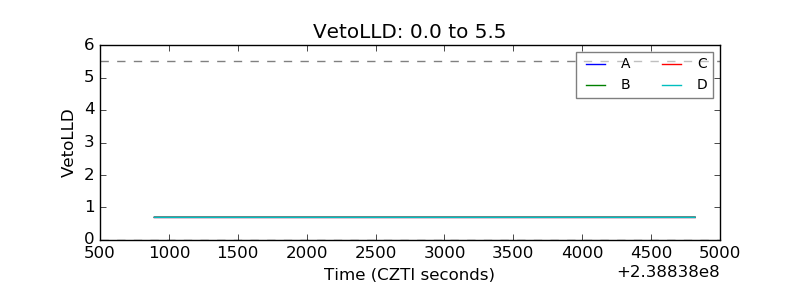 |
| Alpha Counter |  |
| _CPM_Rate | 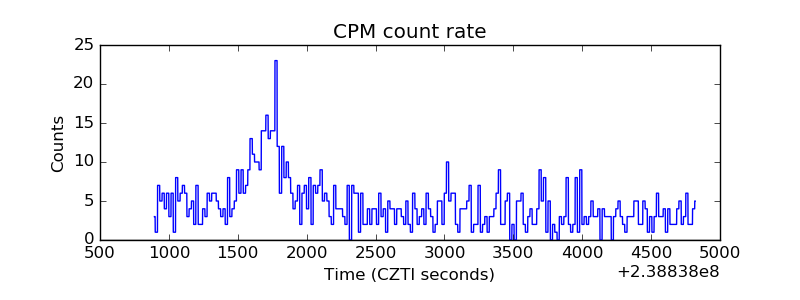 |
| CZT Counter | 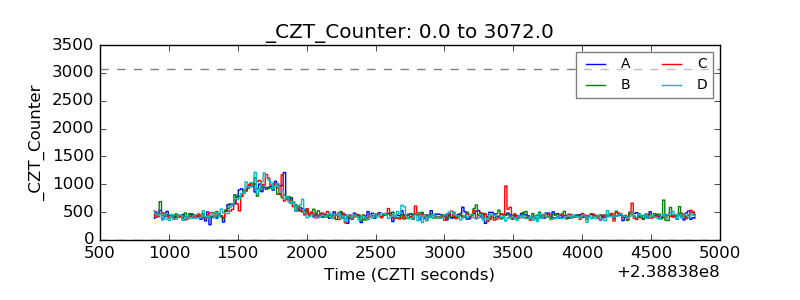 |
| +2.5 Volts monitor | 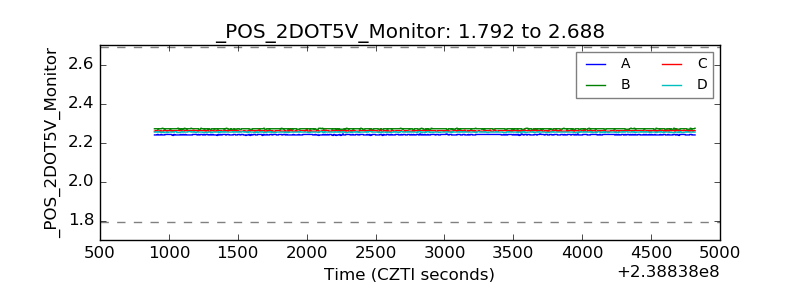 |
| +5 Volts monitor | 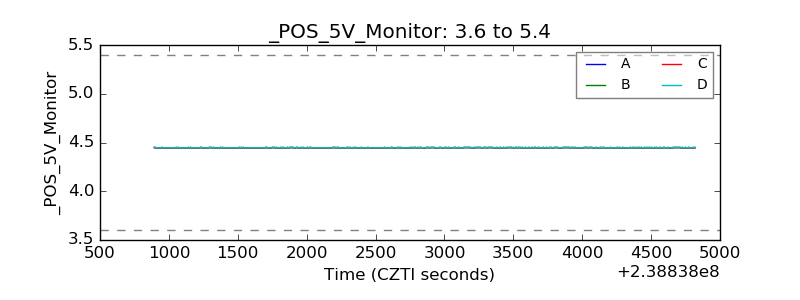 |
| _ROLL_ROT | 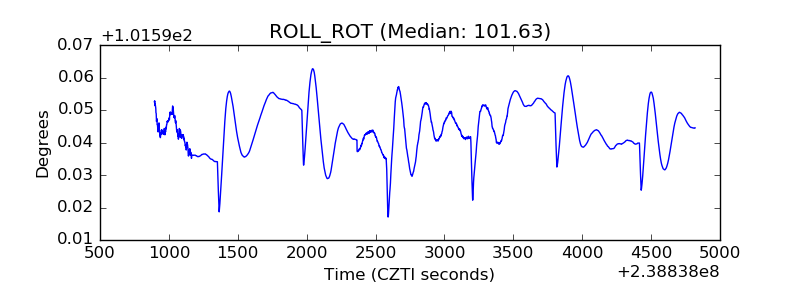 |
| _Roll_DEC | 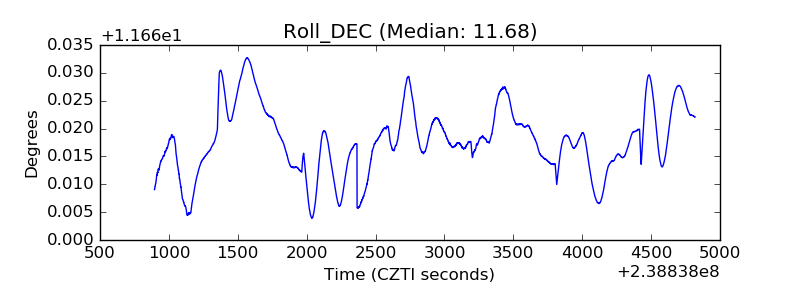 |
| _Roll_RA | 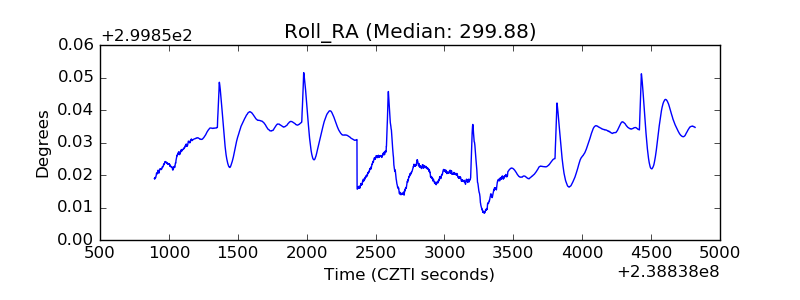 |
| Veto Counter | 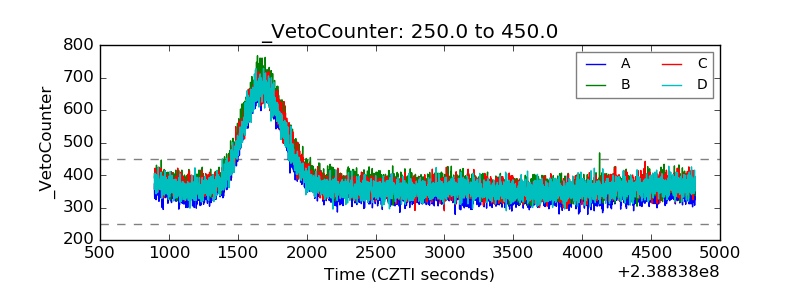 |