| Param | Original file | Final file |
|---|---|---|
| Filename | modeM0/AS1G07_031T01_9000001402cztM0_level2.fits | modeM0/AS1G07_031T01_9000001402cztM0_level2_quad_clean.evt |
| Size (bytes) | 73,886,400 | 39,064,320 |
| Size | 70.5 MB | 37.3 MB |
| Events in quadrant A | 445,998 | 169,921 |
| Events in quadrant B | 435,028 | 170,286 |
| Events in quadrant C | 447,768 | 162,587 |
| Events in quadrant D | 380,972 | 151,113 |
| Mode SS | |||
|---|---|---|---|
| Quadrant | BADHDUFLAG | Total packets | Discarded packets |
| A | 0 | 146 | 0 |
| B | 0 | 158 | 0 |
| C | 0 | 158 | 0 |
| D | 0 | 154 | 0 |
| Mode M9 | |||
|---|---|---|---|
| Quadrant | BADHDUFLAG | Total packets | Discarded packets |
| A | 0 | 22 | 0 |
| B | 0 | 21 | 0 |
| C | 0 | 21 | 0 |
| D | 0 | 21 | 0 |
| Mode M0 | |||
|---|---|---|---|
| Quadrant | BADHDUFLAG | Total packets | Discarded packets |
| A | 0 | 15764 | 0 |
| B | 0 | 16714 | 0 |
| C | 0 | 16443 | 0 |
| D | 0 | 18377 | 0 |
| Quadrant | Total seconds | Saturated seconds | Saturation percentage |
|---|---|---|---|
| A | 7602 | 26 | 0.342015% |
| B | 7586 | 73 | 0.962299% |
| C | 7600 | 52 | 0.684211% |
| D | 7584 | 204 | 2.689873% |
Noise dominated data is calculated using 1-second bins in cleaned event files. If a bin has >2000 counts, and if more than 50% of those come from <1% of pixels, then it is considered to be noise-dominated and hence unusable.
| Quadrant | # 1 sec bins | Bins with >0 counts | Bins with >2000 counts | High rate bins dominated by noise | Noise dominated (total time) | Noise dominated (detector-on time) | Marked lightcurve |
|---|---|---|---|---|---|---|---|
| A | 10141 | 7801 | 0 | 0 | 0.00% | 0.00% |  |
| B | 10141 | 7800 | 0 | 0 | 0.00% | 0.00% |  |
| C | 10141 | 7806 | 0 | 0 | 0.00% | 0.00% |  |
| D | 10141 | 7788 | 0 | 0 | 0.00% | 0.00% | 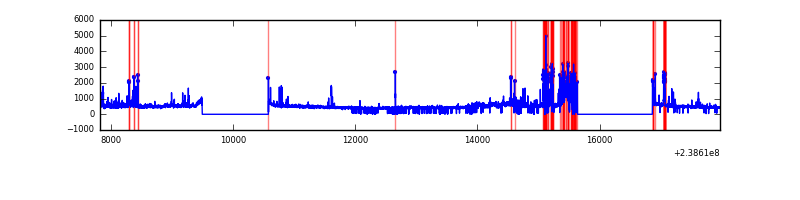 |
Top three noisy pixels from each quadrant. If the there are fewer than three noisy pixels in the level2.evt file, extra rows are filled as -1
| Pixel properties | Quadrant properties | ||||||
|---|---|---|---|---|---|---|---|
| Quadrant | DetID | PixID | Counts | Sigma | Mean | Median | Sigma |
| A | 0 | 29 | 440 | 10.63 | 116 | 109 | 31.1 |
| A | 7 | 110 | 390 | 9.03 | 116 | 109 | 31.1 |
| A | 9 | 19 | 363 | 8.16 | 116 | 109 | 31.1 |
| B | 2 | 9 | 388 | 11.26 | 114 | 109 | 24.8 |
| B | 2 | 8 | 311 | 8.16 | 114 | 109 | 24.8 |
| B | 3 | 80 | 311 | 8.16 | 114 | 109 | 24.8 |
| C | 12 | 241 | 331 | 6.69 | 118 | 110 | 33.0 |
| C | 1 | 80 | 306 | 5.93 | 118 | 110 | 33.0 |
| C | 3 | 158 | 301 | 5.78 | 118 | 110 | 33.0 |
| D | 6 | 231 | 272 | 5.62 | 108 | 99 | 30.8 |
| D | 12 | 6 | 269 | 5.52 | 108 | 99 | 30.8 |
| D | 6 | 83 | 267 | 5.45 | 108 | 99 | 30.8 |
Histogram calculated using DETX and DETY for each event in the final _common_clean file
| Quadrant A |  |
 |
Quadrant B |
|---|---|---|---|
| Quadrant D | 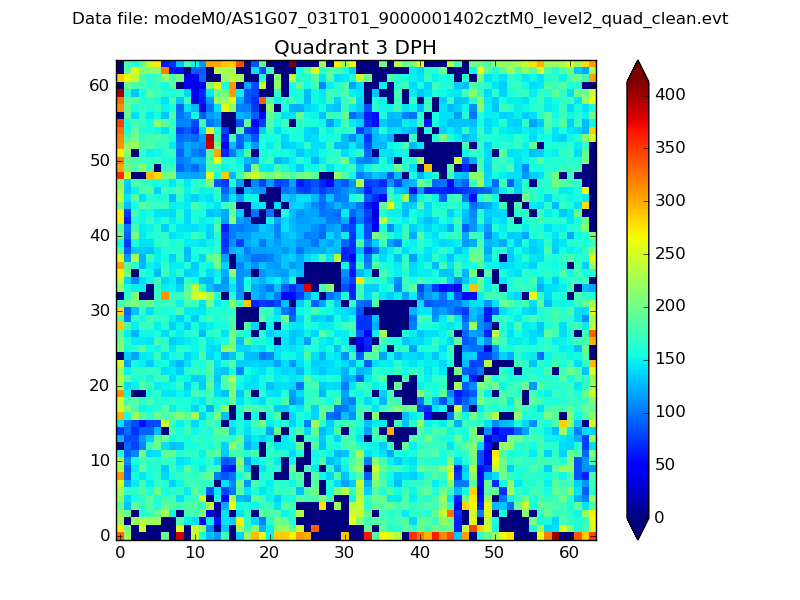 |
 |
Quadrant C |
| Plot type | Count rate plots | Images |
|---|---|---|
| Comparison with Poisson distribution Blue bars denote a histogram of data divided into 1 sec bins. Red curve is a Poisson curve with rate = median count rate of data. |
 |
 |
| Quadrant-wise count rates Data is divided into 100 sec bins |
 |
|
| Module-wise count rates for Quadrant A Data is divided into 100 sec bins |
 |
 |
| Module-wise count rates for Quadrant B Data is divided into 100 sec bins |
 |
 |
| Module-wise count rates for Quadrant C Data is divided into 100 sec bins |
 |
 |
| Module-wise count rates for Quadrant D Data is divided into 100 sec bins |
 |
 |
| Parameter | Plot |
|---|---|
| CZT HV Monitor |  |
| D_VDD | 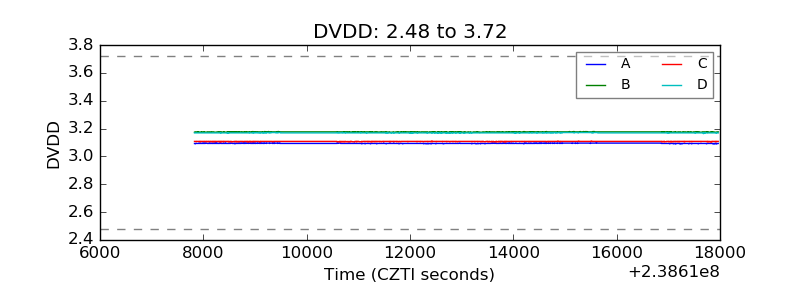 |
| Temperature 1 |  |
| Veto HV Monitor |  |
| Veto LLD |  |
| Alpha Counter |  |
| _CPM_Rate |  |
| CZT Counter |  |
| +2.5 Volts monitor |  |
| +5 Volts monitor |  |
| _ROLL_ROT |  |
| _Roll_DEC |  |
| _Roll_RA | 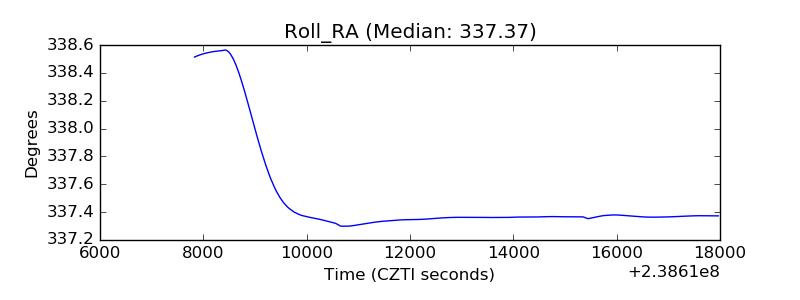 |
| Veto Counter |  |